Publisher’s version / Version de l'éditeur:
Vous avez des questions? Nous pouvons vous aider. Pour communiquer directement avec un auteur, consultez la première page de la revue dans laquelle son article a été publié afin de trouver ses coordonnées. Si vous n’arrivez pas à les repérer, communiquez avec nous à [email protected].
Questions? Contact the NRC Publications Archive team at
[email protected]. If you wish to email the authors directly, please see the first page of the publication for their contact information.
https://publications-cnrc.canada.ca/fra/droits
L’accès à ce site Web et l’utilisation de son contenu sont assujettis aux conditions présentées dans le site LISEZ CES CONDITIONS ATTENTIVEMENT AVANT D’UTILISER CE SITE WEB.
12th International Congress on the Chemistry of Cement [Proceedings], pp. 1-12, 2007-07-01
READ THESE TERMS AND CONDITIONS CAREFULLY BEFORE USING THIS WEBSITE.
https://nrc-publications.canada.ca/eng/copyright
NRC Publications Archive Record / Notice des Archives des publications du CNRC : https://nrc-publications.canada.ca/eng/view/object/?id=c0a5271f-3af4-4221-986a-3fd29afa0878 https://publications-cnrc.canada.ca/fra/voir/objet/?id=c0a5271f-3af4-4221-986a-3fd29afa0878
NRC Publications Archive
Archives des publications du CNRC
This publication could be one of several versions: author’s original, accepted manuscript or the publisher’s version. / La version de cette publication peut être l’une des suivantes : la version prépublication de l’auteur, la version acceptée du manuscrit ou la version de l’éditeur.
Access and use of this website and the material on it are subject to the Terms and Conditions set forth at Derivative conduction calorimetry
http://irc.nrc-cnrc.gc.ca
D e r i v a t i v e c o n d u c t i o n c a l o r i m e t r y
N R C C - 4 9 2 5 6
M a k a r , J . M . ; C h a n , G . W .
A version of this document is published in / Une version de ce document se trouve dans: 12th International Congress on the Chemistry of Cement, Montreal, July 7-12, 2007, pp. 1-12
The material in this document is covered by the provisions of the Copyright Act, by Canadian laws, policies, regulations and international agreements. Such provisions serve to identify the information source and, in specific instances, to prohibit reproduction of materials without written permission. For more information visit http://laws.justice.gc.ca/en/showtdm/cs/C-42
Les renseignements dans ce document sont protégés par la Loi sur le droit d'auteur, par les lois, les politiques et les règlements du Canada et des accords internationaux. Ces dispositions permettent d'identifier la source de l'information et, dans certains cas, d'interdire la copie de documents sans permission écrite. Pour obtenir de plus amples renseignements : http://lois.justice.gc.ca/fr/showtdm/cs/C-42
Derivative Conduction Calorimetry
J.M. Makar, G. W. Chan
Institute for Research in Construction, National Research Council Canada Ottawa, Ontario, Canada
Abstract: Derivative Conduction Calorimetry is a new approach to the
analysis of conduction calorimetry data. It is particularly useful in circumstances where multiple reactions take place during a single chemical process. This paper describes the methodology used for derivative conduction calorimetry. Examples of its use are given based on ordinary Portland cement hydration reactions, the hydration reactions of cement constituents and the effects of supplementary cementing materials and polycarboxalyte admixtures on those reactions. The benefits of Derivative Conduction Calorimetry are described and recommendations for its use are presented.
1 Introduction
Isothermal conduction calorimetry is a standard technique for the analysis of the hydration behaviour of ordinary Portland cement (OPC) and its consitutents [1]. While other thermal analysis techniques such as thermogravimetric analysis (TGA) and differential scanning calorimetry (DSC) examine the products of hydration reactions, conduction calorimetry provides in-situ information on the heat produced during the hydration process. As a result, conduction calorimetry is particularly useful in the analysis of the effects of cement admixtures and supplementary cementing materials (SCMs) on OPC hydration.
Conduction calorimetry measurements are produced by comparing the heat flow from an experimental chamber containing the hydrating material to that from an inert control chamber with the same total heat capacity. The measurements record the instantaneous heat produced by the hydration reactions in mW and the results are generally expressed as mW/g. The results of the measurements may also be integrated to give the total heat of the reaction at a given time.
The opposite procedure, taking the derivative of the heat flow measurements, has not, in contrast, been used in conduction calorimetry analysis. Previous generations of equipment did not provide sufficient accuracy or resolution for this type of measurement. However, the most modern isothermal conduction calorimeters use computer based data recording systems to produce data that is sufficiently accurate to serve as a basis for derivative calculations. In a manner similar to the advantages of the derivative forms of TGA, DSC and other thermal measurements in
identifying complex thermal behaviour[2], derivative conduction calorimetry analysis (dCCA) helps to identify the presence and extent of different reactions during OPC hydration, making it easier to trace the effects of changes in reaction conditions and additives.
This paper draws on the results of an on-going study of tricalcium silicate
(C3S) and OPC hydration[3,4] to provide a survey of the results that can
be expected from the use of dCCA. Examples are provided by investigating the impact of the addition of OPC constituent elements, fly ash, and polycarboxalyte superplasticizers on the hydration process. Reference is made to the underlying causes that create those impacts, but the full details of the physical and chemical mechanisms can be found elsewhere [3,4] and in forthcoming papers.
2 Experimental and Analytical Details
One and five gram samples of pure C3S (CTL, Inc.) and OPC (Lafarge
Type 10) were hydrated in a Thermometric Tam Air Isothermal Calorimeter (model 3114) using Accusolv (Anachemia, Inc.) water with a maximum impurity level of 1 ppm at a water/cement (w/c) ratio of 0.5 by mass. All measurements were conducted at a constant temperature of
24oC. All data were recorded at 1 minute intervals with a typical
uncertainty of ±0.002 mW/g using a computer based data acquisition
system. While the same production batches of C3S and OPC were used
for all of the results reported here, the fundamental hydration behaviour in
Figures 1 and 2 were observed for all cements (seven C3S and four OPC)
that have been examined to date. Additional samples were hydrated with varying contents of tricalcium aluminate (C3A), tetracalcium aluminoferrite
(C4AF), Point Tupper type F fly ash and polycarboxalyte superplasticizer.
In the case of first three series of experiments, the total content of cementitious or pozzolanic materials was held constant. The superplasticizer was added to the mix water and the weight of the liquid used for hydration kept constant at 0.5g for use with 1 gram cement samples.
The high signal to noise ratio of the recorded data allowed it to be smoothed (Sigmaplot 9.0, Systat Software, Inc.) to reduce the remaining background noise and allow derivatives to be taken. The smoothing was
done using a Gaussian weighting function (e-u^2, where u is the normalized
distance of the data used in the smoothing), typically with a third order polynomial regression. Considerable care was taken to ensure that the smoothing process did not affect the underlying shape of the hydration curve. First and second order derivatives of the heat flow data with respect to time were then calculated from the smoothed data using a standard numerical approach[5]. One gram samples typically produced significantly noisier experimental results, which was reflected in the quality
of the derivatives. No additional information was gained from the second order derivatives.
3 Results and Discussion
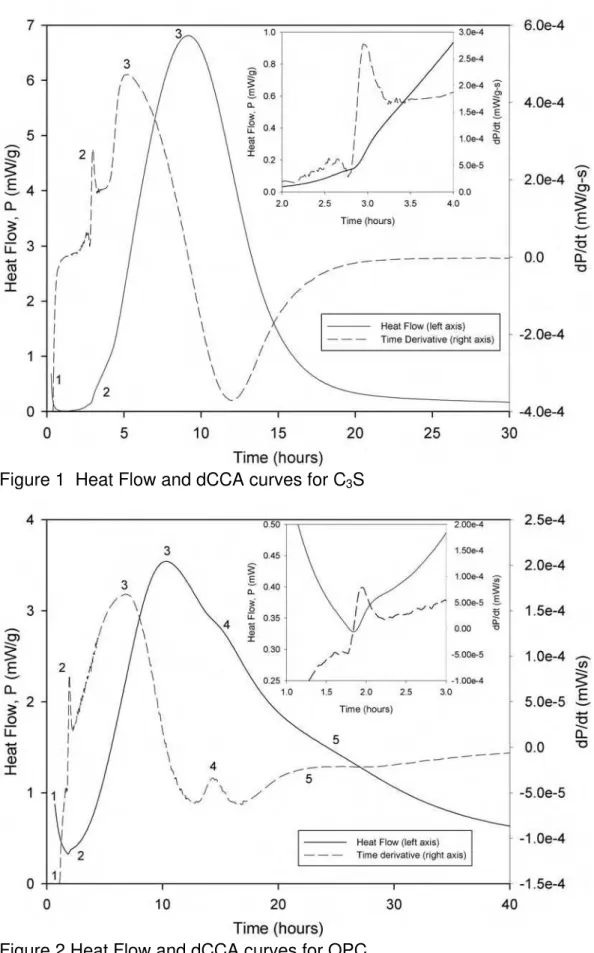
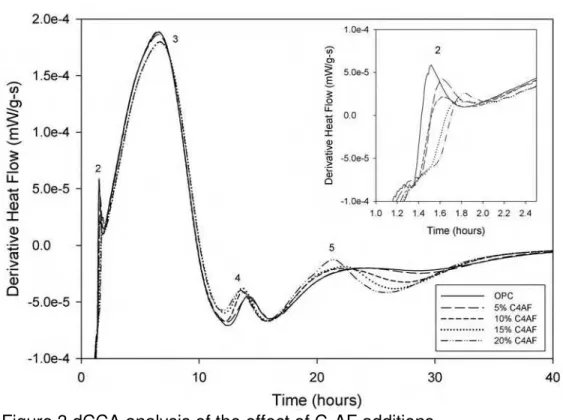
Figures 1 and 2 show standard and derivative results from conduction
calorimetry measurements of C3S and OPC respectively. Three peaks in
the reaction process can be identified in the C3S results, with five being
present in the case of OPC. Peak 1 is associated with the initial heat
generated on wetting and, in the case of OPC, the initial C3A reactions.
As very early data was subject to fluctuations produced as the apparatus establishes thermal equilibrium, only the final stages of peak 1 are shown.
Peak 3 is the primary C3S reaction. Peak 4 has been associated with the
formation of ettringite [6], while peak 5 has been associated with either the hydration of tetracalcium aluminoferrite (C4AF) [6] or the conversion of AFt
phases such as ettringite to AFm [7]. Peaks 4 and 5 are clearly more visible in the dCCA results than in the heat flow measurement.
Peak 2, which appears in both figures, is difficult to identify in the heat flow data, but is readily apparent in dCCA data. The insets in Figures 1 and 2 show close ups of the relevant area of the heat flow curve. A much more prominent form of peak 2 has been seen occasionally in the literature [8],
but dCCA results identify it in all C3S and OPC measurements made to
date. Peak 2 has been associated with the initial formation after the induction period of calcium silicate hydrate (C-S-H) on the surface of the cement grains [2,3].
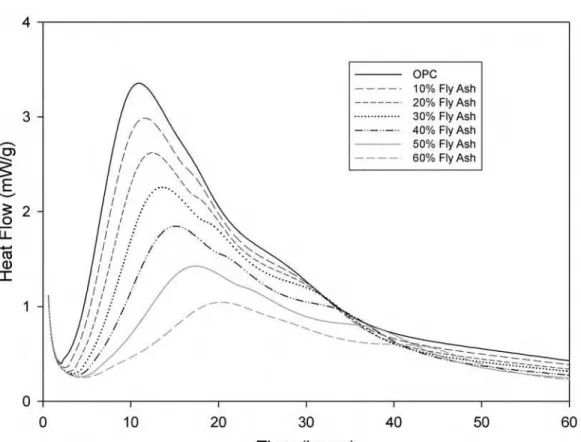
Additional insight into peaks 4 and 5 can be obtained by applying dCCA to
hydration behaviour of OPC with additions of C4AF (Figure 3). The results
of Figure 3 are per gram of OPC, rather than the OPC and C4AF to allow
direct comparison of the effect of the C4AF on the C3S and C3A reactions.
The increasing presence of C4AF does not affect the main C3S reaction.
However, as shown in the inset, it does appear to reduce and delay the peak 2 reaction. The formation of ettringite (peak 4) is somewhat
accelerated by the increasing presence of the C4AF, but the size of the
peak is reduced. Peak 5, however is noticeably increased by the addition
of C4AF, making peak 5 the first peak that increases in size with
increasing C4AF content. These results therefore support the position
that peak 5 is due to C4AF hydration and the formation of AFt phases,
rather than the AFt to AFm transition [7]. The change in peak 2 suggests
that the additional C4AF is slowing the initial nucleation of C-S-H on the
surface of the cement grains. In both cases, the changes in hydration behaviour are clearer using dCCA than with conduction calorimetry alone.
Figure 1 Heat Flow and dCCA curves for C3S
Figure 3 dCCA analysis of the effect of C4AF additions
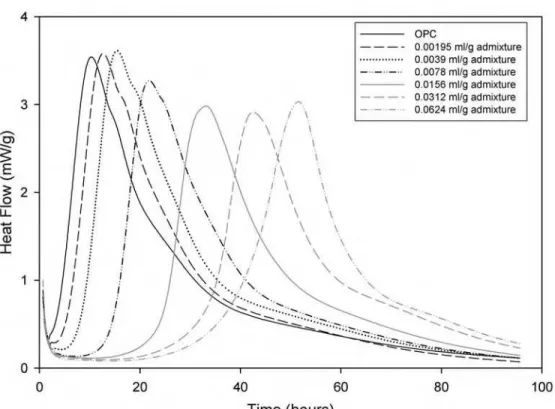
While dCCA is able to highlight subtle changes in reaction processes, an additional advantage of the technique is that it simplifies numerical comparison of the effects of increasing additive content on hydration processes. Figures 4 to 7 illustrate this effect using additions of Point Tupper Type F fly ash as a supplementary cementing material in OPC. Results are recorded on the basis of the total weight of cementitious material, not total weight of OPC. In Figure 4, where the conduction
calorimetry results are shown, only the C3S maxima was easily located
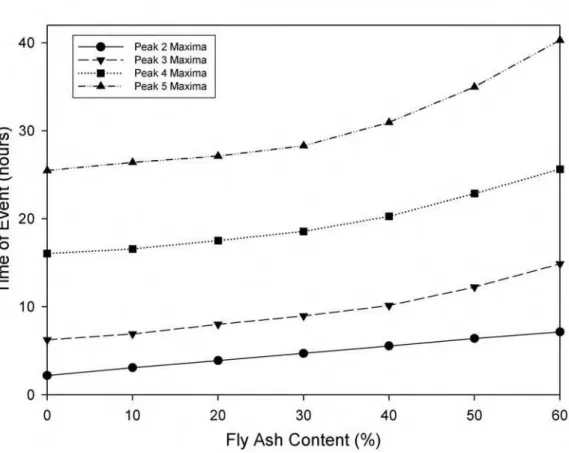
and recorded. In Figure 5, the clear maximas and minimas associated with all the reaction peaks allowed the simple recording of the behaviour of each of the hydration peaks and the plotting of the results to highlight the impact of the fly ash on the different hydration reactions. Figures 6 and 7 show two examples of secondary analysis, with Figure 6 being the time of each maxima plotted against the fly ash content and Figure 7 the value of those maximas.
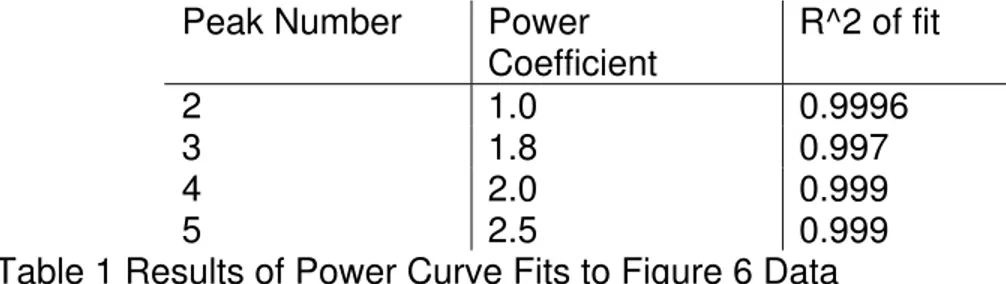
Both types of secondary analysis help to illustrate the effect of fly ash on the different processes involved in OPC hydration. In Figure 6, the delay in the onset of the peak 2 maxima produced by adding fly ash is linear, while all of the other curves obey higher order power laws (Table 1). In Figure 7, the peak 2 maxima originally increases in value, but then falls off linearly. Both the peak 3 and peak 5 maximas also change in a linear fashion, but the peak 4 maxima is clearly changes in a non-linear fashion with increasing fly ash content.
Figure 4 Effects of Fly Ash on OPC hydration using conduction calorimetry
Figure 6: Effect of Fly Ash on the Timing of dCCA maximas in OPC
Peak Number Power Coefficient R^2 of fit 2 1.0 0.9996 3 1.8 0.997 4 2.0 0.999 5 2.5 0.999
Table 1 Results of Power Curve Fits to Figure 6 Data
More work is needed to fully understand these differences, but the results in Figure 6 fit well with the concept of peak 2 being created by the nucleation and growth of C-S-H on the surface of the cement grains, with the remaining peaks representing bulk processes. The behaviour of the peak 2 maxima in Figure 7 suggests that the fly ash initially enhances the surface nucleation and growth process, possibly through providing more nucleation sites, but that at higher concentrations, the processes that reduce the peak 3 and 5 maximas may also impede the initial surface reactions. It is worth noting that the differences in the dCCA curves in Figure 5 due to increasing fly ash content indicate that the presence of the fly ash actively impedes the hydration processes. This effect is apparent even if the conduction calorimetry results are adjusted to be based on weight of cement. An exception is the ettringite (peak 4) maxima, which initially increases in magnitude with increasing fly ash content (Figure 5), but falls off in value beyond 30% fly ash content.
Another application of dCCA is in the clarifying of differences in behaviour
between OPC and C3S. Figures 8 and 9 give the conduction calorimetry
curves for the two materials under the influence of varying contents of polycarboxalyte admixtures, while Figures 10 and 11 are the corresponding dCCA results. An admixture concentration of 0.0078 ml/g is the maximum concentration recommended by the manufacturer, while the other concentrations are fractions or multiples of that value. Note that the concentrations and the line markings are consistent throughout the four graphs with two exceptions. An additional concentration of 0.00585
ml/g was used with C3S in place of the OPC maximum concentration of
0.0624 ml/g as the C3S hydration was more strongly affected by the
presence of the admixture than is that of the OPC.
At first glance, the hydration behaviour of the 0.0078 ml/g admixture
concentration measurement in C3S appears to be similar to that produced
by the maximum concentration of admixture in OPC, having an apparently similar shape and with the maximum heat flow occurring at the about the same time. These results would fit well with the concept that
superplasticizers are less effective in OPC than in C3S due to partial
adsorption on C3A or its reaction products[9]. If this were the case, higher
concentrations of superplasticizer would be expected to compensate for the effects of adsorption.
Figure 8: Effects of polycarboxalyte admixture on OPC using conduction calorimetry
Figure 9 Effects of polycarboxalyte superplasticizer on C3S hydration by
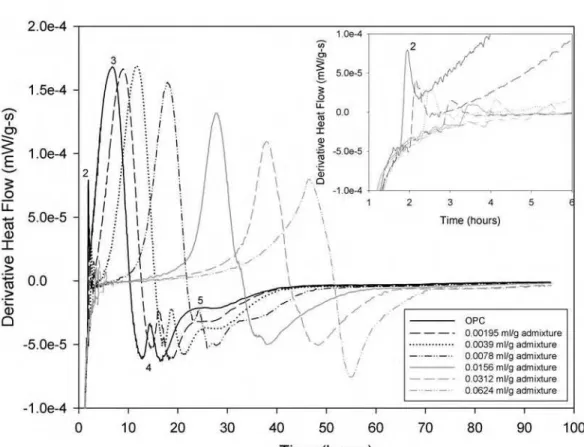
Figure 10 Effects of polycarboxalyte superplasticizer on OPC using dCCA
However, examination of the dCCA results showed that the two hydration curves had different shapes, suggesting the effect of the interaction
between the non-C3S constituents in OPC and the admixture was more
complex than would be produced by partial absorption alone. The behaviour of the peak 2 maximas in Figures 10 and 11 may give an indication of the processes in play. In the case of OPC (Figure 10 inset), the peak 2 maximas were reduced in size and somewhat delayed. A significant separation in time occurred between peak 2 and the onset of
peak 3. In C3S, the peak 2 process at admixture concentrations of 0.0039
to 0.0078 ml/g appeared to be so reduced and spread out in time as to be completely eliminated as an independent peak. Peak 2 also remained
located at the beginning of the main C3S hydration activity in case of a
0.00178 ml/g concentration rather than showing the type of separation observed for OPC. A second peak in the hydration activity appeared in the highest admixture concentration results, but it is not clear if it originated in the same events that produced peak 2 at low concentrations.
This result suggests that one of the roles C3A played in the
OPC/superplasticizer interactions was allowing the initial surface nucleation of C-S-H to occur more rapidly and to a greater extent than
would be the case for C3S, perhaps by acting as additional nucleating
sites or by preventing the admixture from completely coating the C3S
portion of the cement grain surface. As a result, C-S-H formed more rapidly during the rest of the hydration process in OPC than would be the case for C3S alone.
4 Conclusion
Derivative conduction calorimetry analysis permitted an additional level of quantitative analysis of cement hydration reactions than was possible using conduction calorimetry alone. Benefits included the identification of difficult to observe peaks in the hydration process, increased understanding of the role of different constituents in OPC hydration, new approaches to analyze the effects of admixtures and SCMs, and better routes to compare results recorded from the hydration of different cementitious materials. Similar benefits would be expected when conduction calorimetry is employed to investigate other heat producing chemical processes. Although the quality of dCCA results is dependent on the quality of the original data, modern conduction calorimetry instruments provide results of sufficient accuracy to enable dCCA to become a standard analysis procedure, just as is the case for derivative TGA and DSC. The simplicity of the calculation procedure suggests that future conduction calorimeter control software could include derivative analysis options, allowing cement researchers a new tool to understand cement hydration reactions. In addition to the uses presented here, dCCA is therefore also likely to be useful in OPC quality control as a method of determining how composition changes will affect hydration performance.
5 References
[1] V.S. Ramachandran, et al. in “Handbook of Thermal Analysis of Construction Materials”, (Noyes Publications, Norwich, New York, 2003), p. 26.
[2] V.S. Ramachandran in “Applications of Differential Thermal Analysis in Cement Chemistry” (Chemical Publishing Company, New York, 1969), p. 48.
[3] Makar, J.M., Chan, G.W. and Esseghaier, K.Y., “A Peak in the Hydration Reaction at the End of the Cement Induction Period”, to be published in Journal of Materials Science Letters, 2007.
[4] Makar, J.M. and Chan, G.W., “A cold field emission-scanning electron microscopy study of the early hydration of ordinary Portland cement”, to be submitted to Journal of the American Ceramic Society, 2006. [5] A. Ralston and P. Rabinowitz in “A First Course in Numerical Analysis”
(Dover Publications, Mineola, New York, 2001), p. 93.
[6] P.L. Pratt and A. Ghose, Phil. Trans. R. Soc. Lond. A, 310 (1983) 93. [7] Scrivener, K.L. in “Materials Science of Concrete I”, J.P. Skalny, editor
(American Ceramic Society, Westerville, OH, USA, 1989), p.127.
[8] P. Longuet, Proceedings of the Fifth International Symposium on the Chemistry of Cement (Tokyo, Oct 7-11, 1968), Part II, vol. II (1969) 30. [9] R. Rixom and N. Mailvaganam in “Chemical Admixtures for Concrete”,
![[PDF] Support de cours PDF pour debuter avec le developpement sous postgresql - Cours SQL](data:image/gif;base64,R0lGODlhAQABAIAAAP///wAAACH5BAEAAAAALAAAAAABAAEAAAICRAEAOw==)