Atomistic Simulations of Octacyclopentyl Polyhedral Oligomeric
Silsesquioxane Polyethylene Nanocomposites
by
Franco M. Capaldi M.S. Mechanical Engineering
Massachusetts Institute of Technology, 2001 B.S. Mechanical Engineering
Brown University, 1999
SUBMITTED TO THE DEPARTMENT OF MECHANICAL ENGINEERING IN PARTIAL FULFILLMENT OF THE REQUIREMENTS FOR THE DEGREE OF
DOCTORATE OF PHILOSOPHY IN MECHANICAL ENGINEERING AT THE
MASSACHUSETTS INSTITUTE OF TECHNOLOGY
JUNE 2005 MASSACHUSETTS INSTI UTE
OF TECHNOLOGY 0 Franco M. Capaldi. All rights reserved.
JU
62005
The author hereby grants to MIT permission to reproduceAnd to distribute publicly paper and electronic
LIBRARIES
copies of this thesis document in whole or in part.Signature of Author:
Department of Mechanical Engineering 005 Certified by:
. nOyce Professor of Mechanical Engineering
ory C. Rutledge
tical Engineering Accepted by:Lallit Anand Chairman, vepartmen Lommittee on Graduate Students
Atomistic Simulations of Octacyclopentyl Polyhedral Oligomeric Silsesquioxane
Polyethylene Nanocomposites
Franco M. Capaldi
Submitted to the Department of Mechanical Engineering
On March 14, 2005 in Partial Fulfillment of the
Requirements for the Degree of Doctorate of Philosophy in
Mechanical Engineering
As the scientific community develops the ability to create composites which incorporate nanoscopic filler particles, the detailed atomic arrangement and atomic interactions become significant in determining the composite properties. Nanoscopic fillers such as carbon nanotubes, polyhedral oligomeric silsesquioxane (POSS), and layered silicates have already been successfully used to improve the thermal and mechanical properties of polymers. On this length scale, details describing particle organization, interaction between particles, and interactions between particle and matrix are needed to understand the behavior of the composite.
In this thesis, we use atomistic simulations to investigate the detailed behavior of a blended octacyclopentyl polyhedral oligomeric silsesquioxane (CpPOSS) / polyethylene (PE) nanocomposite. The model potential employed to describe the atomic interactions in these systems is capable of reproducing the experimental vibrational and crystal structures for the POSS well. The mechanical properties of an infinite crystal were calculated. They are anisotropic with a Reuss average isotropic elastic modulus of 11.78 GPa.
Simulations of CpPOSS/PE composites revealed that the POSS had a stiffening effect on the polymer. Simulations revealed that both PE and POSS dynamics as measured by translational and rotational diffusivities decreased, the glass transition temperature increased, and both the density and modulus increased with increasing POSS content. Micromechanical models were fit to the composite modulus which allowed effective mechanical particle sizes to be determined.
The POSS was found to aggregate into small necklace structures which have internal ordering similar to the crystal phase. The formation of crystallites was found to be energetically favorable in this system. A coarse grained potential which accounts for both the attraction and orientation between particles was developed to aid the further study of aggregation and crystallization in these composites.
The interface between the POSS and the polymer is found to consist of polymer chains aligned tangentially to the POSS cage. This layer has increased mobility tangential to the surface of the particle and decreased mobility in the radial direction. Though it is very thin, consisting of only
1
or 2 monolayers of polymer, due to the small size of the POSS particle, the weight fraction of polymer in the interfacial region is as high as 43 % in the 25 weight percent CpPOSS/PE composite. These simulations reveal the formation of structure on both the angstrom length scale in the polymer near the interface and the mesoscopic length scale between the POSS particles.Thesis Supervisors:
Mary C. Boyce
Acknowledgements
I have been extremely fortunate to work with many amazingly talented and helpful
people. All have impacted my work and life in some way or another and for this I am
thankful. I would like to thank my thesis advisors, Professor Mary Boyce and Professor
Gregory Rutledge for their guidance, advice and for providing a first-rate research and
learning environment. Thanks to my thesis committee members, Professor Robert Cohen
and Professor Nicolas Hadjiconstantinou, for thoughtful discussions. I am grateful to the
National Science Foundation and the Air Force Office of Scientific Research for the
financial support of my graduate work.
In the Mechanics and Materials group, I have known and worked with many great people
who have made my time at MIT enjoyable. Though I cannot possibly list them all, special
thanks to Mohit, Mats, Mike, Ethan, Rebecca, Dora, Sauri, Brian, Prakash, Tom, Hang,
Jin, Matt, Rami, Steve, Antonio, Numan, Ahmed, Markus, Pieter, Fred, Sergei, Vikram,
Amrit, Michelle, Ed, and Adam. Also, I would like to thank the staff of the Mechanical
Engineering Department, and the mechanics group Una, Ray, Leslie and Joan for making
my life much easier.
Most of all, I express my gratitude to my entire family. Thanks to my mother, father and
sister, Laura, for their constant encouragement and support, and the faith they have
shown in me and especially to my wife, Irene, for providing inspiration, motivation, love,
and
just
about everything else I have needed throughout my time here.
Table of Contents
Acknowledgem ents ... iii
Table of Contents... iV L ist o f F ig u re s ... v i L ist o f T ab le s ... v ii Chapter 1I Introduction ... 11
1.1 Polym er N anocomposites ... 11
1.2 Polyhedral Oligom eric Silsesquioxane ... 14
Chapter 2 M ethodology ... 25
2.1 M onte Carlo ... 25
2.2 M olecular Dynam ics... 27
Chapter 3 M odeling Cyclopentyl POSS ... 34
3.1 M odel Potential... 35
3.2 Vibrational Frequencies ... 39
3.3 Crystal Structures... 42
3.4 M echanical Properties... 47
3.5 CpPOSS Cohesive Energy... 51
3.6 Ring Dynam ics... 56
3.7 Discussion... 62
Chapter 4 CpPOSS/Polyethylene Nano-composites... 67
4.1 Description of Simulations... 67
4.2 Length Scales... 69
4.2.1 A verage Particle Separation... 69
4.3 Radius of Gyration... 72
4 .4 D iffu sio n ... 7 3 4.5 Rotational Diffusion... 76
4.6 Aggregation... 78
4.12.1 Guth G old M odel... 100
4.12.2 M ori-Tanaka M odel... 102
4.13 Discussion... 109
Chapter 5 Interfaces ... 115
5.1 Density Fluctuations Near the Particle... 115
5.2 Structural M easures of Interface Thickness... 121
5.3 Dynam ical M easures of Interfacial Thickness ... 124
5.4 Radial and Circum ferential Dynamics within the Interface... 127
5.5 Radius of Gyration Near the CpPOSS ... 129
5.6 Fraction of Polym er found within the Interface... 131
5.7 Discussion... 133
List of Figures
Figure 1-1. a) Schematic of the silicate cage. (R8Si8012). b) Schematic of the Cyclopentyl
(C 5H 9) R -groups used in this study... 19
Figure 3-1. Crystal Structure of Octasilsesquioxane... 46
Figure 3-2. Crystal Structure of Octacyclopentylsilsesquioxane... 46
Figure 3-3: C pPO SS in a vacuum ... 54
Figure 3-4: Single CpPOSS embedded within a Polyethylene matrix... 54
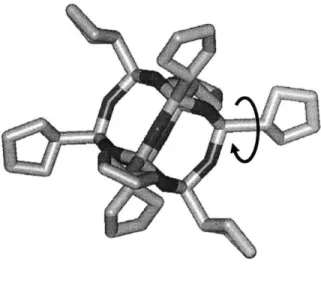
Figure 3-5: Figure illustrating the dihedral angle that is being monitored. The dihedral angle being m onitored is indicated by the arrow ... 58
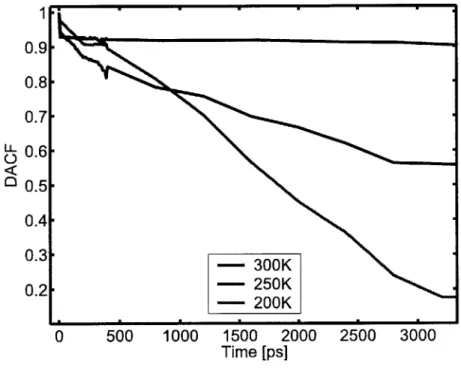
Figure 3-6: Dihedral angle autocorrelation functions for a single CpPOSS particle in a vacuum... 58
Figure 3-7: Dihedral angle relaxation times for CpPOSS in a vacuum. ... 59
Figure 3-8: Dihedral angle autocorrelation functions for an infinite CpPOSS crystal. ... 59
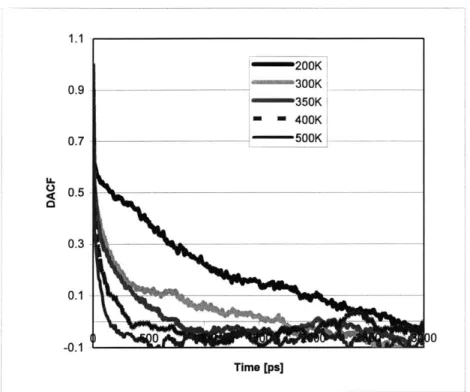
Figure 3-9: Dihedral angle autocorrelation functions for a PE/CpPOSS composite. ... 60
Figure 3-10: Dihedral angle relaxation times for PE/CpPOSS composite... 60
Figure 4-1. Mean squared displacement (MSD) of carbon atoms in the polymer at 500K and 3 0 0 K ... 7 5 Figure 4-2. Mean squared displacement of Silicon atoms at 500K and 300K... 75
Figure 4-3. Bond autocorrelation function (BACF) for Si-O bonds at 500K for 5, 15, and 25 wt % C pP O S S/P E com posite. ... 77
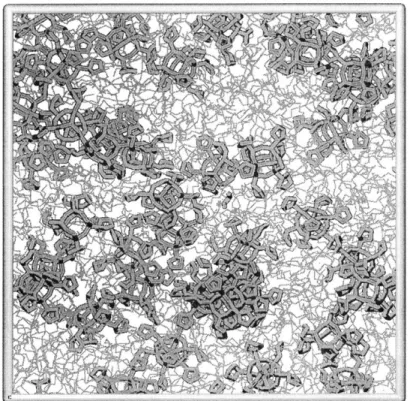
Figure 4-4. Snapshot of initial configuration for a 25 weight percent CpPOSS/PE system. ... 80
Figure 4-5. Snapshot of system after equilibration at 500K and cooling to 300K... 80
Figure 4-6: Snapshot of cluster within the 25 weight percent sample at 300K. ... 81
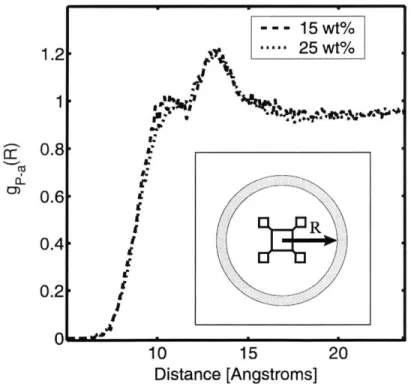
Figure 4-7. Radial distribution function, gP-A(R), of 15 and 25 wt % CpPOSS/PE composite at 500K. The inset illustrates the measurement of R from the center of the POSS particle. ... 81
Figure 4-8. Radial distribution function, gPA(R), of CpPOSS crystal, 15 wt% CpPOSS/PE composite, and 25 wt % CpPOSS/PE composite at 300K ... 82
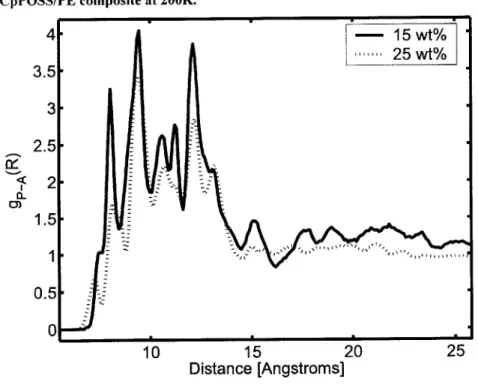
Figure 4-9. Radial distribution function, gP-A(R), of 15 wt% CpPOSS/PE composite, and 25 wt % CpPO SS/PE com posite at 200K . ... 82
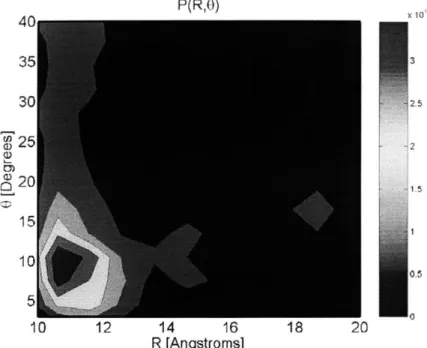
Figure 4-13: CpPOSS center and orientation probability distribution function for the 15 weight
p ercent sam p le at 300K ... 90 Figure 4-14: Specific volume versus temperature for 0, 5, 15, and 25 weight percent CpPOSS/PE
c o m p o site s... 9 2 Figure 4-15: Effective composite modulus versus volume fraction for several ratios of filler
m odulus to m atrix m odulus... 95 Figure 4-16: a) Undeformed 15 weight percent CpPOSS/PE composite. b) 15 weight percent
CpPOSS/PE composite deformed to 10 % true strain. ... 98 Figure 4-17: Axial stress versus strain for 0, 5, 15, 25 weight percent CpPOSS/PE composites.
Each curve is shifted up by 50 M Pa for clarity... 99 Figure 4-18: Stress components Gyy and cy, versus strain for 5 weight percent CpPOSS/PE
c o m p o site ... 9 9 Figure 4-19: Effective modulus versus CpPOSS content and Guth-Gold model fit... 101 Figure 4-20: Conversion from weight fraction to volume fraction assuming a) particles are small
CpPOSS crystallites, b) particles are dispersed CpPOSS with effective radius equal to their center to center distance, HS, and c) particles are dispersed CpPOSS with effective radius
encompassing the van der Waals radius of the cage, VW. ... 105
Figure 4-21: Effective modulus versus CpPOSS content assuming a) particles are small CpPOSS crystallites, b) particles are dispersed CpPOSS with effective radius equal to their center to
center distance, HS, and c) particles are dispersed CpPOSS with effective radius encompassing the van der Waals radius of the cage, VW. ... 105
Figure 4-22: Fit of Mori-Tanaka model to the simulated elastic moduli for the CpPOSS/PE
co m p o site s... 10 7 Figure 4-23: Family of Mori-Tanaka parameters, CpPOSS modulus and particle radius, which fit
the simulated elastic moduli for the CpPOSS/PE composite. The dashed lines show the upper and lower bounds on the effective particle radius based on the physical size of the
inner silicon oxygen cage. The cross is the smallest effective radius and effective modulus of a crystalline C pPO SS particle... 108 Figure 5-1: a) Van der Waals surface for the CpPOSS particle. Solvent accessible surface for
particle with radius b) 3.0 A, c) 3.0 A, d) 4.0 A, e) 5.0 A... 117 Figure 5-2: Radial distribution function between POSS centers of mass and all atoms in the
sy stem at 3 0 0K ... 12
0
Figure 5-3: Comparison of radial distribution function between CpPOSS center of mass and theFigure 5-4. Local structure calculation at 500K for 5, 15, and 25 weight percent Cyclopentyl
P O S S /P E com p o site... 123
Figure 5-5. Local structure calculation at 300K for 5, 15, and 25 weight percent Cyclopentyl P O S S/P E com p osite... 123
Figure 5-6. Local Mean Squared Displacement 500K for 5wt% CpPOSS/PE composite... 126
Figure 5-7. Local Mean Squared Displacement 300K for 5 wt% CpPOSS/PE composite... 126
Figure 5-8. Normal Local Mean Squared Displacement 500K... 128
Figure 5-9. Tangential Local Mean Squared Displacement 500K... 128
Figure 5-10: Normalized radius of gyration for polymer chains as a function of distance from the center of the C pP O SS m olecule... 130
Figure 5-11: Simulated and extrapolated weight Percent of polymer found within the interface. .... 132
List of Tables
Table 3-1. Force field parameters used to model the atoms in the system. ... 37
Table 3-2. Computed and experimentally determined Raman spectra for octasilsesquioxane. Modes involving bending of O-Si-H bond angles are shown in italics. ... 41
Table 3-3. Computed and experimentally determined Infrared Spectra for octasilsesquioxane. Modes involving bending of O-Si-H bond angles are shown in italics. ... 41
Table 3-4 - Experimental crystal structures for various POSS molecules. ... 44
Table 3-5. Computed minimum free energy cell parameters for octasilsesquioxane... 44
Table 3-6. Computed minimum free energy cell parameters for octacyclopentylsilsesquioxane... 45
Table 3-7. Computed and experimental equilibrium Si-O bond length and O-Si-O and O-Si-C bond angles for octacyclopentylsilsesquioxane ... 45
Table 3-8: Isotropic approximations for cyclopentyl POSS crystal elastic properties. ... 50
Table 3-9: Experimental elastic constants for other organic crystals... 50
Table 3-10: CpPOSS cohesive energy at various temperatures... 55
Table 3-11: Experimentally determined Hildebrand solubility parameters [29]. ... 55
Table 3-12: Energy difference between crystallized CpPOSS and CpPOSS dispersed in p o ly eth y len e ... 5 5 Table 3-13: Activation energies for ring group rotation in CpPOSS... 61
Table 4-1: Initial Structure D escription ... 69
Table 4-2: Theoretical average separation between particles at 500K for various systems assum ing perfect dispersion ... 71
Table 4-3: Theoretical average separation between particles at 300K for various systems assum ing perfect dispersion ... 71
Table 4-4: Theoretical average separation between particles at 200K for various systems assum ing perfect dispersion... 71
Table 4-5: Average minimum particle spacing at 300K and 500K computed from simulated sy ste m s... 7 2 Table 4-6. Radius of gyration for polymer chains within the CpPOSS/PE composite... 73
Table 4-7. Diffusion coefficients (x106 D [cm2 s-']) for polymer backbone atoms. ... 76
Table 4-8. Diffusion coefficients for silicon atoms at 500K... 77
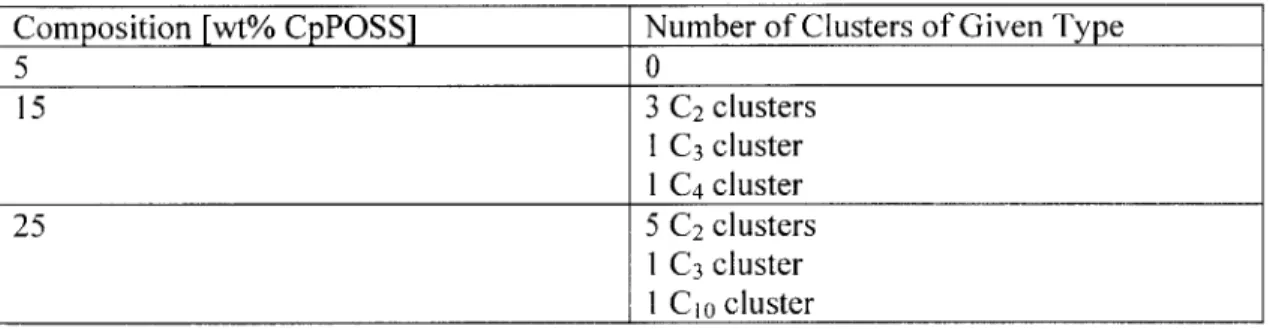
Table 4-9: Number of clusters formed, Nc,,, of size greater than or equal to n that in a system with a given the number of POSS particles and assuming all particles are randomly oriented... 85
Table 4-11: Potential of mean force model equations and parameters. ... 87 Table 4-12: Glass transition temperatures for 0, 5, 15, and 25 weight percent CpPOSS/PE
c o m p o site s... 9 2 Table 4-13 Elastic Moduli of CpPOSS/PE composite at 200K... 97 Table 4-14: Effective radius and modulus pairs which when used together in the Mori-Tanaka
formula give a good fit to the simulated elastic moduli for the CpPOSS/PE composite... 107 Table 5-1: Weight percent of polymer found within 13.2
A
at 500K and 11.7A
at 300K... 132Chapter 1
Introduction
1.1 Polymer Nanocomposites
Interest in polymer nanocomposites has been driven by the desire to create
materials with novel sets of properties. The ability to control the nanostructure of the
material to achieve a tougher and stiffer composite, or a stiffer composite without
sacrificing the processibility of the polymer, or achieving a functional composite would
greatly impact polymer science. The behavior of these nanocomposites can be the result
of phenomena on several different length scales. The polymer/filler interface, the
dispersion state of the filler, the length scale of the filler in comparison to the length scale
of the polymer can all influence the material properties. Understanding the interplay
between these variables continues to be a difficult but worthwhile task.
It is important to understand that the specific atomic interactions between polymer
and filler are critical in determining the behavior of the composite. This can be seen
clearly in work by Starr et al. [1, 2]. In their simulations of a bead-spring polymer
surrounding a single nanoparticle, they have found that for an attractive polymer/particle
interaction there was an increase in the glass transition temperature of the polymer, while
for a repulsive polymer/particle interaction there was a decrease in the glass transition
temperature. The simulations considered very low loadings (below 5 volume percent) of filler. An attractive interaction at the wall traps polymer near the surface and decreases its
mobility while the repulsive interaction actually increases the mobility of polymer chains
near the surface of the particle. This shows that the nature of the interactions across the
interface can change the effective behavior of the nanocomposite.
There is also experimental data that shows that the nanoparticle may influence the
dynamics of the polymer surrounding it. Mansencal et al. [3] have used solid-state NMR
to investigate the interface between polybutadiene, PB, and carbon black. In their studies, the polybutadiene surrounding the carbon black had strongly reduced mobility and cannot
be detected as undergoing the glass transition. They also find that the 1,2-PB moiety is
between 1,2-PB and 1,4-PB show quite clearly that chemically specific interactions
within the interface are important in determining its properties.
The interfacial surface area in the system depends strongly on the dispersion state
of the system. Experimental work studying the interface between polymer and filler[3-5]
reveals this. Berriot et al. [4, 5] used NMR to study the interface between grafted
nanosilica particles and crosslinked ethylacrylate chains. Changes in the NMR signal
during the addition of strongly interacting particles were tied to changes in the material
dynamics in polymer matrix material surrounding them. However, the influence
depended not only on the surface characteristics but also on the dispersion characteristics
of the system. Agglomerated systems and dispersed systems were created with the same
volume fraction of filler and those which were aggregated had less interface and the
effect on the surrounding polymer was less significant.
There can also be significant structural changes in the polymer near the interface.
Factor et al. [6] used grazing incidence X-ray scattering to study an aromatic polyimide, poly(pyromellitic dianhydride-oxydianiline) film deposited on a polished silicon surface.
The air/polymer surface showed significant ordering and when thermally treated at
temperatures above 3000 C, crystalline-like ordering was observed. However, the polymer/silicon surface showed no signs of ordering.
The changes in molecular structure and ordering that occur near surfaces and
interfaces can have significant effects on the bulk properties of the composite. Shearing
molecularly thin films of cyclohexane, octamethylcyclotetrasiloxane, octance,
n-tetradecane and branched isoparaffin 2-methyloctadecane liquids between two mica
surfaces, Gee et al. [7] have shown the development of molecular ordering within these
thin films. As the film thickness was decreased, the liquids became more solid like with
viscosities which were as much as 105 times that of the bulk value and relaxation times
near the surface of the spherical inclusion were found to adopt a modified configuration
and preferentially lie parallel to the surface of the particle. The polymer was found to
form densely packed and ordered shells around the particle analogous to those found near
planar solid surfaces [8].
Length scales can also play an important role in determining the behavior of the
nanocomposite. In the polymer filled nanocomposite, the relevant length scales are the
radius of gyration of the polymer chain, size of the monomer unit, and the length scale of
the particle filler. Small angle neutron scattering by Nakatani et al. [12, 13] on systems of
poly(dimethyl siloxane), PDMS, containing trimethylsilyl-treated polysilicate particles
have found that the particle presence influences the radius of gyration of the polymer.
There is a decrease in Rg when the polymer chains are smaller than the filler particles and
an increase in Rg when the polymer chains are much larger than the particles. These
results are supported by Monte Carlo simulations based on rotational isomeric state (RIS)
theory of PDMS and a rigid non-interacting filler particle by Yuan et al.[14].
Larger particles or even sheets can be formed through aggregation of
nanoparticles. Because of this, understanding the interactions between polymers and solid
surfaces can be quite relevant. A number of experiments [6, 7, 15] and simulations [14, 16-20] suggest that there are conformational changes and changes in the packing of the polymer in the interfacial region as compared to the bulk. The polymer within the
interface tends to be aligned parallel to the solid surface and forms densely packed and
ordered layers. This is similar to the effects seen near the surface of the nanoparticle
discussed earlier.
Simulations by Jang et al. [17] using lattice Monte Carlo simulations of
polyethylene near surfaces reveals changes in the structure and mobility of polymer near
the surface of the solid wall, again similar to the effects seen near the surface of
nanoparticles. When the nanoparticle diameter is on the size of the polymer radius of
gyration, the added curvature of the nanoparticle's surface does not seem to change the
fundamental phenomena observed between flat walls and polymer. The reason for this is
probably due to the fact that the changes in dynamics and mobility occur on the monomer
size is larger than the monomer size, then the effects near the particle and near the wall
should be similar.
Measurements of the solvation forces between mica surfaces and alkane chains by
Christenson et al. [15] have shown a preferential alignment of alkane chains parallel to
the surface of the mica surface. A thin layer of alkane chains was placed between two
mica surfaces and the force versus distance curve was obtained. Variation in the force
versus distance curve was found to vary up to a distance of 3
A
from the mica surface indicating that the interface did not extend past this distance. Vacatello [21] hasperformed Monte Carlo simulations on a nanoslit filled with a bead spring model which
mimics the configuration of the mica experiments. In these simulations, there is an
oscillation in the curve of force versus the distance between the two surfaces. This
variation in force is tied to ordering of the polymer into layers within the nanoslit. This
seems to agree well with the experiments of Christenson et al. [15] described above.
We see that nanoparticles embedded in polymer can have significant effects on
the structure and properties of the polymer. The changes in polymer orientation, radius of
gyration, mobility, and density near the surface of the particle will be investigated in this
thesis for the particular case of octa cyclopentyl polyhedral oligomeric silsesquioxane
polyethylene system.
1.2 Polyhedral Oligomeric Silsesquioxane
The polyhedral oligomeric silsesquioxane (POSS) macromonomer[22, 23] consists of an inorganic of silicon and oxygen core surrounded by organic groups on the
corners. The structure of a POSS macromonomer with cage structure of Si8O1 2 is shown
in Figure 1-1. The crystal structures of octa-methylsilsesquioxane [24], octasilsesquioxane [25], octacyclopentyl POSS [26], and several other POSS cages have
polystyrene[34], polyethylene[35], and polyurethane [36-38]. POSS has also been blended with amphiphilic poly(dimethylsiloxane) [39], epoxy [40], and poly(methyl
methacrylate) [41].
There are many possible applications for POSS. Tegou et al. [42] demonstrated
the ability to create POSS resists suitable for 157 nm lithography and had the potential
for sub 100 nm resolution patterns. POSS based resists offer the advantage higher glass
transition temperatures (increases of 10-40 degrees), inherent etch resistance to oxygen
plasma, and a well defined structure. Bleha et al. [43] are investigating the incorportation
of POSS into chitosan films as a means to control the mechanical properties and
permeability of the chitosan film. While success was limited in this goal, the study show
quite clearly that composite properties depend strongly on processing. With one set of
processing steps, the permeability increased, reversing the drying and crosslinking steps
led to a decrease in the permeability. Maitra et al. [44] are studying polyethylene oxide
functionalized polyhedral oligosilsesquioxanes and lithium salts. These materials may
provide solid polymer electrolytes for use as electrode separators and as binder materials
for composite cathodes in rechargeable lithium batteries.
The influence of POSS on the glass transition temperature of various polymers
depends heavily on the particular interactions between the filler and the homopolymer.
The glass transition temperature may either increase or decrease. For example, creating
the hybrid polymer with 2.4 mol % or less of the copolymer
poly(hydroxystyrene-co-vinylpyrrolidone-co-isobutylstyryl polyhedral oligosilsesquioxanes) and
poly(vinylpyrrolidone) or poly(acetoxystyrene) decreased the glass transition temperature
below that of the homopolymer by approximately 10 degrees [45]. In copolymer poly
(hydroxystyrene-co-vinylpyrrolidon-co-isobutylstyryl polyhedral oligosilsesquioxane),
the addition of an initial 0.8 mol percent POSS leads to a decrease in the glass transition
temperature but addition beyond that leads to a steadily increasing Tg. The explanation
for the specificity is due to the interactions between the POSS and polymer. If the POSS
acts to decrease the self-association between the homopolymers, then a decrease in Tg is
observed. If the POSS introduces any strong specific interactions, the Tg increases. With
increasing POSS content however, the formation of aggregates, crystallites, and occluded
Blends of poly(methyl methacrylate) and acrylic polyhedral oligomeric
silsesquioxanes showed clear plasticizing effects on the PMMA [46]. The glass transition
temperature and melt-state linear viscoelastic moduli decreased with the addition of
POSS to this system. While increases in the storage modulus at temperatures below 0' C at loadings of 20 volume percent were attributed to phase separated domains of POSS
which behave like rigid fillers below their glass transition temperature.
The increase in the glass transition temperature seen in tethered POSS systems is attributed to the fact that large masses have been attached to the polymer chain slowing
its dynamics and entangling the chains [41]. The addition of blended POSS to a system
that already has POSS tethered to the polymer chain decreases dynamics further because
associations between the blended POSS and tethered POSS cause a further slowdown in
polymer dynamics.
POSS polystyrene copolymers have shown lower viscosities [47] than the homopolymer. Blends of copolymerized POSS poly(methyl methacrylate) with PMMA
and PS homopolymers showed increased fracture toughness [48]. This thesis focuses on
blended composites of cyclopentyl substituted POSS (CpPOSS, H45C4oSisO2) within a polyethylene matrix.
In the same study [45], creating hybrid polymers with 2.4 mol % POSS and
poly(hydroxystyrene) increased the glass transition temperature by approximately 40
degrees. Haddad et al. [49] found that creating copolymers with less than 10 mol %
POSS and polystyrene decreased the glass transition temperature by approximately 10-20 degrees, but at higher loading the Tg increased. Xu et al. [50] found that creating
poly(vinylphenol-co-vinylpyrrolidone-co-isobutylstyryl polyhedral oligosilsesquioxane)
copolymers with differing POSS content showed a monotonic increase in Tg. In all cases, increasing the loading of POSS leads to an increase in the glass transition temperature.
polymer's glass transition temperature and increase the material stiffness without the
presence of aggregates.
Waddon et al. [52] have created composites of polyethylene and tethered
norbomene-cyclopentyl POSS which exhibit a two-phase crystalline structure consisting
of PE crystalline domains and POSS crystalline domains. Interestingly, upon melt
crystallization during cooling from 180 'C, the POSS particles aggregate first to form a
scaffold for subsequent PE crystallization. However, during solvent crystallization in
xylene, the PE crystallizes first to form a scaffold for subsequent POSS crystallization.
The size of POSS crystals was estimated using the Scherrer equation to have dimensions
of approximately 3 - 11 nm.
Studies on the mechanical behavior of the POSS also reveal the importance of the
choice of organic pendant groups. The tris(norbornenylethyl)-POSS copolymer with
isobutyl pendant groups shows a decrease in elastic moduli, toughness and yield strength
with increasing POSS content[55] irrespective of crosslinking density. This is attributed
to a decrease in the cohesive energy with increasing POSS content. Huang et al. have
found that by adding octa(aminophenyl)silsesquioxane to polyimide, they were able to
increase the glass transition of the composite as well as increase stiffness and toughness
of the composite[56]. Once again, this suggests that the choice of pendant groups has a
significant effect on the mechanical properties also.
Fu et al. [57] have studied the addition of grafted cyclopentyl POSS to polystyrene-polybutadiene-polystyrene (SBS). Interestingly, they grafted the POSS to the
polymer chain after polymerization of the chain had already taken place instead of the
more common one-pot copolymerization techniques. In this way, they were able to create
well dispersed POSS composites with differing POSS content, but identical polymer
chain structure. Their dynamic mechanical analysis (DMA) results clearly indicate an
increase in the Tg of the polybutadiene block as the POSS filler content is increased from
0 to 20 wt %. The yield stress for the polymer decreases with increasing POSS content, but the composite is significantly tougher. X-ray scattering indicated the presence of
some crystalline POSS domains within the composite.
Lamm et al. [58] have simulated the assembly of POSS-like nanostructures. Using
capture the increase in POSS particle spacing with increasing tether length. However,
these coarse-grained models cannot capture the interesting features seen in the POSS
systems because they lack the detailed interactions between filler and polymer which are
the very interactions that give POSS such interesting behavior.
All of these studies suggest that as the length scale of the filler decreases, the interfacial interactions between filler and matrix become increasingly important in
determining the global properties of the composite. This thesis will explore in more detail
the interface, energetic interactions, and modifications in mechanical and thermal properties that occur with the addition of cyclopentyl POSS in a polyethylene matrix.
Figure 1-1: a) Schematic of the silicate cage. (R8Si8O12). b) Schematic of the Cyclopentyl (C5H9) R-groups used in this study.
a) R R R Si S
Si
Si
S
R
~O
R
R
b) CH2 - O H2 CH2 CH2 CH1.
Starr, F.W., T.B. Schroder, and S.C. Glotzer, Molecular dynamics
simulation of a polymer melt with a nanoscopic particle. Macromolecules,
2002. 35(11): p. 4481-4492.
2.
Starr, F.W., T.B. Schroder, and S.C. Glotzer, Effects of a nanoscopic filler
on the structure and dynamics of a simulated polymer melt and the
relationship to ultrathin films. Physical Review E, 2001. 6402(2).
3.
Mansencal, R., B. Haidar, A. Vidal, L. Delmotte, and J.M. Chezeau,
High-resolution solid-state NMR investigation of the filler-rubber interaction: 2.
High-speed H-I magic-angle spinning NMR spectroscopy in
carbon-black-filled polybutadiene. Polymer International, 2001. 50(4): p. 387-394.
4.
Berriot, J., F. Martin, H. Montes, L. Monnerie, and P. Sotta, Reinforcement
of model filled elastomers: characterization of the crosslinking density at
the filler-elastomer interface by H-1 NMR measurements. Polymer, 2003.
44(5): p. 1437-1447.
5.
Berriot, J., H. Montes, F. Martin, M. Mauger, W. Pyckhout-Hintzen, G.
Meier, and H. Frielinghaus, Reinforcement of model filled elastomers:
synthesis and characterization of the dispersion state by SANS
measurements. Polymer, 2003. 44(17): p. 4909-4919.
6.
Factor, B.J., T.P. Russell, and M.F. Toney, Grazing-Incidence
X-Ray-Scattering Studies of Thin-Films of an Aromatic Polyimide.
Macromolecules, 1993. 26(11): p. 2847-2859.
7.
Gee, M.L., P.M. McGuiggan, J.N.
Israelachvili,
and A.M. Homola, Liquid to
Solid-Like Transitions of Molecularly Thin-Films under Shear. Journal of
Chemical Physics, 1990. 93(3): p. 1895-1906.
8.
Vacatello, M., Monte Carlo simulations of polymer melts filled with solid
nanoparticles. Macromolecules, 2001. 34(6): p. 1946-1952.
9.
Vacatello, M., Chain dimensions in filled polymers: An intriguing problem.
Macromolecules, 2002. 35(21): p. 8191-8193.
10.
Vacatello, M., Phantom chain simulations of polymer-nanofiller systems.
Macromolecules, 2003. 36(9): p. 3411-3416.
11.
Bharadwaj, R.K., R.J. Berry, and B.L. Farmer, Molecular dynamics
simulation study of norbornene-POSS polymers. Polymer, 2000. 41(19): p.
7209-7221.
12.
Nakatani, A.I., W. Chen, R.G. Schmidt, G.V. Gordon, and C.C. Han, Chain
dimensions in polysilicate-filled poly(dimethyl siloxane). International
Journal of Thermophysics, 2002. 23(1): p. 199-209.
13.
Nakatani, A.I., W. Chen, R.G. Schmidt, G.V. Gordon, and C.C. Han, Chain
dimensions in polysilicate-filled poly(dimethyl siloxane). Polymer, 2001.
42(8): p. 3713-3722.
Measurements and Mean-Field Theory. Journal of Chemical Physics,
1987. 87(3): p. 1834-1841.
16.
Doruker, P. and W.L. Mattice, Simulation of polyethylene thin films on a
high coordination lattice. Macromolecules, 1998. 31(4): p. 1418-1426.
17.
Jang, J.H. and W.L. Mattice, The effect of solid wall interaction on an
amorphous polyethylene thin film, using a Monte Carlo simulation on a
high coordination lattice. Polymer, 1999. 40(16): p. 4685-4694.
18.
Jang, J.H. and W.L. Mattice, A Monte Carlo simulation for the effect of
compression on an amorphous polyethylene melt in very thin confined
geometry. Macromolecules, 2000. 33(4): p. 1467-1472.
19.
Theodorou, D.N., Microscopic Structure and Thermodynamic Properties of
Bulk Copolymers and Surface-Active Polymers at Interfaces .2. Results for
Some Representative Chain Architectures. Macromolecules, 1988. 21(5):
p. 1422-1436.
20.
Theodorou, D.N., Microscopic Structure and Thermodynamic Properties of
Bulk Copolymers and Surface-Active Polymers at Interfaces .1. Theory.
Macromolecules, 1988. 21(5): p. 1411-1421.
21.
Vacatello, M., Monte Carlo simulations of polymers in nanoslits.
Macromolecular Theory and Simulations, 2004. 13(1): p. 30-35.
22.
Lichtenhan, J.D., J.J. Schwab, and W.A. Reinerth, Nanostructured
chemicals: A new era in chemical technology. Chemical Innovation, 2001.
31(1): p. 3-5.
23.
Lichtenhan, J.D., Polyhedral Oligomeric Silsesquioxanes - Building-Blocks
for Silsesquioxane-Based Polymers and Hybrid Materials. Comments on
Inorganic Chemistry, 1995. 17(2): p. 115-130.
24.
Larsson, K., The crystal structure of Octa-(methylsilsesquioxane). Arkiv
For Kemi, 1960. 16: p. 203.
25.
Larsson, K., The crystal structure of Octa-(silsesquioxane)(HSiO 1. 5)8.
Arkiv For Kemi, 1960. 16: p. 215.
26.
Bassindale, A.R., Z.H. Liu,
I.A.
MacKinnon, P.G. Taylor, Y.X. Yang, M.E.
Light, P.N. Horton, and M.B. Hursthouse, A higher yielding route for T-8
silsesquioxane cages and X-ray crystal structures of some novel
spherosilicates. Dalton Transactions, 2003(14): p. 2945-2949.
27.
Barry, A.J., W.H. Daudt, J.J. Domicone, and J.W. Gilkey, Crystalline
Organosilsesquioxanes. Journal of the American Chemical Society, 1954.
77: p. 4248.
28.
Larsson, K., A crystal structure investigation of substituted
Octa-(silsesquioxanes) and (ArSiO 1.5)8. Arkiv For Kemi, 1960. 16: p. 209.
29.
Lichtenhan, J.D., N.Q. Vu, J.A. Carter,
J.W.
Gilman, and F.J. Feher,
Silsesquioxane Siloxane Copolymers from Polyhedral Silsesquioxanes.
Macromolecules, 1993. 26(8): p. 2141-2142.
30.
Shockey, E.G., A.G. Bolf, P.F. Jones, J.J. Schwab, K.P. Chaffee, T.S.
Haddad, and J.D. Lichtenhan, Functionalized polyhedral
oligosilsesquioxane (POSS) macromers: New graftable POSS hydride,
POSS-siloxane triblocks. Applied Organometallic Chemistry, 1999. 13(4):
p. 311-327.
31.
Gilman, J.W., D.S. Schlitzer, and J.D. Lichtenhan, Low earth orbit
resistant siloxane copolymers. Journal of Applied Polymer Science, 1996.
60(4): p. 591-596.
32.
Lichtenhan, J.D., Y.A. Otonari, and M.J. Carr, Linear Hybrid Polymer
Building-Blocks - Methacrylate-Functionalized Polyhedral Oligomeric
Silsesquioxane Monomers and Polymers. Macromolecules, 1995. 28(24):
p. 8435-8437.
33.
Mather, P.T., H.G. Jeon, A. Romo-Uribe, T.S. Haddad, and J.D.
Lichtenhan, Mechanical relaxation and microstructure of
poly(norbornyl-POSS) copolymers. Macromolecules, 1999. 32(4): p. 1194-1203.
34.
Zheng, L., R.M. Kasi, R.J. Farris, and E.B. Coughlin, Synthesis and
thermal properties of hybrid copolymers of syndiotactic polystyrene and
polyhedral oligomeric silsesquioxane. Journal of Polymer Science Part
a-Polymer Chemistry, 2002. 40(7): p. 885-891.
35.
Zheng, L., A.J. Waddon, R.J. Farris, and E.B. Coughlin, X-ray
characterizations of polyethylene polyhedral oligomeric silsesquioxane
copolymers. Macromolecules, 2002. 35(6): p. 2375-2379.
36.
Hsiao, B.S., H. White, M. Rafailovich, P.T. Mather, H.G. Jeon, S. Phillips,
J. Lichtenhan, and J. Schwab, Nanoscale reinforcement of polyhedral
oligomeric silsesquioxane (POSS) in polyurethane elastomer. Polymer
International, 2000. 49(5): p. 437-440.
37.
Fu,
B.X., B.S. Hsiao, S. Pagola, P. Stephens, H. White, M. Rafailovich, J.
Sokolov, P.T. Mather, H.G. Jeon, S. Phillips, J. Lichtenhan, and J.
Schwab, Structural development during deformation of polyurethane
containing polyhedral oligomeric silsesquioxanes (POSS) molecules.
Polymer, 2001. 42(2): p. 599-611.
38.
Fu, B.X., W.H. Zhang, B.S. Hsiao, M. Rafailovich, J. Sokolov, G.
Johansson, B.B. Sauer, S. Phillips, and R. Balnski, Synthesis and
characterization of segmented polyurethanes containing polyhedral
oligomeric silsesquioxanes nanostructured molecules. High Performance
Polymers, 2000. 12(4): p. 565-571.
39.
Hottle, J.R., H.J. Kim, J.J. Deng, C.E. Farmer-Creely, B.A. Viers, and A.R.
Esker, Blends of amphiphilic PDMS and trisilanolisobutyl-POSS at the
air/water interface. Macromolecules, 2004. 37(13): p. 4900-4908.
40.
Li, G.Z., L.C. Wang, H. Toghiani, T.L. Daulton, K. Koyama, and C.U.
Pittman, Viscoelastic and mechanical properties of epoxy/multifunctional
polyhedral oligomeric silsesquioxane nanocomposites and
42.
Tegou, E., V. Bellas, E. Gogolides, and P. Argitis, Polyhedral oligomeric
silsesquioxane (POSS) acrylate copolymers for microfabrication:
properties and formulation of resist materials. Microelectronic Engineering,
2004. 73-74: p. 238-243.
43.
Bleha, M., G. Tishchenko, Z. Pientka, and J. Brus, Effect of POSS (TM)
functionality on morphology of thin hybrid chitosan films. Designed
Monomers and Polymers, 2004. 7(1-2): p. 25-43.
44.
Maitra, P. and S.L. Wunder, POSS based electrolytes for rechargeable
lithium batteries. Electrochemical and Solid State Letters, 2004. 7(4): p.
A88-A92.
45.
Xu, H.Y., S.W. Kuo, J.S. Lee, and
F.C.
Chang, Glass transition
temperatures of poly(hydroxystyrene-co- vinylpyrrolidone-co-isobutylstyry1
polyhedral oligosilsesquioxanes). Polymer, 2002. 43(19): p. 5117-5124.
46.
Kopesky, E.T., T.S. Haddad, G.H. McKinley, and R.E. Cohen, Miscibility
and Properties of Acrylic Polyhedral Oligomeric
Silsesquioxane-Poly(methyl methacrylate) Blends. 2005.
47.
Romo-Uribe, A., P.T. Mather, T.S. Haddad, and J.D. Lichtenhan,
Viscoelastic and morphological behavior of hybrid styryl-based polyhedral
oligomeric silsesquioxane (POSS) copolymers. Journal of Polymer
Science Part B-Polymer Physics, 1998. 36(11): p. 1857-1872.
48.
Zhang, W., B.X.
Fu,
Y. Seo, E. Schrag, B.S. Hsiao, P.T. Mather, N.L.
Yang, D. Xu, H. Ade, M. Rafailovich, and J. Sokolov, Effect of Methyl
Methacrylate/Polyhedral Oligomeric Silsesquioxane Random Copolymers
in Compatibilization of Polystyrene and Poly(methyl methacrylate) Blends.
Macromolecules, 2002. 35: p. 8029-8038.
49.
Haddad, T.S. and J.D. Lichtenhan, Hybrid organic-inorganic
thermoplastics: Styryl-based polyhedral oligomeric silsesquioxane
polymers. Macromolecules, 1996. 29(22): p. 7302-7304.
50.
Xu, H.Y., S.W. Kuo, and F.C. Chang, Significant glass transition
temperature increase based on polyhedral oligomeric silsequioxane
(POSS) copolymer through hydrogen bonding. Polymer Bulletin, 2002.
48(6): p. 469-474.
51.
Lee, Y.J., S.W. Kuo, W.J. Huang, H.Y. Lee, and F.C. Chang, Miscibility,
specific interactions, and self-assembly behavior of phenolic/polyhedral
oligomeric silsesquioxane hybrids. Journal of Polymer Science Part
B-Polymer Physics, 2004. 42(6): p. 1127-1136.
52.
Waddon, A.J., L. Zheng, R.J.
Farris,
and E.B. Coughlin, Nanostructured
polyethylene-POSS copolymers: Control of crystallization and
aggregation. Nano Letters, 2002. 2(10): p. 1149-1155.
53.
Waddon, A.J. and E.B. Coughlin, Crystal structure of polyhedral
oligomeric silsequioxane (POSS) nano-materials: A study by x-ray
diffraction and electron microscopy. Chemistry of Materials, 2003. 15(24):
p. 4555-4561.
54.
Farmer,
B.L., R.J. Berry, and R.K. Bharadwaj, Molecular dynamics
simulations of POSS-containing polymers. Abstracts of Papers of the
American Chemical Society, 2001. 222: p. U186-U186.
55.
Constable, G.S., A.J. Lesser, and E.B. Coughlin, Morphological and
mechanical evaluation of hybrid organic-inorganic thermoset copolymers
of dicyclopentadiene and mono- or tris(norbornenyl) -substituted polyhedral
oligomeric
silsesquioxanes. Macromolecules, 2004. 37(4): p. 1276-1282.
56.
Huang, J.C., C.B. He, Y. Xiao, K.Y. Mya, J. Dai, and Y.P. Siow,
Polyimide/POSS nanocomposites: interfacial interaction, thermal
properties and mechanical properties. Polymer, 2003. 44(16): p.
4491-4499.
57.
Fu, B.X., A. Lee, and T.S. Haddad, Styrene-butadiene-styrene triblock
copolymers modified with polyhedral oligomeric silsesquioxanes.
Macromolecules, 2004. 37(14): p. 5211-5218.
58.
Lamm, M.H., T. Chen, and S.C. Glotzer, Simulated assembly of
nanostructured organic/inorganic networks. Nano Letters, 2003. 3(8): p.
Chapter 2
Mhodology
2.1
&hte
Carlo
The Monte Carlo method is a stochastic method which generates configurations of a
given system within a particular ensemble. Producing a path through configuration space, it
provides no information on the trajectories or velocities of particles. The original formulation is
attributed to Metropolis et al. [1].
In atomistic simulations, one is interested in calculating the properties of a given potential
function within a certain ensemble. It can be shown that for a NVT ensemble, the probability, pi, of finding the system in a particular configuration, i, is given by:
p = exp - (2.1)
k BT
where FN is the set of positions of the particles in the system, U is the potential energy function,
and k is Boltzmann's constant.
The average of a property can then be expressed as an integral over degrees of freedom
weighted by the probability of finding that state.
f dr-N
exp U(F) (N(A)=-
B (2.2)J
dNexp kBwhere A is the property. For static properties, this average is equivalent to the time average over
a single trajectory.
Determining a given property of a system becomes a matter of integrating this function.
Only in very rare cases can this integral be evaluated analytically. Resorting to numerical
methods, one could randomly sample configurations, calculate the weight and average over the
weighted samples. This is inefficient since most of the configurations sampled would be high
energy states with low weights. A more efficient way to calculate this ensemble average would
be to generate configurations according to the weight exp{-/JU(i-)}. Using this scheme, one
samples more frequently those states that contribute most to the average. The property can then
be expressed as a simple average of the computed property over the generated states,
i N, N
(A)= - A (rN (2.3)
Nc i=1
where A is the property of interest, and Nc is the number of generated configurations. To sample
configurations according to this given weight, Metropolis developed the following algorithm:
1. given an initial configuration FN
2. calculate the energy of this state U, = U(rN
probability exp(-8(U -U)
6. calculate property A 7. go to 2.In addition to the simple single atom displacement move, concerted rotation moves, reptation moves, and molecule displacement/rotation moves were all employed to equilibrate systems. The reptation move [2] is used to disconnect one monomer from the chain end and reattach it to the other end of the chain. This produces a slithering motion of the polymer through the melt. However, the reptation move can be inefficient at changing the internal degrees of freedom for the polymer if long chains are used. The concerted rotation move [3] is used to equilibrate internal segments of polymer chains. The algorithm works by selecting a 10 segment portion of the backbone and displacing 4 of the segments. Molecular translation and rotation were used to take entire molecules and simultaneously translate or rotate all atoms associated with this molecule.
2.2 Molecular Dynamics
Molecular Dynamics is a technique for following the progression of a system of atoms or molecules through phase space. From a given set of initial conditions and interatomic potentials, one can generate the trajectories for particles. Properties can be calculated by averaging over the trajectory:
A,=
dtA(t)
(2.4)
where A is the property of interest and T is the time. The key assumption in molecular dynamics is that the movement of atoms can be treated using classical mechanics. If this equation of
motion holds, then the same equations of motion that govern macroscopic objects may be used to model the trajectories of atoms or molecules.
In fact, the motion of all but the lightest of atoms can be treated accurately by classical mechanics even though the interactions between atoms, which is a product of the motion of electrons, must be calculated using quantum mechanics. Luckily, the mass of a nuclei is on the order of ten thousand times that of an electron. The position of the electron is highly non-localized due to its high velocities and low mass and has a short relaxation time. In contrast, the heavier nucleus has a highly localized position and requires much more time to reach its equilibrium state than the electrons encircling it. The two motions can therefore be decoupled and treated independently. This is known as the Born-Oppenheimer Principle. Quantum mechanical calculations can be used to determine the energy of a given configuration of atoms with equilibrated electrons [4]. By varying distances between atoms, a map of the potential energy as a function of configuration can be developed and the motion of large systems of atoms can be calculated without explicitly taking into account the electrons.
By treating the atoms as localized point masses and assuming their interactions are captured in a potential function, one can use Newton's equations of motion to solve for the trajectories of these particles. Recalling that the force on a particle can be written as the negative gradient of the potential, one can then write the equations of motion in the following form:
where mi and i. are the mass and position of atom I respectively, N is the number of atoms in the
simulation, FN = 2-''',N}, and U(FN) is the potential which can be expressed as a function
of all other atomic positions. This gives a set of N 2"d order non-linear ordinary differential
equations which can only be solved numerically. The corresponding Hamiltonian for this system
is given by:
N -2
H
i2mi±U(FN)(2.6)
where P, is the particle momentum.
The Hamiltonian in this case is equivalent to the total energy of the system. Therefore,
solving these equations produces a trajectory within an ensemble with a constant number of
particles, volume, and energy. This ensemble is termed the microcanonical ensemble (NVE).
If one would like to simulate other ensembles, changes must be made to the equations of motion. To conduct simulations in an ensemble with a constant number of particles, volume, and
temperature (NVT) [5-7]. In this formulation, a heat bath is coupled to the equations of motion allowing the transfer of energy to and from the system.
The Verlet algorithm is used to integrate equations of motion for a NVT system. The
equations of motion can be similarly modified to sample an ensemble with a constant number of
particles, pressure, and temperature (NPT) [8]. The Berendsen algorithm is used [7]. In this
formulation, the coupling between motion of the simulation cell is assumed to be weakly coupled
to the motion of the particles. This allows the two motions to be integrated separately. The
volume and positions of each particle are scaled at each time step in response to stress changes.
A (t) = I - _, (6:(t) - a- )
3r s (t + At)= As W)(2.7)
(t
+ At) = AF (t) V(t + At)=(det A)V (t)where A (t) is the scaling matrix, Tp is the time constant, &" is the desired stress tensor, a(t) is
the current stress tensor, At is the time step, T is the set of vectors defining the shape of the
simulation cell, r is the vector position of particle i, and V is the volume of the simulation cell.
This algorithm provides an over-damped response to pressure changes, thereby removing many
of the oscillations that would be found using the more rigorous ensemble techniques.
The stress tensor is calculated using the atomic virial [9]. Since periodic boundary
conditions are employed, the expression for the virial stress tensor is:
" = - - r" -() " +)," (2.8)
where V is the volume of the cell, pi" is the a component of the momentum of the it" particle, mi
is the mass of particle i, r" is the a component of the position of the it" particle, r" is the a
component of the position of the image of the jth particle which is closest to the it" particle, Fij is the force on i due to jmin, and Ttail is the correction to the pressure due to the cutoff radius. The
tensor and the acceleration can be time consuming. Often interactions beyond a given distance are discarded. When a truncation is used in calculating the contribution of a set of interactions to the pressure, the following correction must be added to the calculated stress:
"
S=
27r 2g
rlr
dUNB 3(2.9)
I-c"i .a3 P dr
where 5c, is the Kroniker delta which is zero if a # 8 and is equal to one if a = ,8, p is the number density, g(r) is the radial distribution function, UNB is the long range potential, and rc is the cutoff radius.
Assuming that the van der Waals interactions are truncated at rc and are described by a 12-6 Lennard-Jones potential and that the radial distribution function can be sufficiently approximated as 1 in the region beyond rc, the equation for the tail correction becomes
1 6 7r 2
2 o
2 o
-45""f . p Ca- .
(2.10)
3 3 r, 1r,
This correction was employed throughout this study. In order to facilitate the computation of the van der Waals interactions, a list of the potential interacting pairs was maintained. Termed a neighbor list, this technique was first used by Verlet [10]. For each atom a list of particles within a distance d = r + r was maintained. When any particle has moved a
Sr
distance greater than
-,
the list is updated. Due to the constrained motion of particles in the 2solid phase, this list is valid for a number of time steps.
The link-cell method [11] was used to aid in the creation of neighbor lists. The simulation cell is divided into rectangular compartments whose dimensions are slightly larger then the cutoff distance. Then for a given mer only 27 adjacent compartments must be searched to find neighbors. Since searching for these neighbors requires N2 work, the link-cell method greatly
reduces the computational time required to form the neighbor list.
Due to computational constraints, the particle number in atomistic simulations is severely limited. Surface effects may negatively affect even the largest of simulations. In order to reduce the surface effects, periodic boundary conditions were employed. Atoms or bonds which leave one face of the simulation cell enter the opposite side.
I. Metropolis, N., A. Rosenbluth, M. Rosenbluth, A. Tellar, and M. Tellar, Equation
of state calculations by fast computing machines. Journal of Chemical Physics,
1953. 21: p. 1087.
2. Wall, F.T. and F. Mandell, Macromolecular dimensions obtained by an efficient
Monte Carlo method without sample attrition. Journal of Chemical Physics, 1975.
63: p. 4592.
3. Dodd, L.R., T.D. Boone, and D.N. Theodorou, A Concerted Rotation Algorithm
for Atomistic Monte-Carlo Simulation of Polymer Melts and Glasses. Molecular
Physics, 1993. 78(4): p. 961-996.
4. Born, M. and R. Oppenheimer, Zur Quantentheorie der Molekeln. Ann. Phys.,
1927. 84(457-484).
5. Nose, S., A unified formulation of constant temperature molecular dynamics methods. Journal of Chemical Physics, 1984. 81(1): p. 511.
6. Hoover, W., Canonical dynamics: Equilibrium phase-space distributions.
Physical Review A, 1984. 31: p. 1695.
7. Berendsen, H.J., J.P.M. Postma, W.F.v. Gunsteren, A.D. Nola, and J.R. Haak,
Molecular Dynamics with Coupling to an External Bath. Journal of Chemical
Physics, 1984. 81: p. 3684-3690.
8. Parrinello, M. and A. Rahman, Polymorphic transitions in single-crystals - a new molecular-dynamics method. Journal of Applied Physics, 1981. 52(12): p. 7182.
9. Theodorou, D.N., T.D. Boone, L.R. Dodd, and K.F. Mansfield, Stress Tensor in
Model Polymer Systems with Periodic Boundaries. Makromolekulare
Chemie-Theory and Simulations, 1993. 2(2): p. 191-238.
10. Verlet, L., Computer "Experiments" on Classical Fluids. I. Thermodynamical
Properties ofLennard-Jones Molecules. Physical Review, 1967. 159(1): p.
98-103.
11. Hocknet, R.W., S.P. Goel, and J.W. Eastwood, Quite high-resolution computer
Chapter 3
Modeling Cyclopentyl POSS
The success or failure of a molecular simulation rests heavily on the description
of molecular interactions which are adopted for the particular system being studied.
Entire fields for the development of proper interatomic interactions have been developed
[1-12]. In most cases, potentials are derived that adequately describe the behavior of a
certain set of molecules or monomers, but may do a poor job at describing others even
when these molecules consist of the same elements. This occurs because the empirical
potential is an approximation to the complex energy surface of the molecule. Changes in
bonding, and or changes in the detailed electronic structure of the material may lead to
errors when using the potential on different molecules. Although there has been no
development of a potential to specifically describe polyhedral oligomeric silsesquioxane, there have been potentials developed for polysilanes [13], polysiloxanes [14], and alkanes
[15]. However, their efficacy in describing the molecular properties of polyhedral
oligomeric silsesquioxane has not been shown. In the first part of this chapter, we
describe the validation of an atomic potential for the simulation of POSS structures by
demonstrating that the potential reproduces the vibrational spectra for hydrogenated
POSS, and reproduces the crystal structures of cyclopentyl and hydrogenated POSS. This potential is then used to describe the energetic and mechanical properties of
the crystal. As will be described in Chapter 4, the anisotropic properties of the crystal are
particularly important in understanding the properties of POSS/polymer nanocomposites
due to the presence of small crystalline POSS domains within a variety of polymer
matrices. The cohesive energy and the energy required to disperse POSS within the

![[PDF] Visual Basic.Net : Classes Et Objets](data:image/gif;base64,R0lGODlhAQABAIAAAP///wAAACH5BAEAAAAALAAAAAABAAEAAAICRAEAOw==)