https://doi.org/10.4224/23001032
READ THESE TERMS AND CONDITIONS CAREFULLY BEFORE USING THIS WEBSITE. https://nrc-publications.canada.ca/eng/copyright
Vous avez des questions? Nous pouvons vous aider. Pour communiquer directement avec un auteur, consultez la première page de la revue dans laquelle son article a été publié afin de trouver ses coordonnées. Si vous n’arrivez pas à les repérer, communiquez avec nous à PublicationsArchive-ArchivesPublications@nrc-cnrc.gc.ca.
Questions? Contact the NRC Publications Archive team at
PublicationsArchive-ArchivesPublications@nrc-cnrc.gc.ca. If you wish to email the authors directly, please see the first page of the publication for their contact information.
NRC Publications Archive
Archives des publications du CNRC
For the publisher’s version, please access the DOI link below./ Pour consulter la version de l’éditeur, utilisez le lien DOI ci-dessous.
Access and use of this website and the material on it are subject to the Terms and Conditions set forth at
Using four-quadrant charts for two technology forecasting indicators:
technology readiness levels and R&D momentum
Tang, D. L.; Wiseman, Erica; Archambeault, J.
https://publications-cnrc.canada.ca/fra/droits
L’accès à ce site Web et l’utilisation de son contenu sont assujettis aux conditions présentées dans le site LISEZ CES CONDITIONS ATTENTIVEMENT AVANT D’UTILISER CE SITE WEB.
NRC Publications Record / Notice d'Archives des publications de CNRC: https://nrc-publications.canada.ca/eng/view/object/?id=cab5309b-ff48-4c0f-8b13-09c3ab51395b https://publications-cnrc.canada.ca/fra/voir/objet/?id=cab5309b-ff48-4c0f-8b13-09c3ab51395b
Using Four-Quadrant Charts for Two Technology Forecasting Indicators:
Technology Readiness Levels and R&D Momentum
Tang, D. L., Wiseman, E., & Archambeault, J.
Canadian Institute for Scientific and Technical Information, National Research Council
Introduction
Using the corpus of scientific and technical (S&T) publications as evidence, technology forecasting (TF) methodologies and indicators can be applied to reduce risks in the planning and development of research investment strategies. They complement methodologies based on expert opinions. The identification of emerging and potentially disruptive technologies is a core TF activity, yet a major challenge exists in the development of systematic and structured methods and processes.
We report on a method that operationalizes the S-curve for the purpose of measuring technology readiness levels (TRL). This method consists of four steps including arithmetic standardization, linear regression, z-score normalization, and visualization using a four-quadrant bubble chart. In addition to the TRL indicator, we demonstrate with the example of another indicator namely R&D momentum that this method can be adapted to create new indicators.
We explain the conceptual assumptions underlying the two indicators, and use examples to demonstrate how they have been applied to technology forecasting. This paper concludes with suggestions of how research can further develop the method and validate the indicators.
Background
We reviewed the literature on S&T forecasting and identified two gaps related to TRL and emerging technologies, as follows.
Gap 1: While discussion has been made about conceptual models such as the S-curve (e.g., Andersen, 1999; Haupt, Kloyer, & Lange, 2007) development of methods to apply it in practice is lacking. In particular, no methods have been reported on operationalizing the S-curve for measuring TRL.
Gap 2: Evidence-based methods that can overcome the constraint of low publication volumes are needed to reliably monitor early signs of emerging technologies, i.e., rising topics that are still at the bottom of the S-curve and small in the number of publications, as opposed to mature and dominant topics.
The Method
To address the above gaps, a four-step method was developed at the Canadian Institute for Scientific and Technical Information, National Research Council Canada. This method is typically applied to a time series table of the number of publications with regard to a set of subjects, as illustrated in Table 1 below.
Table 1
An Example of a Time Series Table of Publications per Research Subject
Year 1 Year 2 Year 3 ... Year n Subject A 2 3 12 ... 115 Subject B 60 61 129 ... 542 ... ... ... ... ... ... Subject m ... ... ... ... ...
Arithmetic standardization
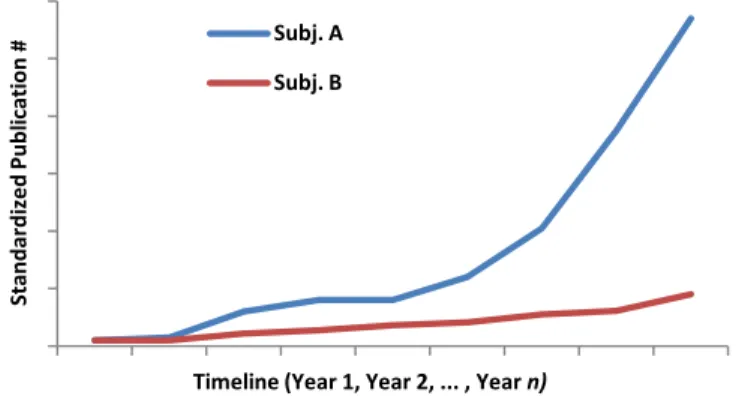
Step 1 standardizes the data series (i.e., subjects in the above table) to the same starting point, before their trend lines can be drawn on the same chart. This step enables correct representation of different subjects in the same coordinate regardless of the absolute volume of publications made on each subject. Representing Table 1 data, Figure 1 shows that, although smaller, Subject A has a standardized trend line that indicates higher growth than Subject B. This was not obvious in the original data table.
Figure 1. An Example of a Line Chart of Standardized Data Series
Linear regression
Step 2 quantifies the trend line with the slope of linear regression of the data series. The slope of linear regression on the time series has been shown to be able to effectively predict upward trends when a number of subjects are monitored (Tseng, Lin, Lee, Hung, & Lee, 2009).
Z-score normalization
Step 3 transforms slope values obtained from linear regression into z-scores in order to compare the growth trend of subjects. The transformed scores have a mean of 0 and a standard deviation of 1. Each z-score indicates the number of standard deviations a slope value is above or below the mean. Therefore, meaningful comparisons can be made between slope values in terms of the distance and the direction each value is located around their mean.
S tandardi ze d P ubl icat ion #
Timeline (Year 1, Year 2, ... , Year n) Subj. A
Visualization with four-quadrant bubble chart
To visually represent the set of z-scores, the last step relies on the feature of a four-quadrant bubble chart. As Figure 2 illustrates, the X axis, Y axis and bubble diameter of a bubble chart can each represent a quantitative property (parameter) of a data series, e.g., the normalized slope of a subject representing its growth trend.
Figure 2. An Illustrative Four-Quadrant Bubble Chart
Indicator of Technology Readiness Levels (TRL)
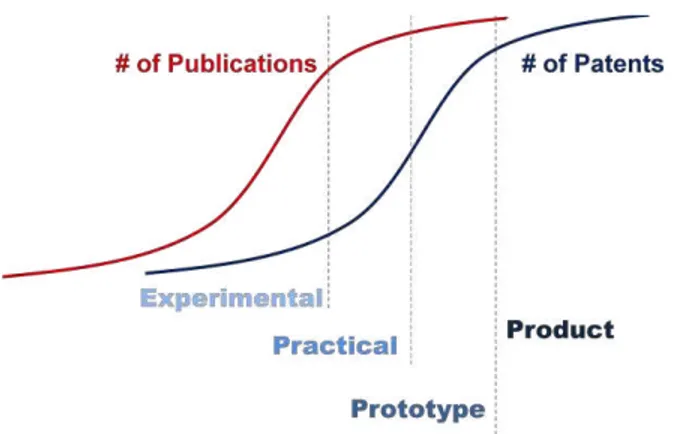
TRL indicates the maturity level of a given technology. There are two assumptions underlying this indicator: first, technologies follow the S-curve in becoming mature; and second, for the same technology, the S-curve of patents delays in catching up that of research publications. Figure 3 shows how four levels of TRL can be modeled theoretically by segregating the lag between two S-curves, one representing the trend of research publications and the other the trend of patents.
Figure 3. A Model of Four TRL Using the S-curves of Research Publications and Patents
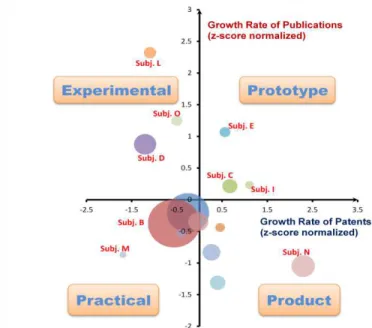
Following the proposed method, we can now plot technologies in a two dimensional coordinate, with the X axis corresponding to the trend of research publications and the Y axis the trend of patents, in order to measure their TRL and identify technologies that are close to application. Figure 4 provides an example of a completed project, in which the bubble size corresponds to the number of publications. In this example,
Subject L is being actively researched, but only a few patents have been claimed. According to the assumptions described earlier, it is considered to be at a much lower maturity level than Subject I, on which research activity has become less active while a high number of patent applications have been filed. This indicator addresses gap 1 by gauging TRL with the stage of research activity on a subject versus application as a developed (patented) technology.
Figure 4. An Example of TRL Visualized in a Four-Quadrant Bubble Chart
R&D Momentum, an Indicator of Emerging Technologies
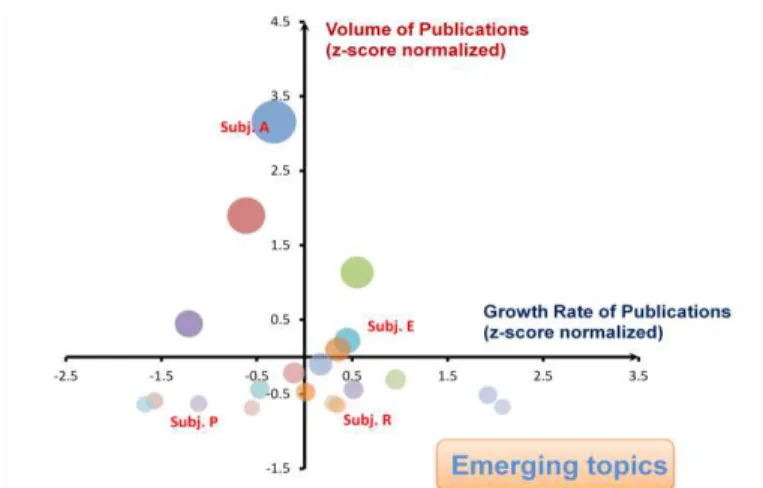
One of the challenges of identifying emerging technologies using publication as data lies with the volume of publications as a confounding factor, for the rapid growth and evolution of emerging topics tends to be dwarfed by the high volume of established ones. Specifically, the notion of “emerging” consists not only in a sharply rising trend line but also in a small footage in the body of relevant literature. In naming this indicator “R&D Momentum”, we drew an analogy with physics where the momentum of an object can be decomposed into its velocity (corresponds to the slope of a subject’s trend line) and its mass (corresponds to the cumulated total number of publications). To address gap 2, an effective indicator should show the publication trend of a subject as well as its cumulated publication volume, relative to other related subjects. The two parameters can, again, be represented with the two dimensions of a bubble chart. Figure 5 presents an example using the R&D momentum indicator. The same four-step method was employed to produce it. In this example, subjects (e.g., E & R) right to the vertical axis experienced higher growth than subjects in the left, but only those below the horizontal axis (e.g., Subject R) may be considered as potentially emerging technologies because they have not been well established in terms of total publications to date (represented also by the size of the bubble).
Figure 5. An Example of R&D Momentum Visualized in a Four-Quadrant Bubble Chart
Discussion and Conclusion
This paper presents one method and two indicators. The method is based on generic techniques (statistical normalization and visualization with four-quadrant bubble charts), and understanding these underlying techniques would enable adaptation of the method for creating new indicators. In the case of our first indicator of TRL, this method is applied to two types of data, research publications and patent applications; whereas the second indicator relies on just one type of data but separates growth trend and cumulated total of publications to be plotted on a bubble chart. In brief, our method produces a visualization of two parameters that have been statistically normalized for presentation on a two dimensional coordinate, and both indicators effectively offset the obfuscating effect of established technologies resulting from higher publication volumes than emerging, low volume technologies.
Conceptual modeling is important for devising indicators for technology forecasting. This critical step can be clearly seen in the combination of two S-curves for the four TRL levels and in the separated considerations of trend and publication number for defining R&D momentum. In addition, interpretation of visually categorized data (in four quadrants) is critical to the successful implementation of such indicators.
Building upon this paper, future research can be conducted in two directions. First, additional statistical techniques may be introduced to modify this method. For example, a goodness-of-fit statistic can be used to compare the shape of the S-curve (a parameter for the X axis) of technologies that turned out to be disruptive with those that did not and to explore any correlated variables (for the Y axis, bubble diameter) and explanations. Second, the validity of the two indicators needs to be tested with historical data and through application in technology forecasting projects.
References
Andersen, B. (1999). The hunt for S-shaped growth paths in technological innovation: A patent study. Journal of Evolutionary Economics, 9(4), 487-526.
Haupt, R., Kloyer, M., & Lange, M. (2007). Patent indicators for the technology life cycle development. Research Policy, 36(3), 387-398.
Tseng, Y. H., Lin, Y., Lee, Y. Y., Hung, W. C., & Lee, C. H. (2009). A comparison of methods for detecting hot topics. Scientometrics, 81(1), 73-90.