Publisher’s version / Version de l'éditeur:
L'Industria Italiana del Cemento, 849, pp. 70-79, 2009-01-01
READ THESE TERMS AND CONDITIONS CAREFULLY BEFORE USING THIS WEBSITE.
https://nrc-publications.canada.ca/eng/copyright
Vous avez des questions? Nous pouvons vous aider. Pour communiquer directement avec un auteur, consultez la première page de la revue dans laquelle son article a été publié afin de trouver ses coordonnées. Si vous n’arrivez pas à les repérer, communiquez avec nous à PublicationsArchive-ArchivesPublications@nrc-cnrc.gc.ca.
Questions? Contact the NRC Publications Archive team at
PublicationsArchive-ArchivesPublications@nrc-cnrc.gc.ca. If you wish to email the authors directly, please see the first page of the publication for their contact information.
NRC Publications Archive
Archives des publications du CNRC
This publication could be one of several versions: author’s original, accepted manuscript or the publisher’s version. / La version de cette publication peut être l’une des suivantes : la version prépublication de l’auteur, la version acceptée du manuscrit ou la version de l’éditeur.
Access and use of this website and the material on it are subject to the Terms and Conditions set forth at Thermodynamic Analysis of the Decomposition of Ca(OH)2
Nanoparticulates
Tumidajski, P. J.; Sato, T.; Beaudoin, J. J.; Ramachandran, V. S.; Mitchell, L. D.
https://publications-cnrc.canada.ca/fra/droits
L’accès à ce site Web et l’utilisation de son contenu sont assujettis aux conditions présentées dans le site LISEZ CES CONDITIONS ATTENTIVEMENT AVANT D’UTILISER CE SITE WEB.
NRC Publications Record / Notice d'Archives des publications de CNRC: https://nrc-publications.canada.ca/eng/view/object/?id=d4caaba4-2617-45c7-bae3-a8d2891f7609 https://publications-cnrc.canada.ca/fra/voir/objet/?id=d4caaba4-2617-45c7-bae3-a8d2891f7609
http://www.nrc-cnrc.gc.ca/irc
T he r m odyna m ic Ana lysis of t he
De c om posit ion of Ca (OH )
2
N a nopa r t ic ulat e s
N R C C - 4 5 6 2 3
T u m i d a j s k i , P . J . ; S a t o , T . ; B e a u d o i n , J . J . ;
R a m a c h a n d r a n , V . S . ; M i t c h e l l , L . D .
J a n u a r y 2 0 0 9
A version of this document is published in / Une version de ce document se trouve dans:
L'Industria Italiana del Cemento, 849, pp. 70-79, January 01, 2009
The material in this document is covered by the provisions of the Copyright Act, by Canadian laws, policies, regulations and international agreements. Such provisions serve to identify the information source and, in specific instances, to prohibit reproduction of materials without written permission. For more information visit http://laws.justice.gc.ca/en/showtdm/cs/C-42
Les renseignements dans ce document sont protégés par la Loi sur le droit d'auteur, par les lois, les politiques et les règlements du Canada et des accords internationaux. Ces dispositions permettent d'identifier la source de l'information et, dans certains cas, d'interdire la copie de documents sans permission écrite. Pour obtenir de plus amples renseignements : http://lois.justice.gc.ca/fr/showtdm/cs/C-42
Thermodynamic Analysis of the Decomposition of Ca(OH)2 Nanoparticulates
P. J. Tumidajskia, T. Satob, J. J. Beaudoinb,* V.S.Ramachandranb and L. D. Mitchellb
a St. Clair College of Applied Arts and Technology, Windsor, Canada, N9H 1A1. bInstitute for Research in Construction, National Research Council, Ottawa, Canada, K1A0R6.
ABSTRACT
Nanosized Ca(OH)2 particles having different physical characteristics e.g. surface area,
degree of crystallinity, have been prepared. Endothermal doublets present in the
thermoanalytical spectral information reflect differences in the degree of crystallinity of the various Ca(OH)2 preparations. A thermodynamic analysis of their thermal behavior is
presented. The thermodynamic analyses validate the experimental observations based on the estimates of the decomposition temperatures of the Ca(OH)2 nanoparticles.
*
Corresponding author. Tel. 1-613-993-6749; fax: 1-613-954-5984. E-mail address: jim.beaudoin@nrc.ca
Introduction
Calcium hydroxide (CH) is an important component of hydrated Portland cement. It occupies up to 26% by volume of the hydrated cement paste [1]. It also has a role in numerous reactions germane to cement science, including those relevant to durability problems and sustainability issues [2]. The degree of crystallinity, surface area,heat capacity anddecomposition temperature of CH can be influenced by differences in the preparationconditions. For example,binary mixtures of CH prepared by hydration of CaO in vapor and liquid phases show two distinct endotherms in the differential
thermogravimetry traces (DTG) attributed to differences in crystallinity (a lower degree of crystallinity corresponding to a lower decomposition temperature) [3]. The doublet behavior has beenobserved previously in DTA curves for Portland cement binders [4,5]. It is consistent with differences in the Gibbs free energy changes associated with the hydration of CaO in the vapor or liquid phaseto form CH. Therefore, it is possible touse the temperature dependence of theheat capacity (Cp) data (for the differentCH
preparations) to estimate their thermal decomposition temperatures. Estimates of the decomposition temperatures of the CH were obtained by thermodynamic analysis. Experimental
Calcium Hydroxide Preparations:
The preparation of the CH samples is described as follows:
CH-1: Reagent grade Ca(OH)2 was calcined at 600ºC for 1 hour and hydrated at 11% RH
for 7 days. The BET nitrogen surface area of the resulting CH was 20.1 m2/g.
CH-1(a): Reagent grade Ca(OH)2 was calcined at 600οC for 1 hour and hydrated at 75%
RH for 3 hours to determine the effect of vapor hydration at a relatively high humidity. The BET surface area was 21.5 m2/g.
CH-2: Reagent grade Ca(OH)2 was calcined at 600ºC for 1 hour and hydrated in
deaerated liquid water for 7 days. The BET nitrogen surface area of the resulting CH was 31.1 m2/g.
CH-3: Reagent grade CaCO3 was calcined at 1050ºC for 1 hour and hydrated in deaerated
liquid water for 7 days. The BET nitrogen surface area of the resulting CH was 7.3 m2/g. X-ray diffraction (XRD) measurements were taken using a Scintag XDS 2000
instrument. CuKα radiation (45 kV, 35mA) was used. The scan rate was 0.025 ο/s. The spectra were obtained in the interval 5ο< 2θ< 85ο.
The DSC measurements were obtained using a simultaneous DSC-TG instrument - a TA instruments SDT-Q600 Thermal Analyzer. A heating rate of 10ºC/min. (room
temperature to 1050ºC) in a nitrogen gas environment (100 mL/min.) was employed.TG measurements were also obtained with the same instrument. The results were plotted in derivative form (DTG). The DTG results were used to estimate the decomposition temperatures of the Ca(OH)2 preparations [3]. An environmentally conditioned DSC-TG
cell was also used for some of the experiments to study the effect of humidity on thermal decomposition.
The nitrogen surface area measurements (BET method) were obtained with a
Quantachrome Quantasorb Sorption System. Samples were dried using a heating mantle at 140οC for 10 minutes prior to the measurement.
Results and Discussion
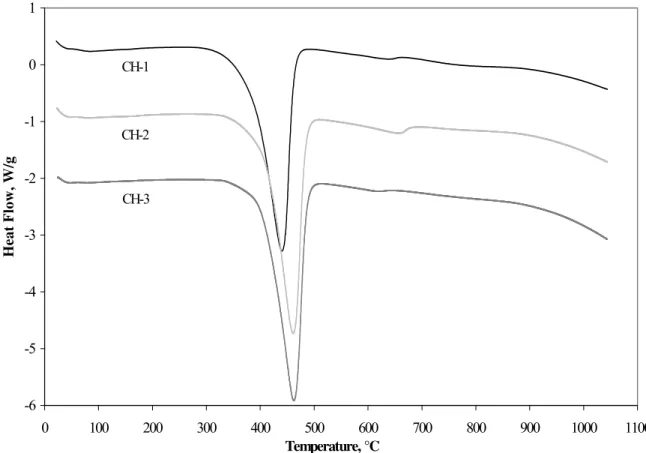
The heat flow versus temperature results were used for heat capacity (Cp) calculations,
(Figure 1).
Thermodynamic Analysis:
The basic reaction for Ca(OH)2 decomposition can be written as:
Ca(OH)2(s)→ CaO(s) + H2O(g) [1]
The change in the Gibbs free energy of the Ca(OH)2(s) decomposition reaction,
can be expressed as:
o RT ΔG , o RT o RT o RT ΔH –T S ΔG = Δ [2]
where is the change in enthalpy at temperature T and is the corresponding change in entropy. Generally,
o RT ΔH o RT ΔS
∫
∂ = 1 T T p T C ΔH [3] and∫
∂ = 1 T T p/T T C ΔS [4]where Cp, the heat capacity, is a function of temperature. The heat capacity functions for
the CH preparations were determined from analysis of the experimentally obtained Cp
versus temperature data. They were approximately linear in the temperature range of 350-500ºK (Figure 2). The Cp functions can be substituted into equations [3] and [4] and ∆H
and ∆S determined. The change in Gibbs free energy,
o RT
ΔG , is then calculated from equation [2]. Details of the calculations leading to
estimates of the decomposition temperature for each of the CH preparations are described in the following section.
Estimates of Gibbs Free Energy (∆G) and Decomposition Temperatures (Td)
The decomposition of Ca(OH)2(s) yields CaO(s) and water vapour H2O(g). The exact
decomposition temperature, Td, can be calculated using Kirchoff’s relationship which
allows the calculation of enthalpy and entropy changes at any temperature provided the enthalpy and entropy are known at another temperature and the heat capacities of the reactants and products are available in the range of temperatures under consideration.
For the case of Ca(OH)2(s) decomposition, Kirchoff’s relationship can be represented as, d (g) 2 (s) H -2(s) CaO H O T T Ca(OH) o T R, = + ⇒ Δ ) g ( 2O H , p C K) 373 (T H C CP,Ca(OH)2(s) p,CaO(s) Δ l→g = ° ) l ( 2O H , p C K 298 T O H CaO Ca(OH) (s) 2 (l) ΔH 2(s) o K 298 R, ° = + ⇒°
The standard enthalpy of reaction at 298°K is calculated from tabulated values for the enthalpy of formation of the reactants and products [6],
ΔH – ΔH ΔH ΔH o Ca(OH) f, o O H f, o CaO f, o R,298K = (s) + 2 (l) 2(s) = –151,600 – 68,315 – (–235,500) = 15,585 calories mol–1 [5] The heat required to bring CaO(s) from 298°K to any higher temperature is given by,
(
)
∫
∂ =∫
+ × ∂ = T 298 T 298 3 – CaO p, 1 C T 9.903 3.133 10 T T ΔH (s) = –3090 + 9.903T + 1.567×10⁻³T2 calories mol–1 [6] The heat required to bring H2O(l) from 298°K to any higher temperature involves a phasetransition from the liquid to gaseous state at 373°K. Accordingly, the total heat will be,
∫
∫
∂ + + ∂ = → T 373 O H p, 373 298 g l O H p, 2 C T ΔH C T ΔH 2 (l) 2 (g)(
)
∫
∂ + +∫
+ × ∂ =373 298 373 3 – T T 10 2.56 7.17 9820 T 18.03= 8320 + 7.17T + 1.28× –3 2 –1 [7] mol calories T 10
Now, consider the heat capacity of Ca(OH)2(s) as a generalized linear function of
temperature given by,
–1 –1 Ca(OH) p, a bT calories mol K C 2(s) = + [8]
Then, the enthalpy released as Ca(OH)2 is brought from any T to 298°K is,
∫
∂ = 298 T Ca(OH) p, 3 C T ΔH 2(s)(
)
∫
⎟ ⎠ ⎞ ⎜ ⎝ ⎛ + = ∂ + =298 T 1 – 2 mol calories T 2 b – aT – 44,402b 298a T bT a [9]Using the Kirchoff’s relationship,
0 ΔH ΔH – ΔH ΔH ΔH 3 o T R, 2 1 o R,298K + + + = [10]
Substituting Eq.[5], [6], [7] and [9] into Eq.[10]and re-arranging and simplifying gives,
(
20,815 298a 44,402b) (
17.07–a)
T ΔHo T R, = + + + 1 – 2 3 – mol calories T 2 b – 10 2.847 ⎟ ⎠ ⎞ ⎜ ⎝ ⎛ × + [11]Entropies are calculated similarly. Therefore, the standard entropy of reaction is,
o Ca(OH) f, o O H f, o CaO f, o K 298 R, S (s) S 2 (l) – S 2(s) S = + Δ ° –1 –1 K mol calories 6.29 19.93 – 16.718 9.5+ = = [12]
The entropy change for CaO(s) as the temperature is increased from 298°K to T is,
∫
∫
⎟⎟∂ ⎠ ⎞ ⎜⎜ ⎝ ⎛ + × = ∂ = T 298 T 298 –3 CaO p, 1 T T T 10 3.133 9.903 T T C ΔS (s) = –57.35 + 3.133×10⁻³T+9.903ln(T)calories mol–1K–1 [13]Similar to Eq.[7] for enthalpy, the entropy change for H2O(l) involves a phase transition at 373°K.
∫
∫
∂ + + ∂ = → T 373 O H p, 373 298 g l O H p, 2 T T C 373 ΔH T T C ΔS 2 (l) 2 (g)∫
∫
⎟⎟∂ ⎠ ⎞ ⎜⎜ ⎝ ⎛ + × + + ∂ =373 298 373 –3 T T T 10 2.56 7.17 T 9820 T T 18.03 = –13.03 + 2.56× –3 –1 –1 [14] K mol calories 7.17ln(T) T 10 +For Ca(OH)2(s), the entropy change from T to 298°K is,
T T bT a T T C ΔS 298 T 298 T Ca(OH) p, 3 2(s)
∫
∫
⎟∂ ⎠ ⎞ ⎜ ⎝ ⎛ + = ∂ = –1 –1 K mol calories bT – aln(T) – 298b 5.70a + = [15]Now, the total entropy change over the thermodynamic cycle must be zero. Therefore, 0 ΔS ΔS – ΔS ΔS ΔS 3 o T R, 2 1 o R,298K + + + = [16]
Substituting the appropriate values gives, 298b) 5.70a (–64.09 ΔSo T R, = + + –1 –1 –3 – b)T (17.07–a)ln(T) calories mol K 10 (5.693× + + [17]
The Gibb’s free energy of the Ca(OH)2(s) decomposition reaction is calculated with the
Gibbs-Duhem equation and Eq.[11] and [17]. The result is,
o T R, o T R, o T R, ΔH T S ΔG = − Δ
(
20,815+298a+44,402b) (
+ 81.16–6.70a–298b)
T =(
)
-1 2 3 – mol calories Tln(T) 17.07 – a T 10 2.846 – 2 b + ⎟ ⎠ ⎞ ⎜ ⎝ ⎛ × + [18]The generalized form of Eq.[18], which accounts for deviations from standard conditions is, ⎟ ⎟ ⎠ ⎞ ⎜ ⎜ ⎝ ⎛ ⋅ + = (s) 2 (g) 2 (s) Ca(OH) O H CaO o T R, T R, a P a ln RT ΔG ΔG [19]
where and are the activities of CaO and Ca(OH)2, respectively, and
is the normalized partial pressure of water vapour. R is the universal gas constant given as 1.987 calories mol-1 K-1. With the appropriate substitutions, the generalized Gibbs free energy of reaction is,
(s) CaO a ) s ( 2 ) OH ( Ca a (g) 2O H P
(
20,815 298a 44,402b) (
81.16–6.70a–298b)
T ΔGR,T = + + +(
a–17.07)
Tln(T) T 10 2.846 – 2 b –3⎟ 2 + ⎠ ⎞ ⎜ ⎝ ⎛ × +(
)
–1 O H calories mol P ln T 1.987 (g) 2 + [20]The temperature at which is zero corresponds to the decomposition temperature of Ca(OH)2, Td. It can be seen from Eq.[20] that Td depends on the relative humidity
condition and on the temperature dependence of the heat capacity for the Ca(OH)2
samples prepared under different conditions. The heat capacities of Ca(OH)2(s) were
calculated using the heat flow data obtained with differential scanning calorimetry (Figure 1).The temperatures associated with the on-set of decomposition and the peak temperature are in the following order: CH-1< CH-2 < CH-3. The heat capacities were calculated using the equation,
T , R G Δ
(
-1) (
-1 -1) (
-1 o 1) (
o -1 p Wg Js g Jg K Ks t T C m Q ⋅ = = = ⎟ ⎠ ⎞ ⎜ ⎝ ⎛ ∂ ∂ ⋅ = ⎟ ⎠ ⎞ ⎜ ⎝ ⎛ −)
[21] where,Q is the applied power (Watts or Joules per second), m is the sample mass (grams),
Cp is the heat capacity (Joules per gram per degree Kelvin),
⎟ ⎠ ⎞ ⎜ ⎝ ⎛ ∂ ∂ t T
is the heating rate (degrees Kelvin per second).
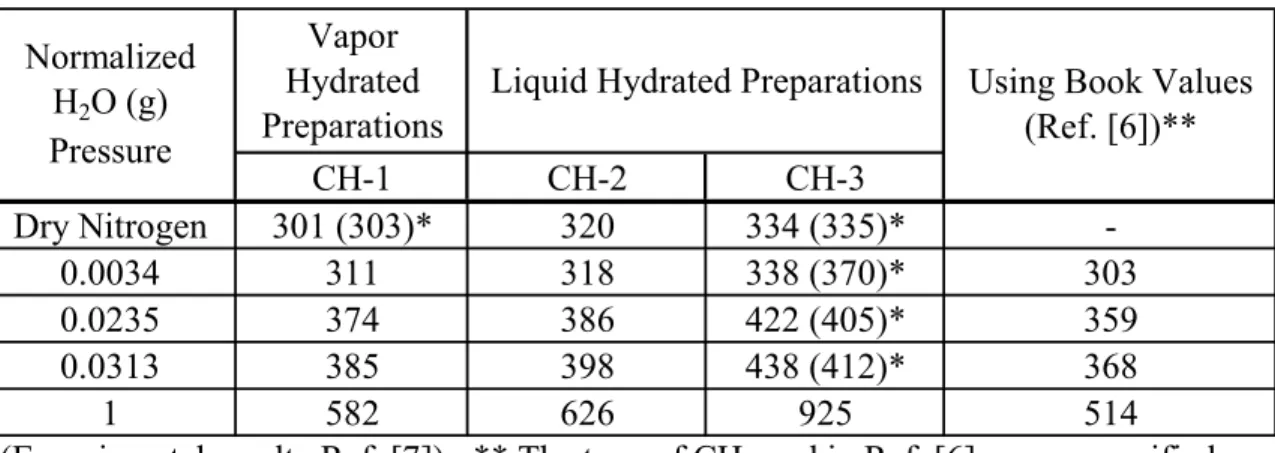
The results are summarized in Table 1 and in Figure 2. The normalized water vapour partial pressures are given in Table 2 for 11%, 75% and 100% relative humidities and for the standard state (i.e. 101.3 kPa). Therefore, substitution of the appropriate values from Tables 1 and 2 into Eq.[20] and solving for temperature when ΔGR,T is zero yields Td for
different preparation techniques and humidity conditions. Summary values for Td are
provided in Table 3. Also included in Table 3 are values for Td estimated from the DTG
Table 1. Heat Capacities of Ca(OH)2(s) Nanoparticles
Prepared Under Different Conditions
Table 2. Experimental Humidity Conditions
Condition Normalized Pressure (Pi / 101.6 kPa)
11% Relative Humidity 0.0034
75% Relative Humidity 0.0235
100% Relative Humidity 0.0313
Table 3. Calculated Decomposition Temperatures, Td (°C) for Ca(OH)2**
*(Experimental results-Ref. [7]) ; ** The type of CH used in Ref. [6] was unspecified.
CH-1 CH-2 CH-3 Dry Nitrogen 301 (303)* 320 334 (335)* -0.0034 311 318 338 (370)* 303 0.0235 374 386 422 (405)* 359 0.0313 385 398 438 (412)* 368 1 582 626 925 514 Normalized H2O (g) Pressure
Using Book Values (Ref. [6])** Liquid Hydrated Preparations
Vapor Hydrated Preparations
The Td values from Table 3 have been plotted against the normalized water vapour
pressure in Figure 3. A comparison of the effect of the initial calcination temperature (for producing the CaO starting material) on the liquid phase hydration of the CaO can be made by examining Figure 3 and Table 3. A higher calcination temperature corresponds to a higher decomposition temperature indicating that the Ca(OH)2 prepared from CaO
formed at the higher calcination temperature is thermodynamically more stable. Further, the Ca(OH)2 prepared by liquid phase hydration decomposes at higher temperatures than
the Ca(OH)2 prepared by vapor phase hydration suggesting that the liquid hydrated
samples are more thermodynamically stable than the vapor hydrated samples. The
decomposition temperature of CH for all the preparations increases as the humidity in the decomposition environment increases. This was observed experimentally (as indicated by the decomposition temperature values in brackets in Table 3) by the decomposition of the CH preparations on heating in an environmentally controlled DSC cell in dry nitrogen and at different humidities [7]. The bracketed values in Table 3 represent the values at the on-set of weight-loss as indicated by the DTG-temperature curves previously reported
[3,7].The on-set values indicate the beginning of the decomposition process.
Decomposition of Ca(OH)2 takes place over a finite temperature range. Differences in
the reported experimentally determined values (compared to calculated values) are possibly due to variables such as heating rate and the fact that as the temperature in the DSC cell increases the saturation vapor pressure increases as well. Nevertheless the differences are not large and the trends for the experimentally determined results and the calculated values are consistent.
Comments on the degree of crystallinity of the Ca(OH)2 preparations are germane to this
discussion.The degree of crystallinity of the CH preparations was estimated by
calculation of a ‘crystallinity index’ from XRD spectra [3].The inverse of the peak- width at half peak-height (e.g. at 2θ = 34.09ο) was taken as an indicator of the crystallinity. Values of the ‘crystallinity index’ were estimated to be 1.72,3.03 and 5.26 for the CH-1, CH-2 and CH-3 samples respectively. Williamson-Hall plots were also constructed from the X-ray data [3,8]. It was shown that line-broadening can be attributed to simultaneous strain and small particle size broadening. The magnitude of the degree of disorder was in the following order, CH-1>CH-2>CH-3 indicating that the lower decomposition
temperature would be expected for the CH-1 preparation. Limitations of the XRD method include instrumental error and the effects of crystallite size and strain. Nevertheless the relative agreement of the ‘crystallinity index’ and the Williamson-Hall analysis provides support for the relative ranking of the CH preparations in terms of degree of
crystallinity.Additional detail of the application of these two methods for estimating the degree of crystallinity is provided in reference [3]. SEM micrographs of similar CH
peparations are also presented in reference [3]. They confirm the relative size of the CH crystals but are not accurate descriptors of the degree of crystallinity.
Conclusions
1. The thermodynamic analysis corroborates the validity of the previously observed doublets in the thermal analytical spectral information (DTG, DSC) for Ca(OH)2.
2. Thermodynamic calculations of decomposition temperature of Ca(OH)2 support
previous arguments that Ca(OH)2 with varying degrees of crystallinity can be
produced.
3. The decomposition temperature of Ca(OH)2 prepared by vapor or liquid hydration of
CaO can be estimated from basic heat capacity data and thermodynamiccalculations. 4. Higher decomposition temperatures have been previously observed with Ca(OH)2
nanoparticles prepared from CaO produced at higher temperatures in agreement with thermodynamically-based calculations indicating thatthese preparations are more thermodynamically stable.
5. The decomposition temperature of Ca(OH)2 produced by vapor phase hydration of
CaO is directly related to the relative humidity of the hydration environment. 6. The decomposition temperature of the various Ca(OH)2 preparations studied
increases as the relative humidity of the environment under which decomposition occurs increases and depends on the crystallinity of the CH.This is not unexpected. For example in a CO2 atmosphere CaCO3 decomposes at higher temperatures as the
partial pressure of CO2 In the environment increases.
References
[1] H.F.W. Taylor, Cement Chemistry, 2nd edition, Thomas Telford, London, 1997.
[2] F. P. Glasser, The role of Ca(OH)2 in Portland cement concretes, in J. Skalny, J.
Gebauer, J. Odler (Eds.), Materials Science of Concrete, Special Volume: Calcium Hydroxide in Concrete, Vol. 6., Amer. Ceram. Soc., 2001, pp.37-58. [3] T. Sato, J. J. Beaudoin, V.S. Ramachandran, L. Mitchell and P.J. Tumidajski,
Thermal decomposition of nanoparticulate Ca(OH)2-Anomalous effects,
Advances in Cement Research,19 (1), 1-7,2007.
[4] K.T.Greene, Early hydration reactions of Portland cement, in Proc. 4th Int. Symp. Chem. Cem., Vol. 1, Session IV, Paper IV-1, Washington D.C.,1960, pp.359-374.
[5] J. Herrick, K. Scrivener and P. Pratt, The development of microstructure in calcium sulphoaluminate expansive cement, in Proc. Matls. Res. Soc. Vol. 245, 1992, pp.277-282.
[6] O. Kubaschewski and C. B. Alcock, Metallurgical Thermochemistry, 5th edition, Pergamon Press, Toronto,1979.
[7] J.J.Beaudoin, V.S.Ramachandran, T. Sato, L.Mitchell and P.J.Tumidajski, Investigation of endothermal doublets occurring in the thermal decomposition of Ca(OH)2, L’Industria del Cemento, (823), 772-779, 2006.
[8] G.K.Williamson and W. H. Hall, X-ray line broadening from filed aluminium and wolfram, Acta Metallurgica, 1(1), 22-31,1953.
-6 -5 -4 -3 -2 -1 0 1 0 100 200 300 400 500 600 700 800 900 1000 1100 Temperature, °C Heat Flow, W/g CH-1 CH-2 CH-3
Figure 1 Differential Scanning Calorimetry Curves For Preparations of Various CH Nanoparticles
1.20 1.40 1.60 1.80 2.00 2.20 2.40 325.0 350.0 375.0 400.0 425.0 450.0 475.0 500.0 525.0 T (°K) Heat Capacity, Cp (J/g/°K) CH-1 Ref [6] CH-2 CH-3 y = 0.0027T + 0.6204 R² = 0.9708 y = 0.0022T + 1.1654 R² = 0.9747 y = 0.0031T + 0.3136 R² = 0.9855 y = 0.0009T + 0.9811 R² = 0.9875
Figure 2 Region of Linear Temperature Dependence For Heat Capacity Values of Various Preparations of CH Nanoparticles
200 300 400 500 600 700 800 900 1000 -6 -5 -4 -3 -2 -1 0 Ln (PH2O) Decomposition Temperature (°C) CH-1 Ref [6] CH-2 CH-3 11% RH 75% RH 100% RH PH2O = 1 atm
Figure 3 Summary Plot of Decomposition Temperatures for Ca(OH)2 Nanoparticles