Publisher’s version / Version de l'éditeur:
Handbook of Research on Computational and Systems Biology: Interdisciplinary Applications, pp. 148-186, 2010-06-30
READ THESE TERMS AND CONDITIONS CAREFULLY BEFORE USING THIS WEBSITE. https://nrc-publications.canada.ca/eng/copyright
Vous avez des questions? Nous pouvons vous aider. Pour communiquer directement avec un auteur, consultez la première page de la revue dans laquelle son article a été publié afin de trouver ses coordonnées. Si vous n’arrivez pas à les repérer, communiquez avec nous à [email protected].
Questions? Contact the NRC Publications Archive team at
[email protected]. If you wish to email the authors directly, please see the first page of the publication for their contact information.
NRC Publications Archive
Archives des publications du CNRC
Access and use of this website and the material on it are subject to the Terms and Conditions set forth at
Biclustering of DNA Microarray Data: Theory, Evaluation, and
Applications
Tchagang, Alain B.; Pan, Youlian; Famili, Fazel; Tewfik, Ahmed H.; Benos,
Panayiotis V.
https://publications-cnrc.canada.ca/fra/droits
L’accès à ce site Web et l’utilisation de son contenu sont assujettis aux conditions présentées dans le site LISEZ CES CONDITIONS ATTENTIVEMENT AVANT D’UTILISER CE SITE WEB.
NRC Publications Record / Notice d'Archives des publications de CNRC: https://nrc-publications.canada.ca/eng/view/object/?id=a668df47-a589-40a9-a578-1a92b4cacee2 https://publications-cnrc.canada.ca/fra/voir/objet/?id=a668df47-a589-40a9-a578-1a92b4cacee2
Knowledge Discovery Group, Institute for Information Technology, National Research Council,
Ottawa, Ontario, Canada
Department of Electrical and Computer Engineering, University of Minnesota, Minneapolis,
Minnesota, USA
Department of Computational and Systems Biology, School of Medicine, University of
Pittsburgh, Pittsburgh, Pennsylvania, USA
In this chapter, different methods and applications of biclustering algorithms to DNA microarray data analysis that have been developed in recent years are discussed and compared. Identification of biological significant clusters of genes from microarray experimental data is a very daunting task that emerged, especially with the development of high throughput technologies. Various computational and evaluation methods based on diverse principles were introduced to identify new similarities among genes.
Mathematical aspects of the models are highlighted, and applications to solve biological problems are discussed.
Recent developments in genomics and highthrouput technology have shown that biclustering is an emerging and powerful methodology for gene expression data analysis. This is driven by the fact that biclustering performs simultaneous row$column clustering and is able to identify local behaviors of the dataset. When dealing with DNA microarray data, biclustering is capable to find subgroups of genes that are intimately related across subgroups of attributes, e.g. experimental conditions, time points, or tissue samples. In other words, by simultaneously clustering the rows and columns of the gene expression matrix, one can identify candidate subsets of attributes that are associated with specific biological functions, in which only a subset of genes potentially plays a role. Biological analysis and
experimentation could then confirm the significance of the candidate subsets.
Since the introduction of biclustering algorithms in DNA microarray data analysis in 2000 by Cheng and Church, biclustering has received a great deal of attention. Thousands of research papers have been published, presenting new algorithms or improvements to solve this biological data mining problem more efficiently. In this chapter, we explain the biclustering problem, some of its variations, and the main techniques to solve them. Obviously, given the huge amount of work on this topic, it is impossible to explain or even mention all proposed algorithms. Instead, in this chapter, we attempt to give a
comprehensive survey of the most influential algorithms and results. It begins with a description of the biological problem motivating the underlying methodology. At each step, an attempt is made to describe both the relevant biological and relevant statistical assumptions so that it is accessible to biologists,
microarray data as well as users experienced with this technique. Furthermore, we give more insights regarding the methodologies available for statistical and biological evaluations of the biclusters, and demonstrate the applicability of biclustering algorithms to solve specific problems in computational biology and gene expression data analysis in particular.
This chapter is divided into five sections with several examples at the end. The section on biclustering of DNA microarray data introduces the application of biclustering to microarray data, illustrating the practical aspects of these techniques. The section on bicluster models interpretations and validations discusses the available procedures to measure the validity of the resulting biclusters. The section on algorithms for biclusters identification presents the implementation of popular algorithms. The section on biological applications shows several examples of biclustering applied to microarray data to answer specific biological questions. Lastly, in the final section, we conclude and provide some insights on future research directions.
Quantitative gene expression measurements using microarrays were first performed by Schena et al. (1995) on 45 Arabidopsis thaliana genes and shortly after, on thousands of genes or even a whole genome (DeRisi et al., 1996; DeRisi et al., 1997). Since that time, various methods for the analysis of such data have been developed. This includes the biclustering techniques.
Microarrays are solid substrates hosting hundreds of single stranded DNAs with a specific sequence, which are found on localized features arranged in grids. These molecules, called probes, hybridize with single stranded cDNA molecules, named targets, which have been labeled during a reverse transcription procedure. The targets reflect the amount of mRNA isolated from a sample obtained under a particular condition. Thus, the amount of fluorescence emitted by each spot is proportional to the amount of mRNA transcribed from corresponding DNA sequence. The microarray is scanned and the resulting image is analyzed using signal and image processing techniques so that the signal from each probe can be quantified into numerical values. Such values represent the expression level of the gene in the given condition (Simon et al., 2003).
Microarrays can be fabricated by depositing cDNAs or previously synthesized oligonucleotides; this approach is usually referred to as printed microarrays. In contrast, in situ manufacturing encompasses technologies that synthesize the probes directly on the solid support. Slightly different oligonucleotides array platforms are manufactured by companies such as Affymetrix, Agilent, and NimbleGen. Each technology has its advantages and disadvantages and serves a particular research goal. A good review on DNA microarray technology can be found in (Irizarry et al., 2005).
Microarray data acquired during time$course experiments allow the temporal variations in gene expression to be monitored. Therefore, this kind of data has been widely used to study the dynamic behavior of the cells in a variety of biological processes, including cell proliferation (Spellman et al., 1998), development (Arbeitman et al., 2002), and response to extracellular stimuli (Gash et al., 2000; Guillemin et al., 2002). On the other hand, steady state microarray data are acquired under different experimental conditions when the cell reaches the steady state, such as homeostasis (Gardner & Faith, 2005). When dealing with DNA microarray experiments, a significant question is whether to use a time$ series design or a steady$state design. The steady$state design may miss dynamic events that are critical for correctly inferring the control mechanism of a transcription relational network, but enables one to observe more diverse experimental conditions. On the other hand, time$series experiments can capture dynamics, but many of the data points may contain redundant information leading to inefficient use of experimental resources.
A gene expression matrix can be defined using either an N × M matrix: Equation 1A, or a set Equation 1B.
=
=
)
,
(
)
,
(
)
2
,
(
)
1
,
(
)
,
(
)
,
(
)
2
,
(
)
1
,
(
)
,
2
(
)
,
2
(
)
2
,
2
(
)
1
,
2
(
)
,
1
(
)
,
1
(
)
2
,
1
(
)
1
,
1
(
)
(
)
(
)
2
(
)
1
(
M
N
a
m
N
a
N
a
N
a
M
n
a
m
n
a
n
a
n
a
M
a
m
a
a
a
M
a
m
a
a
a
N
g
n
g
g
g
A
(1A) R = {G, C} (1B)where G = {g(1), g(2), …, g(n), …, g(N)} represents the set of genes. Each element of G corresponds to a row of the gene expression matrix. C = {c(1), c(2), …, c(m), …, c(M)} represents the set of experimental conditions, time points, or tissue samples. Each element of C corresponds to the columns of the gene expression matrix. The entry a(n,m) or simply anm of the gene expression matrix corresponds to a real value representing the relationship between row n and column m, which is the expression level of the nth gene: g(n), under the mth experimental condition: c(m). The nth row g(n) = a(n,:) = [a(n,1) a(n,2) …
a(n,m) … a(n,M)] is a 1 × M vector. It corresponds to the expression level of the nth gene under the M experimental conditions. The mth column c(m) = a(:,m) = [a(1,m) a(2,m) … a(n,m) … a(N,m)]T is an N ×
1 vector. It corresponds to the expression level of the N genes under the mth experimental condition. As we mentioned above, the microarray technology has a very high throughput interrogating thousands of genes at the same time. However, the process includes numerous sources of variability (Kerr & Churchill, 2001; Yang & Speed, 2002). Several tools such as statistical experimental design and data normalization can help to obtain high quality results from microarray experiments
!
" # $
Preprocessing of the data is an important step prior to biclustering. The aim of normalization is to account for systematic differences across different datasets and eliminate artifacts. The challenge of normalization is to remove as much technical variations as possible while leaving the biological variation untouched. Few general preprocessing techniques such as the logarithmic transformation are useful for all microarray platforms, whereas many others are specific to a given technology. A good review of normalization of microarray data can be found in (Quackenbush, 2002).
Depending on the type of biclusters (see Section Bicluster Models and Statistical Evaluations below) one seeks to identify; a second step is the removal of all genes that show low variation across samples or experimental time points, which may affect negatively the subsequent biclustering process. Researchers may be tempted to apply principal component analysis (PCA) to reduce the dimensionality of the data prior to clustering or biclustering, but it is proved to not improve the results especially in the classical clustering context. It has been suggested that the quality of the clusters is not necessarily higher with PCA than without it; in most cases the first principal components does not necessarily yield the best clusters (Yeung & Ruzzo, 2001).
#%
&
%
#%
#
'"
similar regulatory mechanisms. This is often referred to as the guilt by association principle (Androulakis et al., 2007). Therefore, identifying coherent expression profiles is important in order to identify co$ regulation and to understand the underlying machinery driving the co$expression. From a computational perspective, this is a clustering problem. Clustering of co$expressed gene has been active biological data mining topic and advances in parallel with the development of DNA microarray technology.
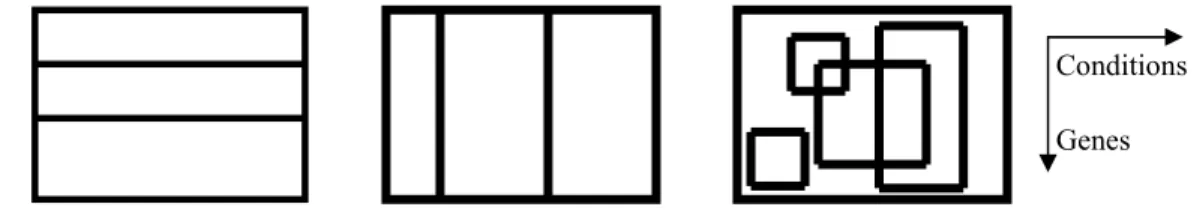
Clustering is the process of classifying data objects into a set of disjoint classes, called clusters, so that objects within a class are highly similar to each other, while objects in separate classes are dissimilar (Xu & Wunch, 2005). One of the characteristics of gene expression data is its coherent structure with regard to subspaces in either or both dimensions (genes and/or samples). Therefore, co$expressed genes can be clustered based on their expression patterns along either or both of these two dimensions. In gene$based clustering (Figure 1A) the genes are treated as the objects, while the samples are the features. Sample$ based clustering (Figure 1B), on the other hand, regards the samples as the objects and the genes as the features.
Figure 1. Schematic illustration of conventional clustering vs. biclustering algorithms: (A) gene6based clustering, (B) sample6based clustering, and (C) biclustering or gene6sample6based clustering.
The distinction of gene$based clustering and sample$based clustering is that the clustering tasks are based on different characteristics in gene expression data. Some clustering algorithms, such as K$means (see Xu & Wunch, 2005) and hierarchical (Eisen et al., 1998) approaches can be applied to classify either genes or samples based on expression profiles along the respective dimension. Both the gene$based and sample$ based clustering approaches perform exclusive and exhaustive partitions of objects that share the same feature space.
The main difference between clustering and biclustering is that clustering can be applied to either the rows or the columns of the data matrix, separately. Biclustering, on the other hand, performs clustering in these two dimensions simultaneously (Figure 1C). That is, unlike clustering algorithms, biclustering algorithms identify subgroups of genes that show similar activity patterns under a specific subset of the experimental conditions. Note that biclustering algorithms are also known as co$clustering, two$ dimensional clustering, or two$way clustering in other research fields. Biclustering is an unsupervised learning technique. That is, no prior knowledge about the data one seeks to cluster is available, as opposed to a supervised learning approach.
(# "
"%#
' " # ! ) ) ( #%
Given the representation of the gene expression matrix as in Equations 1A or 1B, we will define a bicluster using Equations 2A or 2B:
B = [b(i,j)] = [bij]; (2A)
S = {I, J}. (2B)
Mathematically, a bicluster can be viewed as a submatrix B of A (Equation 2A), or as a subset S of R (Equation 2B) whose elements are I and J, with I
⊆
G, and J⊆
C, furthermore, i∈I and j∈J. In a setConditions
notation, the entire set of biclusters is defined as: 9 = {26tuples (Ik,Jk), Ik⊆G and Jk ⊆C}, k = 1 to K, and
K is the total number of biclusters.
In the following, the cardinality (defined as card(.) or |.|), of a set corresponds to the number of its elements. For example, card(G) = |G| = N is the number of genes in a gene expression matrix, and
card(C) = |C| = M is the number of experimental conditions, time points, or tissue samples, card(9) = | 9 | = K is number of biclusters. Below, when dealing with biclusters: S = {I, J}, we use |I| = I and |J| = J
unless specified. (# " ) "%#
Biclustering algorithms should be able to address the following three problems.
!" Given the gene expression matrix as define above, the specific problem addressed by biclustering algorithms is to identify the set of biclusters 9 = {26tuples (Ik,Jk), Ik⊆ G and Jk ⊆C} such that the entries of each bicluster Bk = [b(i,j)] (with i∈Ik and j∈Jk) satisfies some specific characteristics of homogeneity (see Section on Bicluster Models and Statistical Evaluations below).
#" Because of the noisy nature of DNA microarray experiments, not only biclustering algorithm should be capable to identify the sets of biclusters that are statistically significant, but also, they should be robust to noise.
$" Since the end goal of any DNA microarray experimental study is to answer specific biological questions, biclustering algorithms should be able to identify sets of biclusters that are biologically meaningful.
*
*
+
Several mathematical models have been defined in the literature not only to model biclusters, but also to aid in biclustering algorithm designed and to statistically and biologically evaluate their significance.
)
Recall that a bicluster is defined as B = [b(i,j)] = [bij]. Let’s define the following statistical parameters: biJ is the mean of the ith row in the bicluster and it is defined using Equation 3A, bI j is the mean of the j
th column in the bicluster, and it is defined using Equation 3B, and bIJ is the mean of all the elements of the bicluster and it is defined using Equation 3C.
∑
∈ = J j ij iJ b J b | | 1 (3A)∑
∈ = I i ij Ij b I b | | 1 (3B)∑∑
∑
∑
∈ ∈ ∈ ∈ = = = I i j J ij I i Ij J j iJ IJ b J I b J b I b | || | 1 | | 1 | | 1 (3C)The variance and the mean square residue of a bicluster or a matrix can be defined using Equation 4 and Equation 5 respectively.
∑∑
∈ ∈ − = I i j J IJ ij b b B V( ) ( )2 (4)∑∑
∈ ∈ + − − = I i j J IJ Ij iJ ij b b b b J I B H ( )2 | || | 1 ) ( (5)#%
! #
!
#
& #%
Biclustering algorithms are usually designed to identify one of the following five models: biclusters with constant values, biclusters with constant values on rows, biclusters with constant values on columns, biclusters with coherent values, and biclusters with coherent evolutions.
%
Biclusters with constant values in a gene expression matrix describe subsets of genes with equal
expression values within a subset of experimental conditions. Mathematically they can be modeled using Equation 6 assuming that the data is noise free.
B = [b(i,j)] = [bij] = [>] (6) Equation 7 shows an example of a noise free bicluster with constant values. This synthetic bicluster has 4 genes (rows) and 4 experimental conditions (columns).
(7)
One can easily show that the variance of such noise free bicluster is zero.
Proof.
Recall that the variance of a matrix or a bicluster is defined as:
∑∑
∈ ∈ − = I i j J IJ ij b b B V( ) ( )2 (8)Since B = [b(i,j)] = [bij] = [>] and S = {I, J}, we have:
∑ ∑
∑ ∑
∑ ∑
∑ ∑
∑ ∑
∈ ∈ ∈ ∈ ∈ ∈ ∈ ∈ ∈ ∈ − = − = − = I i j J i I j J I i j J i I j J ij ij I i j J IJ ij IJ b IJ b b b B V( ) ( )2 ( 1 )2 ( 1 )2 (9)∑ ∑
∑ ∑
∈ ∈ ∈ ∈ = − = − = I i j J i I j J IJ IJ B V( ) ( 1 ) ( )2 0 (10)In real applications, because of the noisy nature of the data, a bicluster with constant values becomes B =
[bij] = [>+εij], where εij represent the expected level of noise generated during microarray experiments. Hence of, the variance of biclusters with constant values becomes:
δ
< − =∑∑
∈I ∈ i j J IJ ij b b B V( ) ( )2 (11)where δ is a small positive number, which is usually defined by the user. This merit function (Equation 11) is used to evaluate the statistical significance of biclusters with constant values.
%
Biclusters with constant values along rows indicate a subset of genes with expression levels that do not change across a subset of conditions, irrespective of the actual expression levels of the individual genes. Mathematically, a noise free bicluster with constant values on rows can be modeled using the following equations:
B = [b(i,j)] = [bij] = [>+αi] additive model. (12A)
B = [b(i,j)] = [bij] = [>αi] multiplicative model. (12B) Equation 13 shows an example of a noise free bicluster with constant values on rows. This synthetic bicluster has 4 genes (rows) and 4 experimental conditions (columns).
4 4 4 4 3 3 3 3 2 2 2 2 1 1 1 1α
α
α
α
α
α
α
α
α
α
α
α
α
α
α
α
(13)Using either the additive or the multiplicative model, we can show that max(b(i,:)) – min(b(i,:)) = 0. In noisy dataset, we have max(b(i,:)) – min(b(i,:)) = δi , and the statistical evaluation of this type of bicluster is done using Equation 14.
max(b(i,:)) – min(b(i,:) < δ, for all i∈Ik. (14) %
Biclusters with constant columns isolate a subset of conditions for which a subset of genes have constant expression values that may differ from condition to condition. Mathematically, a noise free bicluster with constant values on columns can be modeled using the following equations:
B = [b(i,j)] = [bij] = [>+βj] additive model. (15A)
B = [b(i,j)] = [bij] = [>βj] multiplicative model. (15B) Equation 16 shows an example of a noise free bicluster with constant values along columns. This
synthetic bicluster has 4 genes (rows) and 4 experimental conditions (columns).
4 3 2 1 4 3 2 1 4 3 2 1β
β
β
β
β
β
β
β
β
β
β
β
β
β
β
β
(16)Using either the additive or the multiplicative model, we can show that max(b(:,j)) – min(b(:,j)) = 0. In noisy dataset, we have max(b(:,j)) – min(b(:,j)) = δj , and the statistical evaluation of this type of bicluster is done using Equation 17.
max(b(:,j)) – min(b(:,j)<δ , for all j∈Jk. (17) %
Biclusters with coherent values identify subset of genes that are up$regulated and down$regulated coherently across subsets of conditions, i.e. same magnitude and same direction across experimental conditions. Mathematically, a noise free bicluster with coherent values can be modeled using the following equations:
B = [b(i,j)] = [bij] = [>+αi+βj] additive model. (18A)
B = [b(i,j)] = [bij] = [>αiβj] multiplicative model. (18B) Equation 19 shows an example of a noise free bicluster with coherent values. This synthetic bicluster has 4 genes (rows) and 4 experimental conditions (columns).
+
+
+
+
+
+
+
+
+
+
+
+
+
+
+
+
4 4 3 4 2 4 1 4 4 3 3 3 2 3 1 3 4 2 3 2 2 2 1 2 4 1 3 1 2 1 1 1β
α
β
α
β
α
β
α
β
α
β
α
β
α
β
α
β
α
β
α
β
α
β
α
β
α
β
α
β
α
β
α
or
4 4 3 4 2 4 1 4 4 3 3 3 2 3 1 3 4 2 3 2 2 2 1 2 4 1 3 1 2 1 1 1β
α
β
α
β
α
β
α
β
α
β
α
β
α
β
α
β
α
β
α
β
α
β
α
β
α
β
α
β
α
β
α
(19)The mean square residue (MSR) of such biclusters is shown to be zero.
Proof.
Recall that the MSR of a matrix or a bicluster is defined as:
∑∑
∈ ∈ + − − = I i j J IJ Ij iJ ij b b b b J I B H ( )2 | || | 1 ) ( . (20)Given that B = [b(i,j)] = [bij] = [>+αi+βj] and S = {I, J}, we have:
∑∑
∑
∑
∑∑
∈ ∈ ∈ ∈ ∈ ∈ + + + + + − + + − + + = I i j J j J j I i i J j j i I i j i j i IJ J I IJ B H( ) 1 (( α β ) 1 ( α β ) 1 ( α β ) 1 ( α β ))2 (21) 0 ) 1 1 1 1 ( 1 ) ( =∑∑
+ + − −∑
− − − −∑
+ +∑
+∑
2 = ∈I ∈ ∈ ∈ ∈ ∈ i j J j J j I i i J j j i j I i i j i J I J I IJ B H α β α β α β α β (22)Same proof can be done using the multiplicative model. In real applications, because of the noisy nature of the data, a bicluster with coherent values becomes B = [bij] = [>+αi+βj+εij], where εij represent the expected level of noise generated during microarray experiments. Hence of, real biclusters with coherent values are evaluated using the following merit function:
δ
< + − − =∑∑
∈I ∈ i j J IJ Ij iJ ij b b b b J I B H ( )2 | || | 1 ) ( (23)where δ is a very small positive number, which is usually defined by the user.
In Equations 6, 12, 15, 18, > is usually referred to as the background effect, αi the row or gene effect, and
βj the column or condition effect. Hence of, constant biclusters: > correspond to background effect, constant values on rows biclusters: >+αi to the background effect + rows or genes effect, constant values on columns biclusters: >+βj to the background effect + column or condition effect, whereas coherent values biclusters: >+αi+βj correspond to the summation of the background effect + gene effect + condition effect.
% "
Unlike biclusters with coherent values, biclusters with coherent evolutions identify subsets of genes that are up$regulated or down$regulated coherently across subsets of conditions irrespective of their actual values, i.e. same directions but varying magnitude. Unlike other types of biclusters, coherent evolution biclusters are difficult to model using a mathematical equation. But, depending on how coherent evolution is defined, several merit function can be defined for their statistical validation. For example, Ben$Dor et al. (2003) define a coherent evolution bicluster using the order preserving submatrix (OPSM) framework, in which the expression levels of all genes induce the same linear ordering of the experiments, and used the upper bound on the probability (Equation 24) of having a bicluster with J experimental conditions and
I or greater number of genes, to estimate their statistical significance.
n N n N I n
n
J
J
N
J
M
M
I
J
Z
− =
−
+
−
=
∑
!
1
1
!
1
)
1
...(
)
,
(
(24)N and M are the number of genes and experimental conditions respectively. Equation 24 is derived as
follows. 1/J! represents the probability that a random row (gene) belongs to an order preserving model that has J columns. Since the rows are assumed to be independent, the probability of having at least I rows in the order preserving model is the I6tail of the (N, (1/J!)) binomial distribution i.e. the summation term of Equation 24. Finally, M…(M6J+1) represents the number of ways to choose a complete order preserving model. Equation 25 shows an example of a bicluster with coherent evolution. This synthetic bicluster has 4 genes (rows) and 4 experimental conditions (columns) and they all have the same induced permutation [2 3 1 4]. 8 3 7 5 7 2 6 4 5 1 3 2 4 0 2 1 (25)
Such coherent evolution patterns might arise, for example, if the set of experimental conditions J represents distinct stages in the progress of a disease or in a cellular process and the expression levels of all genes in I vary across the stages in the same way. Similar approach has also been used by several other authors: (Tewfik et al., 2006 and references therein).
& !. Mathematically, one can show that biclusters with constant values are special cases of biclusters with constant values along rows (max([>]) – min([>]) = 0, for all i∈Ik) or along columns (max([>]) – min([>]) = 0, for all j∈Jk).
& #. It can also be shown that biclusters with constant values, with constant values on rows or columns are special cases of biclusters with coherent values: H([>]) = 0; H([>+αi]) = 0; H([>αi]) = 0;
H([>+βj]) = 0; H([>βj]) = 0.
& $. Likewise, it can also be shown that each of above four types of biclusters is a special case of biclusters with coherent evolutions.
Nevertheless, the biological interpretation of each type of bicluster should be unique and specific to the problem that the DNA microarray experimental design sought to solve.
There are several properties that could be inferred from the above definitions and that could be used in biclusters identification designed. Recall that an N × M gene expression matrix is defined as: A = [anm] =
[a(n,m)], with set of genes G and set of experimental conditions C. Furthermore, let us define L as the
number of distinct entries of the gene expression matrix A.
' !. In a gene expression matrix the total number of biclusters with constant values on M experimental conditions is ≤ L.
' #. From property 1, we can infer that the total number of biclusters with constant values in a gene expression matrix will always be ≤ L × 2M61.
' $. In a gene expression matrix the total number of biclusters with constant values on rows on M experimental conditions is either 0 or 1.
' (. From property 3, one can also infer that the total number of biclusters with constant values on rows in a gene expression matrix is ≤ 2M61.
' ). If a subset of I1 genes are co$expressed across a subset of J1 experimental conditions, they will always be co$expressed across a subset of J2 experimental conditions, with J2⊆ J1.
Property 1 can easily be shown as follows. Since the gene expression matrix has L distinct entries, it can be written as in Equation 26.
∑
= = L l l lA A 1λ
(26)λls are the distinct values and Als the binary matrices associated to each λl (l = 1 to L). Thus in each Al, we can only identify one bicluster with constant value on the entire M experimental conditions. Since we have L Al, we can conclude that the total number of biclusters with constant values on M conditions in a gene expression matrix is ≤ L. The other properties can be shown similarly.
#
#
& #%
)
#%
As we described above, a good biclustering algorithm identifies genes with similar expression patterns. These co$expressed genes are probably controlled by the same transcription factors. In addition, genes that are co$expressed frequently participate in the same biological pathways. In both cases, if the identified biclusters are biologically meaningful, then their corresponding sets of genes should be
enriched with and annotated under the same gene ontology terms, involved in the same biological
pathways, or regulated by the same transcription factors. The biological role of the genes in the biclusters can be assessed using several external biological datasets and knowledge bases such as Gene Ontology, transcription factor gene interactions data, biological pathways databases, protein$protein interactions data, microRNA, and epigenetic modifications data.
( # # , -# ! ) ( #% & #%
Biological evaluation of the significance of biclusters can be tested using biological knowledge from publicly available knowledge and databases.
* + The Gene Ontology provides controlled vocabularies for the description of the molecular function, biological process, and cellular component of gene products (The Gene Ontology Consortium, 2000; DayRichter et al., 2007; Carbon et al., 2009). Biclustering algorithms should be able to identify sets of genes that are annotated under the same or related Gene Ontology terms (Prelic et al., 2006; Tchagang et al., 2008).
' '
Transcription factor (TF) gene associations data describe with a given probability whether or not a given gene is regulated by a specific transcription factor under a given experimental condition. Ideally, TF$gene associations data are derived from Chromatin Immunoprecipitation (ChIP) (Buck et al., 2004; Lee et al., 2002) experiments. ChIP is a well$established methodology used to investigate interactions between TFs and their genomic DNA targets in vivo. They can also be compiled from literature search and/or TF databases of well known and well characterized biological interactions such as TRANSFAC (Matys et al., 2006), JASPAR (Sandelin et al., 2004), PRODORIC (Munch et al., 2003), RegulonDB (Salgado et al., 2006), YEASTRACT (Teixeira et al., 2006), and SCPD7 (Zhu et al., 1999). For example, TRANSFAC is a database on eukaryotic transcriptional regulation. The database contains data on TFs, their target genes and their experimentally$proven binding motifs. Good biclustering algorithms identify sets of genes that are co$regulated by the same TFs (Tchagang et al., 2008; Tchagang et al., 2009).
' ' ,' In addition to GO annotations and
TF$gene interactions data, other types of biological knowledge such as metabolic and protein$protein interaction networks, that have been derived from other types of data than gene expression can be used. Although each type of data reveals other aspects of the underlying biological system, one can expect to a certain degree that genes that participate in the same pathway respectively form a protein complex also show similar expression patterns (Zien et al., 2000; Ideker et al., 2002; Ihmels et al., 2002). The question here is whether the computed biclusters reflect this correspondence. Hence of, biclustering algorithms should be able to identify sets of genes that are associated with the same pathways (Tchagang et al., 2010). In this regard, there are several pathways and protein$protein interactions databases such as KEGG pathways (Shujiro et al., 2008) that can be used to verify this hypothesis. The KEGG database for
example provides a very rich resource for pathways. Its aim is to link individual level information such as genes, proteins, enzymes, with system level information such as interactions, enzymatic reactions, and pathways.
There are several other biological data such as microRNA and epigenetic modifications data that could also be used for biclusters biological evaluation. In higher organisms it is well documented that response to environments occurs at the transcriptional level. TFs, microRNAs, and epigenetic modifications can combine to form a complex regulatory network (Huttenhower et al., 2009 and references therein).
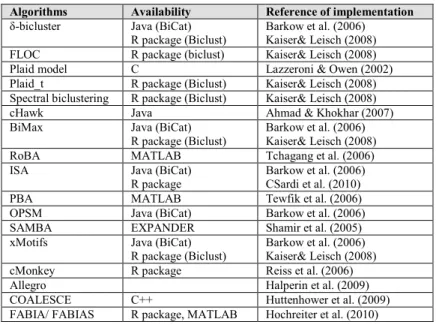
There are several packages available for functional characterization of gene groups (Table 1), among many others that are referenced in the microarray tools’ section at the GO website, and new ones are being released (Coulibaly & Page, 2008).
Table 1. Example of biological evaluation packages. ,% ' - ' ' *+ % + & BiNGO Hypergeometric test, binomial FDR, Bonferroni Commercial arrays Available, GOSlim
Not available Cytoscape plug$in Maere et al. (2005) CLENCH2 Hypergeometric
test, binomial, χ2 N/A User$provided Static global Not available Windows Shah & Fedoroff
(2004) DAVID Hypergeometric, Fisher’s exact Bonferroni, Benjamini, FDR User$ provided Available KEGG pathways TRANSFAC Web$based, standalone Dennis et al. 2003; Huang et al. (2009) Fatigo Fisher’s exact FDR User$
provided Available KEGG pathways, SwissPROT keywords Any Al$Shahrour et al. (2003)
FuncAssociate Fisher’s exact Monte Carlo simulation
User$ provided
Not available
Not available Web$based Berriz et al. (2003) GOAL Hypergeometric, Fisher’s exact Bonferroni, Benjamini, FDR User$ provided
Available TF$gene data, KEGG pathways Any, standalone, plug$in, web server Tchagang et al. (2010) GOSt Hypergeometric, Fisher’s exact Bonferroni, Benjamini, User$ provided Available KEGG pathways
Linux Jüri Reimand et al. 2006 GOstat Hypergeometric, Fisher’s exact Holm Benjamini, Yekutieli User$ provided
Available Not available Web$based Beißbarth, & Speed (2004)
GoSurfer χ2 FDR Affymetrix
only
Lowest level
Not available Windows Zhong et al. (2004) GoToolBox Hypergeometric
test, Fisher’s exact test, binomial
Bonferroni User$ provided
Available Not available Any Martin et al. (2004)
Onto$Express Hypergeometric test, Fisher’s exact test, binomial, χ2 Bonferroni, Holm, Sidak, FDR commercial array Available Chromosomal position Any Draghici et al. (2003)
Several of these testing tools can be easily implemented using computational packages. One common strategy is to create a custom data analysis pipeline using statistical analysis software packages such as R and MATLAB. Both allow great flexibility, customized analysis, and access to many specialized
packages designed for analyzing gene expression data. Not only is R freely available, but also allows the use of BioConductor (Gentleman et al., 2005), a collection of R tools including many powerful current gene expression analysis methods written and tested by experts from the growing microarray community.
.
Given the huge amount of work on biclustering algorithms, it is impossible to cover all proposed algorithms. Instead, we give a comprehensive survey of some of the most influential biclustering algorithms and their variations. Thus providing a platform for researchers from different background to develop novel biclustering algorithms, improve or use the existing ones to solve various biological problems. Some of the algorithms discussed below aim at finding only one bicluster. This is always viewed as the best bicluster based on some statistical criteria. Other algorithms aim at finding the K best biclusters. Furthermore, some algorithms iteratively find one bicluster or a group of biclusters during each iteration, whereas others find the entire set of biclusters simultaneously. Most of the pioneering
biclustering algorithms only make use of the gene expression data, whereas a few of the most recent ones take an integrative data approach (Huttenhower et al., 2009; Halperin et al., 2009; Reiss et al., 2006), i.e., they consume data from several different platforms to tune their search into more parsimonious results.
Below, biclustering algorithms are classified into two categories: non$integrative and integrative approach.
/
&
'
In the non$integrative approach, the biclustering algorithm takes the gene expression matrix and outputs one or more biclusters.
' ! '% ' # '" 0 / # '"1 ! &
Cheng and Church (2000) define a bicluster to be a submatrix of the gene expression matrix, for which the mean squared residue score (Equation 20) is below a user defined threshold δ (Equation 23). Each entry bij in the bicluster is the superposition of: the background level, the row (gene) effect, the column (condition) effect, and the noise: B = [bij] = [>+αi+βj+εij] (Equation 18A). They hypothesized that a dataset can contain a number of K biclusters, which are not necessarily disjoint, and showed that the problem of finding the largest δ–biclusters is NP6complete.
Cheng and Church (CC$Algorithm) 2000 $$$$$$$$$$$$$$$$$$$$$$$$$$$$$$$$$$$$$$$$$$$$$$$$$$$$$$$$$$$$$$$$$$$$$$$$$$$
Input
$ A Gene expression matrix $ G Set of genes
$ C Set of experimental conditions $ δ Maximum mean square residue Output
$ = {2 tuples (Ik,Jk), Ik⊆G and Jk ⊆C}, k = 1 to K.
Begin
(i) Initialize bicluster: a. Bk = A
b. Ik = G
c. Jk = C
d. Compute H. (ii) Deletion phase
a. While H > δ
i. Remove rows and columns that maximize H. ii. Compute H.
(iii) Addition phase a. While H < δ
i. Add previously deleted rows and columns. ii. Compute H.
(iv) Output
a. Ik = Set of co expressed genes;
b. Jk = Set of conditions under which they (Ik) are co expressed;
c. Bk = Gene expression level in bicluster;
(v) Mask identified bicluster Bk with random number in A and go to (i).
End Begin
$$$$$$$$$$$$$$$$$$$$$$$$$$$$$$$$$$$$$$$$$$$$$$$$$$$$$$$$$$$$$$$$$$$$$$$$$$$$$$$$$$$$$$$$$$$$$$$$$$$$$$$$$$$$$$$$$$$$$$$$$$$$$ Cheng and Church (2000) proposed a two$phase greedy algorithm to identify δ–biclusters. (i)
δ) is fulfilled. (ii) : previously deleted rows and columns are added to the resulting submatrix as long as the bicluster score does not exceed δ. This procedure is composed of several iterations and each iteration is restricted to the identification of only one bicluster while previously defined biclusters are masked with random values. The masking of previously discovered biclusters with random numbers and the subsequent discovery of new ones as in the original CC$algorithm may result in the phenomenon of random interference which in turn impacts the discovery of high quality biclusters. Also, the CC$algorithm is unlikely to identify overlapping biclusters. To address some of these issues and to further accelerate the biclustering process, Yang et al. (2002 & 2003) proposed the flexible overlapping biclustering (FLOC) algorithm, which is basically a generalized model of δ–bicluster that incorporates null values to handle missing values in a bicluster up to a threshold. Then, they developed the FLOC algorithm to discover a set of K possibly overlapping biclusters simultaneously.
The CC and the FLOC algorithms use MSR to evaluate the score of a bicluster during the bicluster identification procedure. Unfortunately, when this formula is used, it is common to find submatrices of δ6 biclusters that are not δ6biclusters, thus contradicting the basic definition of a bicluster (Wang et al., 2002). Furthermore, many δ6biclusters found in a given dataset may differ only in one or two outliers they contain. Some of these issues are due to the fact that when the MSR is used as scoring function, it
measures the square deviation from the sum of the mean value of expression levels in the entire bicluster, and the mean values of expression levels along each row and column in the bicluster. In conclusion, even if the MSR can be used to statistically evaluate the biclusters already identified, its use as scoring function during the bicluster identification procedure inhibits the design of accurate biclustering algorithms. Wang et al. (2002) introduced the pCluster to solve the problems related to MSR. A submatrix B = [bij] or S = {I,J}, with , i∈I and j∈J is considered a δ6pCluster if the absolute difference of the differences of
the attribute (condition) values of two objects (genes) is less than a threshold δ for every pair of objects and attributes. That is
δ
≤ − − − ∈ ∀ ∈ ∀x,y I, u,v J,|(bxu bxv) (byu byv)| (27) The first advantage of their pCluster model is that any submatrix of a δ6pCluster is also a δ6pCluster. This property is fundamental to their developed pCluster algorithm, which locates δ6pClusters by firstidentifying two$object and two$attribute pClusters and incrementally builds larger sets. They then
developed a depth$first algorithm to efficiently and effectively discover all the pClusters with a size larger than a user$specified threshold. The pCluster algorithm is deterministic can mine multiple clusters
simultaneously, can detect overlapping clusters, and is resilient to outliers, and will not miss any qualified clusters, unlike CC and FLOC, which only provide approximations of the full bicluster set.
The key concept behind pCluster is the maximum dimension set (MDS), which are maximum length contiguous subsequences of the sorted values of the difference of two objects across all attributes bounded by the threshold δ. Although pCluster can effectively address the problem related to MSR, it only works well on small datasets. Tewfik et al. (2006) addressed the complexity issue by developing a deterministic parallel biclustering algorithm for coherent biclusters identification. Their algorithm relies on an exhaustive enumeration and an early pruning strategy to search for biclusters of genes with similar patterns. Note that the pClusters of Wang et al. (2002) are the equivalent or subclasses of coherent evolution biclusters.
There have been several other versions of the initial CC$algorithms that uses more elaborate algorithmic approaches such as genetic algorithms, fuzzy algorithms, evolutionary algorithms, multi$objective evolutionary algorithms to handle the interference problem and the quality of biclusters. Mitra and Banka (2006) employ a combination of a multi$objective evolutionary biclustering framework and local search
strategies for biclustering gene expression data, in order to generate and iteratively refine an optimal set of biclusters. In a multi$objective evolutionary biclustering framework, a non$dominated sorting genetic algorithm is used to converge to the global Pareto front and to simultaneously maintain the diversity of the population. Local search strategies are used to speed up convergence by refining the chromosomes. A vector of decision variables xp∈F is Pareto optimal if there does not exist another x∈F such that fi(x) ≤
fi(xp) for all i = 1, . . . , k and fj(x) < fj(xp) for at least one j. F denotes the feasible region of the problem (i.e., where the constraints are satisfied). Divina & Aguilar$Ruiz (2006) proposed an algorithm based on evolutionary computation, named Sequential Evolutionary Biclustering (SEBI). The algorithm employs a sequential covering strategy and an evolutionary algorithm, in order to find biclusters of maximum volume, with a mean squared residue lower than a given threshold, with a relatively high row variance, and minimizing the effect of overlapping among biclusters.
# ! " ! # ! &
The plaid model is a biclustering algorithm developed by Lazzeroni and Owen (2002) for the analysis of gene expression data. It combines a statistical modeling approach and linear algebra techniques for biclusters identification. In plaid model, the gene expression matrix is modeled as a superposition of layers, corresponding to biclusters.
Given the gene expression matrix A = [anm] = [a(n,m)], the plaid model consists of a bias plus a sum of K layers, where each layer is a bicluster. The expression value in a bicluster corresponds to the sum of the background effect, the gene effect, and the condition effect, i.e.:
∑
= + + + = K k mk nk mk nk k nm a 1 0 (α
β
)ρ
θ
. (28)ρ and θ are matrices of size N × K and M × K, respectively, containing binary membership variables, i.e. ρnk∈{0,1} and θmk∈{0.1}. For example, ρnk = 1 if and only if gene n belongs to bicluster k, and θmk = 1 if and only if condition m belongs to bicluster k.
The authors then derive an iterative heuristic algorithm that attempts to find the model parameters (K, >0,
>k, αnk, βmk, ρnk, and θmk) by minimizing the quadratic error (Equation 29) between the original gene expression matrix and the model given in (Equation 28).
∑∑
∑
= = = + + + − N n M m K k mk nk mk nk k nm a 1 1 1 2 0 ( ) ] . [α
β
ρ
θ
(29) Subject to:∑
∑
= = = = N n M m mk mk nk nk 1 1 0 and 0β
θ
ρ
α
(30)The constraints (Equation 30) are added to reduce the number of parameters. Furthermore, the following approaches can be used to determine the initial memberships of ρ and θ. That is: (i) all parameters set to
0.5; (ii) all parameters set to random values near 0.5; (iii) more complicated heuristics such as fixing all ωnmk=>k+αnk+βmk to 1, perform several iterations that update ρ and θ only, and scale ρ and θ so that they sum to N/2 and M/2 respectively (Lazzeroni & Owen, 2002).
Plaid Models; Lazzeroni & Owen 2002 $$$$$$$$$$$$$$$$$$$$$$$$$$$$$$$$$$$$$$$$$$$$$$$$$$$$$$$$$$$$$$$$$$$$$$$$$$$$$
Input
$ A Gene expression matrix $ G Set of genes
$ C Set of experimental conditions $ S maximum cycle per iteration
Output
$ = {2 tuples (Ik,Jk), Ik⊆G and Jk ⊆C}, k = 1 to K
Begin
(i) set K = 0
(ii) Compute initial value: ρnk and θmk
(iii) Adding a new layer a. K = K+1; s = 1; b. While s < S, do
i. Compute: =k, αnk, and βmk (Equation 30)
ii. Compute: ρnk and θmk (Equation 32)
iii. If the importance of layer k is not random 1. Record the layer and go to (iii). iv. End
(iv) Output
a. Ik = Set of co expressed genes;
b. Jk = Set of conditions under which they (Ik) are co expressed;
c. Bk = Expression level in biclusters;
End Begin
$$$$$$$$$$$$$$$$$$$$$$$$$$$$$$$$$$$$$$$$$$$$$$$$$$$$$$$$$$$$$$$$$$$$$$$$$$$$$$$$$$$$$$$$$$$$$$$$$$$$$$$$$$$$$$$$$$$$$$$$$$$$$ Lagrange multipliers can be used to obtain θk from ρk61 and κk61, i.e. the best fit of the models, subject to the condition that every row and column has a zero mean.
=
∑
∑
∑∑
= = = = − M m mk N n nk N n M m K nm mk nm k z 1 2 1 2 1 1 1θ
ρ
θ
ρ
,∑
∑
= = − − = M m mk nk M m mk mk nk k K nm nk z 1 2 1 1 ) (θ
ρ
θ
θ
ρ
α
,∑
∑
= = − − = N n mk nk N n nk mk nk k K nm mk z 1 2 1 1 ) (θ
κ
ρ
θ
ρ
β
(31)The residual znmK−1from the first K61 layers is defined as:
∑
− = − = − − 1 1 0 1 K k mk nk nmk nm nm K nm a zω
ω
ρ
θ
(32)∑
∑
= = − = M m mk nmk M m K nm mk nmk nk z 1 2 2 1 1θ
ω
θ
ω
ρ
,∑
∑
= = − = N n nk nmk N n K nm nk nmk mk z 1 2 2 1 1ρ
ω
ρ
ω
θ
(33)During the iterative procedure, new layers are added to the model one at a time, and it stops when a layer has a smaller size than expected (found by random permutation of data, i.e., after finding a layer, permute (residual) elements of anm (i.e., the znm) by row and by column. Compute importance of permuted layers, and see if larger or smaller than importance of layer K). The algorithm can also stop if Kmax (a user defined parameter) layers have been found (Lazzeroni & Owen, 2002).
The features of the plaid model make it an attractive method for biclustering of gene expression data. It can effectively address several problems posed by the CC$algorithm and some of its variants (see above). However, the efficiency of the original plaid model algorithm maybe compromised by the relaxation of binary constraints on the bicluster membership parameters in the model. Furthermore, in the original plaid model, the authors implicitly assumed that the noise in the gene expression matrix is Gaussian. To
address the first problem, Turner et al. (2005) introduced an extended version of the plaid model
algorithm that takes advantage of the binary constraints on the cluster membership parameters, providing a simpler and more direct method of optimization. Their model$based method partially supervises the plaid model algorithm to favor biclusters corresponding to the external grouping information, in order to determine whether the biclusters are related to one or more a priori groups. In addition, their model$based method extends the original plaid model to biclustering whole time series of expression levels.
Other difficulties that exist with the plaid model are due to the fact that there are mixed binary and continuous variables in its modeling framework, for which the traditionally used optimization algorithms suitable for continuous variables cannot be employed in the realization of the biclustering process. Zhang et al. (2008) developed a neural$network approach to tackle such a mixed binary and continuous
optimization problem. Note that, their method is proposed only to tackle the mixed continuous and binary optimization problem that is intrinsic in the plaid model. Two mutually interactive parts in the neural network, with one corresponding to the binary value of θ and the other to the binary value of ρ, are introduced. The two variables of θ and ρ are firstly relaxed to two continuous variables which are constrained in the range of [0, 1] by an appropriate definition of the activation function. Upon convergence of the network, the variables are forced automatically to the binary values of 0 or 1. Caldas and Kaski (2008) reformulated the original plaid model in a Bayesian framework (Equation 34), and developed a collapsed Gibbs sampler for inferring the posterior distribution of bicluster memberships, more specifically the binary membership variables that indicate which genes and which conditions belong to each bicluster. + +
∑
= K k mk nk mk nk nm Ν a 1 2 0 ( ) , ~α
β
ρ
θ
σ
(34)In Equation 34, each entry anm is conditioned on the parameters >0, αn, βm, ρn, θm, and σ 2
, is assumed to follow a Gaussian distribution. Like Caldas & Kaski, Gu and Liu (2008) also reformulated the original plaid model in the Bayesian framework and implemented a Gibbs sampler for biclusters inference. For multiple biclusters identification, they constrain the overlapping of biclusters to only one direction (i.e., either gene or condition direction), and use a more flexible error model, which allows the error term of each bicluster to have a different variance.
' ! & %(" 0 1 # '" ! &
Most clustering models, including those used in subspace clustering described above, define similarity among different objects by distances over either all or only a subset of the dimensions. Some well$known distance functions include Euclidean distance, Manhattan distance, and cosine distance. However, distance functions are not always adequate in capturing correlations among the objects. In fact, strong correlations may still exist among a set of objects even if they are far apart from each other as measured by the distance functions.
In cell biology, investigations have shown that more often than not, several genes contribute to a disease, which motivates researchers to identify a subset of genes whose expression levels rise and fall coherently under a subset of conditions, i.e., they exhibit fluctuation of a similar shape when conditions change. Discovery of such clusters of genes is essential in revealing the significant connections in gene regulatory networks. As in the case of pCluster (Wang et al., 2002) described above, algorithms discussed here focus on finding cluster of objects that have coherent evolutions (i.e. same directions but varying magnitudes.) rather than objects that are physically close to each other (i.e. same directions and same magnitudes). Ben$Dor et al. (2003) tackled coherent evolution patterns identification as an order preserving submatrix (OPSM) problem. They defined a bicluster as a submatrix that preserves the order of the selected columns for all of the selected rows. In other words, the expression values of the genes within a bicluster induce an identical linear ordering across the selected samples. Based on a stochastic model (Equation 24), the authors developed a deterministic heuristic algorithm to find the largest and statistically significant bicluster. To motivate their heuristic approach to the OPSM problem, they showed that the OPSM problem is NP$Hard.
OPSM; Ben$Dor et al. 2003 $$$$$$$$$$$$$$$$$$$$$$$$$$$$$$$$$$$$$$$$$$$$$$$$$$$$$$$$$$$$$$$$$$$$$$$$$$$$$$$$$$$$$$$$$$$
Input:
$ A gene expression matrix $ G Set of genes
$ C Set of experimental conditions Output
$ = {2 tuples (Ik,Jk), Ik⊆G and Jk ⊆C}, k = 1 to K
Begin
(i) Evaluate all (1, 1) partial models and keep the best l of them. (ii) Expand them to (2, 1) models and keep the best l of them.
(iii) Expand them to (2, 2) models and keep the best l of them. (iv) Expand them to (3, 2) models and keep the best l of them. (v)
(vi) Until getting l ([s/2], [s/2]) models, which are complete models. (vii) Output the best one.
a. Ik = Set of co expressed genes;
b. Jk = Set of conditions under which they (Ik) are co expressed;
a. Bk = Expression level in biclusters;
End Begin
Given the gene expression matrix as defined above, Ben$Dor et al. (2003) defines a complete model as (C, π), where, C is a set of conditions (columns), π is an ordering of the conditions in C. Furthermore, they define a partial model as (<c1, c2, …, ca>, <cs6b+1, …, cs>, s), where the first a and last b conditions are specified, but not the remaining s6a6b conditions, s is the size of the model. A row “supports” a model if by applying the permutation to the row; it yields a set of monotonically increasing values. Having these definitions in mind, the basic idea behind the algorithm is to grow partial models until they become complete models.
OPSM focuses on the uniformity of the relative order of the conditions rather than on the uniformity of the actual expression levels as in the plaid model or the MSR models. This approach is potentially more robust to the stochastic nature of the expression levels, and to the variation caused by the measurements process. OPSMs have been accepted as a biologically meaningful subspace cluster model, capturing the general tendency of gene expressions across a subset of conditions. As we mentioned earlier, in an OPSM, the expression levels of all genes induce the same linear ordering of the conditions. The OPSM cluster model focuses on the relative order of columns rather than the uniformity of actual values in data matrices. By sorting the row vectors and replacing the entries with their corresponding column labels, the data matrix can be transformed into a sequence database, and OPSM mining is reduced to a special case of the sequential pattern mining problem with some unique properties. In particular, the sequence database is extremely dense since each column label appears exactly once (assuming no missing values) in each sequence. A sequential pattern uniquely specifies an OPSM cluster, with all the supporting sequences as the cluster contents. The number of supporting sequences is the support for the pattern. The original OPSM algorithm of Ben$Dor et al. (2003) can be used to identify OPSMs. The authors
mentioned without proof that it can also be adapted to handle relaxations and extensions of the OPSM conditions. For example, allowing the different rows of biclusters (I × J) to induce similar but not identical orderings of the columns, or allowing the set of conditions (J) to include more than one representation of each condition of a biological process.
A recent extension to OPSM finds multiple, overlapping coherent biclusters in noisy datasets, but like the original OPSM, it is very expensive in the number of features and requires excessive computational resources if applied to large gene expression matrices. To tackle this issue, Liu et al. (2004) also defined a bicluster as an Order$Preserving Cluster (OP$Cluster) and used OPC$tree, an exhaustive bicluster
enumeration algorithm to perform simultaneous biclusters identification. Essentially, the biclustering problem is transformed into a problem of finding longest common subsequences. Each row in the input data matrix is arranged as a non$decreasing sequence of columns. These rows are then stored in a tree and simultaneously, common subsequences and number of rows supporting these subsequences are
determined by doing operations on the tree. The OP$Cluster approach uses a tree data structure, which is exhaustive in nature.
After converting each gene vector into an ordered label sequence, Teng and Chan (2007) transformed the OPSM problem into finding frequent orders appearing in the sequence set. They then developed an algorithm for finding the frequent orders by iteratively combining the most frequent prefixes and suffixes in a statistical way. Griffith et al. (2009) introduced the KiWi mining framework for massive datasets, that exploits two parameters k and w to provide a biased testing on a bounded number of candidates, substantially reducing the search space and problem scale, targeting on highly promising seeds that lead to significant clusters and twig clusters.
' & % # '" 0 1 ! &
The Iterative Signature Algorithm (ISA) considers a bicluster S = {I.,J} to be a transcription module, i.e., a set of co$regulated genes together with the associated set of regulating conditions (Bergmann et al.,
>
∈
=
>
∈
=
=
=
}
|
|
/
{
}
|
|
/
{
}
,
{
Im c c C g g G nJt
a
C
m
J
t
a
G
n
I
J
I
S
σ
σ
(35)where tg and tc are the gene and condition z$score threshold respectively. aCImrepresents the mean
expression of genes from I in the sample m, aGnJ the mean expression of the gene n in samples from J, and
σc and σg their respective standard deviation.
ISA: Bergmann et al. (2003)$$$$$$$$$$$$$$$$$$$$$$$$$$$$$$$$$$$$$$$$$$$$$$$$$$$$$$$$$$$$$$$$$$$$$$$$$$$$$$$$$$$$$$$$$$
Input:
$ A gene expression matrix $ G Set of genes
$ C Set of experimental conditions $ tg gene z score threshold
$ tc condition z score threshold
$ ε stopping criteria Output
$ = {2 tuples (Ik,Jk), Ik⊆G and Jk ⊆C}, k = 1 to K
Begin
(i) Normalize the gene expression matrix; c. Compute AC;
d. Compute AG;
(ii) Start with an initial set of genes (I);
(iii) Score all samples with respect to the selected gene set; e. Retain samples for which the score exceeds a predefined
threshold;
(iv) Score all genes with respect to the selected samples; f. Select a new set of genes for which the score exceeds a
predefined threshold;
(v) Repeat (iii) and (iV) until the set of genes and the set of samples converge to the stopping criteria;
(vi) Output bicluster
g. Ik = Set of co expressed genes;
h. Jk = Set of conditions under which they (Ik) are co expressed;
i. Bk = Expression level in biclusters;
End Begin
$$$$$$$$$$$$$$$$$$$$$$$$$$$$$$$$$$$$$$$$$$$$$$$$$$$$$$$$$$$$$$$$$$$$$$$$$$$$$$$$$$$$$$$$$$$$$$$$$$$$$$$$$$$$$$$$$$$$$$$$$$$$$ Given the gene expression matrix as defined above, the ISA normalizes the expression matrix A to obtain the two matrices AG = [anmG ] and AC = [anmC ], to eliminate any experimental errors, such that: