HAL Id: hal-01208354
https://hal.archives-ouvertes.fr/hal-01208354
Submitted on 18 Nov 2015
HAL is a multi-disciplinary open access
archive for the deposit and dissemination of
sci-entific research documents, whether they are
pub-lished or not. The documents may come from
teaching and research institutions in France or
abroad, or from public or private research centers.
L’archive ouverte pluridisciplinaire HAL, est
destinée au dépôt et à la diffusion de documents
scientifiques de niveau recherche, publiés ou non,
émanant des établissements d’enseignement et de
recherche français ou étrangers, des laboratoires
publics ou privés.
Topographs
Matthieu Pilard, Yves Epelboin, Alain Soyer
To cite this version:
Matthieu Pilard, Yves Epelboin, Alain Soyer. Fourier Filtering of Synchrotron White-Beam
To-pographs. Journal of Applied Crystallography, International Union of Crystallography, 1995, 28,
pp.279-288. �10.1107/S0021889894011076�. �hal-01208354�
279 J. Appl. Cryst. (1995). 28, 279-288
Fourier Filtering of Synchrotron White-Beam Topographs
By M. PILARD, Y. EPELBOIN AND A. SOYER
Laboratoire de MinOralogie-Cristallographie, UA 009 C N R S , case 115, UniversitOs P. et M. Curie et D. Diderot, 4 place Jussieu, 75252 Paris C E D E X 05, France
(Received 13 June 1994; accepted 27 September 1994)
Abstract
Numerical image treatment has been used for the enhancement and the analysis of synchrotron white-beam topographs. Images are recorded either during the experiment by means of an X-ray-sensitive camera or after the experiment from photographic films. Filters are designed to avoid artefacts such as the Gibbs effect. Filtering has been applied to the study of the propagation of surface acoustic waves in piezoelectric materials and ferromagnetic domains in Fe-Si crystals, illustrating the interest of Fourier filtering for a deep analysis of X-ray topographs.
1. Introduction
X-ray topography allows the characterization of defects because crystal distortions modify the propagation of X-rays in materials (Kato, 1963). The analysis of a topograph is often difficult since many intricate features appear in a single image. The topographs often present wide black or white areas where it is difficult to observe details: small variations of contrast in areas corresponding to very high or very low densities of greys are quite invisible. The best visibility is achieved for mean greys only. Imaging systems have the same limitations (Tanner & Cringean, 1987). The rather low dynamics of the television monitor and the camera resolution lessen the visual quality of the image. A large part of the information is not accessible by means of visual analysis and is simply lost most of the time. To perform a deeper and richer analysis of the topograph, it is advisable to use numerical image treatment.
Many papers have been written on image treatment, covering a large variety of problems, such as image reconstruction from an incomplete measured data set (Mohammad-Djahfari & Demoment, 1988), image restoration after instrumental deterioration (Gonzales & Wintz, 1977) and image enhancement and analysis (Coster & Chermant, 1985). Castleman (1977), Saxton (1978) and Bijaoui (1981) present general reviews of the problems and the possible solutions. In this paper, we limit ourselves to X-ray topograph enhancement using Fourier filtering. This (c) 1995 International Union of Crystallography
P r i n t e d in G r e a t B r i t a i n - all r i g h t s r e s e r v e d
method has been used by, among others, Saxton (1986) and Buseck, Epelboin & Rimsky (1988) to improve the quality of high-resolution transmission electron microscopy.
X-ray topography presents a large variety of images and it is necessary to use different classes of filters to extract information of interest. Experience shows that it is often useful to apply successively different filters to study all the information in one single image. In this paper, we explain the use and the significance of different classes of filters, enlightening the problem of hard-edged filters. We suggest an optimum shape for the filter (Tournarie, 1958), which introduces fewer artefacts than any other classical filter.
Various X-ray topographs have been processed, illustrating the great variety and the interest of the possible treatments. Of these, background correction, feature enhancement and image decomposition provide essential tools for many studies based on topographic experiments, from piezoelectric resona- tors to ferromagnetic domains.
2. Principles of Fourier filtering 2.1. Basic principles
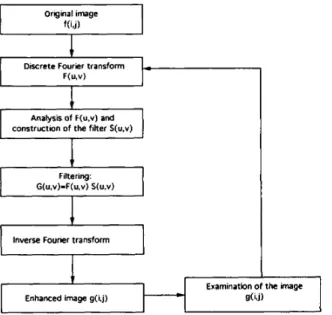
The principle of Fourier filtering (Max, 1985) is summarized in Fig. 1. Capital letters denote functions in Fourier space with u and v as frequential variables, while lower-case letters denote functions in direct space with i and j as spatial variables. These variables i, j, u and v take integer values between 0 and N - 1, since digitized images are spatially sampled with N samples along each row and column of the image.
Fourier filtering consists of the convolution of the original image f ( i , j) with a function s(i, j), described later, that represents the point-spread function (PSF) of a frequential filter S(u, v). The filtered image 9(i, j) is then defined as
g(i, j) = f ( i , j) • s(i, j) = f ( k , l)s(k - i, l - j),
O < _ k , l < _ N - I
(l)
where • denotes the convolution product.Journal of Applied Crystallography ISSN 0021-8898 © 1995
In Fourier space, (1) becomes
G(u, v) = F(u, v)S(u, v).
Thus, Fourier filtering may be processed either in Fourier space using Fourier transforms and multi- plication or in direct space using the direct convolution product. This last method is never used because it requires much more elementary operations than the calculation of a Fourier transform (Andrews, 1970) with an efficient algorithm (Cooley & Tuckey, 1965). Furthermore, working in Fourier space allows a more accurate analysis of the treatment to be applied. The visualization of the Fourier transform of an image often reveals important features invisible in the original image in direct space. One may rapidly build a filter
S(u, v)
taking into account all the characteristics of the image, which is impossible to do in direct space using s(i, j).In some cases, the direct convolution product is used in a modified form when the processed value of each pixel depends only on the neighbouring pixels (Bijaoui, 1981). The PSF
s(i, j)
reduces to a small n x n matrix(mkt),
typically with n = 3. The small matrix (mkz) represents the PSF of a filters(i, j)
defined bys(i--[(n--l)/2],j--[(n-1)/2])=mi~
forO < i , j < n ,
s(i,
j) = 0 elsewhere. Most of the time, such matrices are used to compute the gradient or the Laplacian of an image for edge detection or for pixel averaging. Such local treatments do not allow a great variety of filtering because only high spatial frequencies are modified. Fourier transformation is a much better tool for accurate filtering.I original image
f(i,j)
I
Discrete Fourier transform F(u,v)
I Analysis of F(u.v) and
construction of the filter S(u,v)
]
Filtering:
I
G(u,v)-F(u,v) S(u,v)
1
I ,nve. oo.r.r ns' m 1
I
_
] Examination of the imageEnhanced image gO,j)
I
-1
g(i,j)Fig. 1. The principle of Fourier filtering.
2.2.
Construction of filters
(2) 2.2.1.
Preliminary conditions.
Filters used for image enhancement must first satisfy two important conditions.(a) S(u, v)
must be real, which means thatS*(u, v) = S(u, v),
(3)where S* denotes the complex conjugate of S. The application of a complex filter changes the phases of each frequential component of the image. It induces distortions in the processed image. For example, the Fourier transform of a f-function-like feature at the location Xo is
T F [ f ( x -- Xo)](u) = exp (--i2nUXo).
The phase of the Fourier transform is directly linked to the position of the 6 function. Thus, modifying this phase changes the location of the feature. It is important to point out that the structure of an image is much more sensitive to a change in the phases in Fourier space than to a change in the modulus. A simple experiment illustrates this well. Let us consider two imagesfl(i, j) (Fig. 2a) andf2(i, j) (Fig. 2b) that do not resemble each other. Their Fourier transforms may be written as
Vl(u, v) = IVl(u,
v)l exp[kol(u,
v)],where ~ot(u, v) is the phase of
Ft(u, v),
andF2(u, v)=
IF2(u,
v)J exp [i~02(u, v)], where q~2(u, v) is the phase ofF2(u, v).
We may build two new images f~' and f~ defined byTF[fl'](u, v ) =
V'l(u, v)= Irl(u,
v)l exp [iq~2(u, v)] andTF[f~](u, v ) =
F'2(u,
v) = IF2(u, v)f exp[iq~l(u,
v)], where T F denotes the Fourier transform of a function. We have exchanged the phases of the images. The resulting image f~' (Fig. 2d) looks much more like the original image fz than f l , and f~ (Fig. 2c) resembles f l . This little experiment shows that more information is contained in the phase than in the modulus of the Fourier transform, which is one of the major difficulties in crystallographic structure determina- tion. Thus, one must use frequential filters whose phase is null everywhere.(b) The filter must be centrosymmetric. A digitized image
f(i, j)
is a set of real numbers representing intensities. Hence, the filtered image9(i, j)
must be real to keep its physical meaning. In the Fourier space, this means thatF ( - u , - v ) = F*(u, v)
(4) I andM. PILARD, Y. EPELBOIN AND A. SOYER 281 S u b s t i t u t i n g (2) i n t o (5), one o b t a i n s
S ( - u, - v)F(-
u, - v) = S*(u,v)F*(u, v),
(4) imp l i e s
S ( - u , -v)V*(u,
v) = S*(u,v)F*(u, v)
and, finally,
S ( - u, - v) = S*(u, v). (6) T hus , the filter
S(u, v)
m u s t be c e n t r o s y m m e t r i c . C o n d i t i o n s (3) a n d (6) i m p l y t h a t the filter m u s t satisfyS ( - u, - v) = S(u, v).
(7)
S o m e c o m m e r c i a l filtering p r o g r a m s d o n o t strictly follow this rule.
2.2.2. The
ideal filter.
T h e use of a filter in F o u r i e r space consists of the selection of p a r t i c u l a r frequencies a n d the r e m o v a l of others. F o r instance, the s i m p l e s t lo w -p a ss filter m a y be defined by2
S(u,
v) = 1 if U 2 AV /)2 < UcS(u,
v) = 0 elsewhere, w h e r e uc is the f r e q u e n c y cut-off.Th i s is k n o w n in signal t r e a t m e n t as the ideal filter. T h e a b r u p t t r a n s i t i o n at the f r e q u e n c y u~ allows a very precise selection of the frequencies. H o w e v e r , use of a filter with such a t r a n s i t i o n i n t r o d u c e s artefacts in the processed image.
T h e p o i n t - s p r e a d f u n c t i o n of this filter
S(u, v)
iss(i,
j) = sin(rcruc)/rcruc
w i t h r = (i2 + j2)1/2.(a) (b)
(c) (d)
Fig. 2. Illustration of the importance of phases in Fourier space. (a) Digitized image of the galaxy M51. (b) Schematic representation of a molecule. (c) Image obtained by selection of the phase of image (a) and the modulus of image (b) in Fourier space. (d) Image obtained by selection of the phase of image (b) and the modulus of image (a) in Fourier space.
s(i,j) is m a x i m u m at the origin and presents oscillations of non-negligible amplitude, spreading over a long distance far from the origin. These oscillations m a y be c o m p a r e d with the optical diffraction of a point source by a hole and are k n o w n as G i b b s p h e n o m e n a (Bijaoui, 1981). Since each pixel is convoluted by the P S F s(i,j), oscillations a p p e a r near each rapid variation of intensity in an image. If two rapid variations exist near each other, such as two close dislocation lines or small defects, they interact and corrupt the contrast and, thus, the shape of the detail in the filtered image. This completely blurs the information.
2.3. Required properties lbr.filters
We now introduce some constraints on the shape of the filter edge to m i n i m i z e the G i b b s artefacts. For simplicity, equations are written for functions of one variable i only; extension to the two-dimensional case is straightforward.
M a t h e m a t i c a l study of the difference between a function f(i) and the filtered function f ( i ) . s(i), where
s(i) is the P S F of the filter S(u), shows that one minimizes the spreading and the a m p l i t u d e of the artefacts by choosing S(u) so as to satisfy the following constraints (Arsac, 1961).
(a) The regularity of S(u) is the best possible. This m e a n s that s(i) decreases rapidly far from the origin: the amplitudes of artefacts due to a discontinuity of
f(i) are m i n i m i z e d far from the discontinuity. (h) The m a x i m u m n u m b e r of m o m e n t s of s(i) must be null. Let us call M k = ~ s(i)i k di = 0 the m o m e n t of order k of s(i). O n e must have
M k = 0 for 0 _< k < n,
with n as large as possible. This condition is equivalent to
dk[S(O)]/du k = 0 for 0 < k < n,
with S = T F [ s ] . This condition is a u t o m a t i c a l l y fulfilled for k odd if s(i) is an even function. It has no direct interpretation and appears from analytic cal- culations (Arsac, 1961) to m i n i m i z e If(i) - f(i) • s(i) l. (c) S(u) must have a finite support. C o m p u t e r calculations are carried out for a finite set of data. This condition eliminates, in some cases, G a u s s i a n edged filters, defined by
S(u) = exp ( - uZ),
since one has to cut off the unlimited extension of this function, introducing a discontinuity and, hence, artefacts. This is explained in the next section where various filter shapes are compared.
There is no absolute criterion to build the best filter. O n e has to test various solutions and choose afortiori
the adequate one. A particular shape for S(u) m a y be
retained if the oscillations a r o u n d the central peak are of small a m p l i t u d e and vanish rapidly.
2.4. Tournarie.filter
The filter shape we have chosen in our treatments was introduced by T o u r n a r i e (1958) for the correction of i n s t r u m e n t a l distortion in X-ray spectrum measure- ments. This filter S(u) m a y be defined by
with
S(u) = lim Co(u) * Cl(u) * Ca(u) * . . . * C,(u),
for n = 0, for n = 1,
Ci(u)= 2 i f o r u e [ - I / 2 i ÷1, 1/2 i+1], Ci(u) = 0 elsewhere.
To study the properties of S(u), we introduce S,(u), defined as
S.(u) = Co(u) * C l ( u ) * . . . * C.(u).
The support of S, is defined as [ - a , , a , ] : a o = 1/2;
al = 1/2 + 1/4;
k
f o r n = k , a k = ~ (1/2/+1 ) = 1 - 1/2 k*l
i = O
Thus, lim.__, + ~a, = 1.
S(u) has a limited support: we can build a filter using this function without any a r b i t r a r y cut off of its extension. Ci(u) is easily differentiated:
dC,(u)/du = - 2'6[u - ( 1 / 2 i* ')] + 2'6[u + (1/2 `4 ')], where 6(u) is the Dirac function. Thus,
d"s,(u)/du" = [6(u + ½) - 6(u - ~)] • 2[c5(u + I) - , ~ ( u - I ) ] * . . . * 2 " - '
x {6[u +(1/2")] - 6 E u - (1/2")]} * C,(u).
Hence, d"s,(u)/du" is a step function, constant along each interval [2k-1/2"+1; 2*+ '/2"+1], with k = - 2 " , - 2 " - 1 .. . . . 0 . . . 2". Thus, dkS,(O)/du k = 0
f o r 0 < k < n .
The condition for the m o m e n t s of s is satisfied to the order n. The regularity of S, increases as n. The function S(u) is represented in Fig. 3(a) and its P S F
s(i) is represented in Fig. 3(b).
S(u) is defined as the limit of S,, n ~ + oc. For n high enough, S, is a very good a p p r o x i m a t i o n of S(u).
The calculus of S, is straightforward from (8): it consists of n successive c o n v o l u t i o n products of the window functions Ci.
To build a t w o - d i m e n s i o n a l filter, we calculate first the model of transition S,, with n = 12, s a m p l e d on 4096 points. This is done once and the time needed is
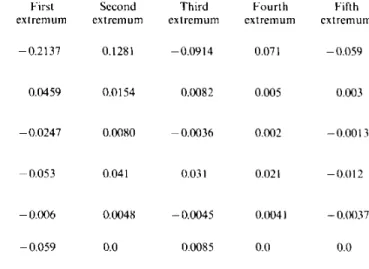
M. P I L A R D , Y. E P E L B O I N A N D A. S O Y E R 283 Table 1.
Comparison of several classical filters
T h e table gives the amplitudes of the s e c o n d a r y e x t r e m a of s(i) for various filters. In each case, the filter S(u) is sampled on 1024 points on [ - !, 1]. Its s u p p o r t is [ - 1/2, 1/2] and its frequency cut-off is defined so that S(1/4) = 1/2 except in the case of the G a u s s i a n filter, where the infinite s u p p o r t is limited for numerical processing: the s u p p o r t of $4 is [ - 1 / 2 , i / 2 ] the s u p p o r t of $3 is [ - 3 / 4 , 3/4].
First Second T h i r d F o u r t h Fifth e x t r e m u m e x t r e m u m e x t r e m u m e x t r e m u m e x t r e m u m ideal filter Sl(u) = ~fl if[uL < 1/4 - 0 . 2 1 3 7 0.1281 - 0 . 0 9 1 4 0.071 - 0 . 0 5 9
(0 elsewhere
Fejer filter S2(u) = I I - ` u ' iflul < 1/2 0.0459 0.0154 0.0082 0.005 0.003
to elsewhere
{;+cos(4nu) iflu[<l/2
H a n n i n g filter S3(u) = - 0.0247 0.0080 - 0.0036 0,002 - 0.0013 elsewhere
Gaussian filter S.du) = ~ f e x p - (u2) iflu. < 1/2 - 0.053 0.041 0.031 0.021 - 0.012
(o elsewhere
Large G a u s s i a n filter S du) = 5re xp - (u2) if [ u 1 < 3 / 4 _ 0.006 0.0048 _ 0.0045 0.0041 _ 0.(x)37
to elsewhere
T o u r n a r i e filter S6(u) = Co(u) *... * C,(u), n = 12 - 0.059 0.0 0.0085 0.0 0.0
1 . 2 . . . 1F~_ T . 0 . 8 ! 0-6 f
0"4 I
0.2°I
- 0 . 2 l , , , -1 -i I ~_ , , _ 1 J -0.6 -0.2 0.2 0.6 1 (a) 1.2F
'I
0.8 f 0-6 f 0-4 i 0-2 f° L
t . . . . J . . . . t - r , , , t , . ' " r , t ' ' " r 7 . . . . - 0 . 2 t - - - i . . . . , . . . . i . . . . i . . . . , . . . . i , , _ . q -0.2 -0.15 -0.1 -0.05 0 0.05 0.1 0.15 0.2 (b)Fig. 3. (a) T o u r n a r i e function S,(u) for n = 12 as used for the edge of the filters. (b) F o u r i e r t r a n s f o r m of S,(u): the m o d u l u s of the s e c o n d a r y e x t r e m a decreases faster than any o t h e r numerical filter; the first s e c o n d a r y e x t r e m u m is only 5.9% of the m a x i m u m value at the origin, and b e y o n d the third e x t r e m u m there are no m o r e significant oscillations.
negligible. The whole profile of the filter is build with the wanted frequency cut-off taken into account. Then, the two-dimensional filter is generated using this profile.
Different models of filters and their PSFs are compared in Table 1. A filter is characterized by two antagonistic properties. The width of its edges must be as narrow as possible to allow efficient frequential selectivity. The oscillations of its PSF must be of small amplitude and decrease rapidly far from the origin to introduce a minimum amount of artefacts. All the filters compared in Table 1, except Ss, have the same frequential selectivity
(i.e.
the same support width [ - 1 / 2 , 1/2]). Table 1 shows that the ideal filter S~ must absolutely be avoided because the oscillations of its PSF are much higher than for any other filter and decrease too slowly. Other filters' PSFs have a first secondary extremum of the same order but the Tournarie-filter PSF presents only two oscillations while other PSFs, for the same support width, spread over a large distance and decrease slowly.We also give in Table 1 the results for a wide Gaussian filter $5, of which the support is [ - 3/4, 3/4]. With such a support, the Gaussian filter PSF presents oscillations of much smaller amplitude than any other filter, but its frequential selectivity is poor. To perform Fourier filtering, the Tournarie filter is a good compromise to achieve simultaneously a high frequential selectivity and few and well located oscillations in the PSF.
2.5.
Classes of filters
Since the Fourier transform of an image may present a large variety of features, it might be
necessary to design sophisticated shapes for the filters to select frequencies of particular interest. Experience shows that, in most cases, simple shapes, or associations of simple shapes, provide good results. We have chosen to use elliptical filters (Buseck et al.,
1988) with smooth edges using the Tournarie function. One may divide them into three classes:
(i) Circular filters centred at the origin in Fourier space. Their symmetry allows an isotropic filtering, i.e.
all directions of the image are filtered with the same band pass. One may create low-pass, high-pass or band-pass filters.
(ii) Elliptical filters centred at the origin. The ,study of a particular direction in the image may be performed using such anisotropic filters. Variation of the eccentricity of the filter allows different acuity in the selection of the direction.
(iii) Circular or elliptical filters centred anywhere in Fourier space are used to isolate or suppress peaks in Fourier space and to perform anisotropic filtering. These filters are called polar filters. They must obey (7).
Using these basic shapes, one may design adequate filters for most applications.
characterized by more rapid variations of the intensities and correspond to higher frequencies. Thus, one may remove the background and keep only the interesting features by applying a frequential low-cut filter. Experience shows that in most cases a cut-off value of the order of 5% of the maximal spatial frequency is sufficient to remove the background and to enhance the visibility of the underlying details. There is no general criterion to choose this cut-off and in particular cases one may have to test various values. Suppressing low frequencies in an image modifies its mean value, but the relative variations of intensities are not changed. Thus, the processed image is still comparable to the original one and to display this it is only necessary to renormalize it.
3. X-ray topograph enhancement
3.1. Experimental set-up
The topographs were recorded at L U R E / D C I by B. Capelle, J. Detaint and A. Zarka and at the ESRF by J. Baruchel and F. Zontone.
The Laue pattern is recorded on films or using an X-ray-sensitive television camera (Sofretec CV154NV), connected to a digitizer (Matrox IP8 card) plugged in to an IBM-compatible personal microcomputer. The digitized topograph contains 512 x 512 pixels, each one encoded in eight bits. Each pixel f(i, j) of the digitized image has a positive value representing an intensity. For topographs recorded on films, the image is digitized after the experiment using a C C D camera and the same digitizer.
The digitized images are then transferred to a more powerful computer for the Fourier filtering, using interactive software developed in the laboratory. Its various possibilities will be presented in another paper.
3.2. Background correction
In many cases, X-ray topographs present a highly contrasted background that masks most of the small details. Large areas of the topograph are either completely black or completely white.
The Fourier transform allows one to separate the background from the interesting contrast because the background is characterized by slow variations and is thus located in the very low frequency domain in Fourier space. Most of the other features are
(a)
(b)
Fig. 4. 200 Laue topograph of a 1.4 ram-thick Fe-3%Si crystal. The oblique lines correspond to the magnetic domain contrast. (a) Original digitized topograph: the high-contrast background masks the magnetic domain contrast in several crystal subgrains. (b) Processed topograph with background correction: the low-pass filter enhances the visibility of the magnetic domain contrast in all parts of the topograph.
M. P I L A R D , Y. E P E L B O I N A N D A. SOYER 285 The topograph presented in Fig. 4(a) illustrates the
problem of highly contrasted background. The topograph corresponds to a 200 reflection of a silicon-iron crystal (Baruchel, Epelboin, Gastaldi, Hartwig, Kulda, Rejmankova, Schlenker & Zontone, 1994), in which one sees crystal subgrains that appear as large areas of either black or white. The contrast arises from the orientation of each subgrain and masks the defects and the magnetic domains, which appear as oblique fringes. To enhance the visibility of these features, one applies a circular low-cut filter to remove the background, as previously explained. The applied filter has a frequency cut-off of 15 pixels in Fourier space, while the maximum frequency calcu- lated in the Fourier transform is located at 256 pixels from the origin: the cut-off represents 5.8% of the maximum frequency. The result is presented in Fig. 4(b). With such filtering, it is now possible to study precisely in which subgrains the magnetic domain contrast appears.
One may, therefore, notice that, in some areas, especially in the left side of the processed image, no details appear despite the background correction. The original photographic film has been completely saturated during exposure. The information is definitely lost. One may notice that the Fourier filtering applied on the original topograph did not introduce 'false information', as many people often fear.
3.3. Study of surface acoustic wave devices
Fig. 5(a) is a stroboscopic topograph of a surface acoustic wave (SAW) device used as a filter or delay line (Zarka, Capelle, Detaint & Schwartzel, 1988; Detaint & Schwartzel, 1994). A periodic electrical signal is applied on the surface of the piezoelectric crystal through an input electrode (lower right side of Fig. 5a). This induces an acoustic wave propagating along the surface under a multistrip coupler (black area in Fig. 5(a). An output electrode (upper left side of Fig. 5(a) converts the acoustic signal back into an electrical one.
In the original digitized topograph (Fig. 5a), the contrast due to the acoustic wave does not appear clearly. This contrast, mainly in the black area, is too low to be visible, but the film is sensitive enough to keep this information. The aim of the Fourier filtering is to reveal this 'hidden' information.
Fig. 5(c) is the Fourier transform of Fig. 5(a). Only half the dual space has been represented since it is centrosymmetric. The main peak at the origin corresponds to the integral of the intensities in the original image. Suppression of low frequencies, around this peak, removes the high-contrast back- ground (Fig. 5b), as explained in §3.2. The contrast due to the surface acoustic wave becomes visible now but is still very low.
The analysis of the Fourier transform (Fig. 5c) of the original topograph helps in the search for more efficient filtering. One may clearly see a cluster of high Fourier components at the centre of the Fourier transform. These frequencies correspond to the surface acoustic wave contrast. In a perfect SAW device, this cluster would reduce to a single peak corresponding to a unique frequency and direction of the surface acoustic wave. Here, the cluster spreads over many frequencies, showing that this SAW device introduces a dispersion of the direction and the period of the acoustic wave. Since Fourier transformation preserves the angular properties, it is easy to calculate precisely the angular divergence of the waves. One measures in Fig. 5(c) an angular divergence of about + 2 0 ° around the main direction of the propagation of the wave, and a frequency dispersion of about
+ 7 % .
To enhance the visibility of the contrast arising from the acoustic waves, one isolates this cluster of frequencies, using an elliptical filter centred on it; then, the values of all selected data are multiplied by 3 and one computes the inverse Fourier transform. Super- imposing the new image on the original one (Fig. 5d) now makes clearly visible the acoustic wave inside the multistrip coupler. This image treatment improves the contrast due to the surface acoustic wave by a factor of 3, while other contrasts are not modified. This is a qualitative enhancement that allows the study of the shape of the SAW. However, the processed contrast has no quantitative meaning.
3.4. Enhancement o f dislocation contrast
Fig. 6(a) represents the digitized topograph of a quartz crystal in a bulk acoustic wave device (BAW). Such a device is based on the same principle as SAW devices but the input and output electrodes are on opposite faces of the crystal, inducing an acoustic wave inside the crystal (Zarka et al., 1988).
The aim of the treatment is to enhance the visibility of the dislocation contrast, which appears as black vertical lines.
First we apply a low-cut filter, with a 5% cut-off, to remove the background of the image, especially the two large black spots due to the acoustic vibration mode.
The Fourier transform (Fig. 6b) of the topograph presents two slightly inclined lines of high Fourier components. These lines correspond to the dislocation contrast. The building of the filter to enhance this contrast is thus straightforward: the filter must retain only this information. As in the previous example (§3.3), we multiply the result by 3 and super- impose it on the original topograph (Fig. 6c). In the processed image, it is now easy to characterize the dislocations.
T h e s e t r e a t m e n t s d e m o n s t r a t e the efficiency of F o u r i e r filtering in r e v e a l i n g m o r e i n f o r m a t i o n t h a n is visible in the o r i g i n a l t o p o g r a p h .
4. Concluding remarks
F o u r i e r filtering offers a great v a r i e t y o f i m a g e t r e a t m e n t s .
B a c k g r o u n d c o r r e c t i o n w i t h l o w - c u t filters is a very g e n e r a l m e t h o d to e n h a n c e the visibility of details m a s k e d by a h i g h - c o n t r a s t b a c k g r o u n d . T h e c u t - o f f
of the filter s e l d o m d e p e n d s o n the i m a g e a n d m a y be set a priori to 5 % of the m a x i m a l f r e q u e n c y of the i m a g e a n d the t r e a t m e n t p e r f o r m e d a u t o m a t i c a l l y . It is v e r y efficient for s y n c h r o t r o n - t o p o g r a p h e n h a n c e - m e n t , especially for r e v e a l i n g l o w - c o n t r a s t defects in crystals w i t h large d i s t o r t i o n s .
P o l a r filters are of g r e a t interest for the i s o l a t i o n of p a r t i c u l a r features in a n i m a g e a n d the s t u d y of t h e m s e p a r a t e l y . X - r a y t o p o g r a p h s often p r e s e n t m a n y i n t r i c a t e features t h a t m a y be s e p a r a t e d by F o u r i e r t r a n s f o r m a t i o n . T h e use of n a r r o w filters is r e q u i r e d (a) (b) (c) (d)
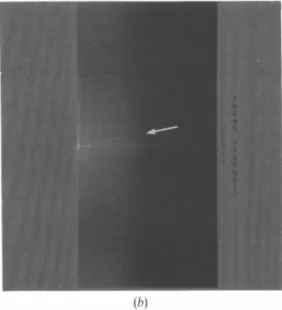
Fig. 5. Stroboscopic topograph of a lithium niobate crystal in a SAW device; The crystal is under excitation. The image was first recorded on film during the experiment and then digitized for numerical processing. (a) Original topograph: the black area corresponds to the wave guide. This strong contrast, due to crystal distortion, fully masks the surface acoustic wave contrast. (b) Processed topograph with background correction: the acoustic wave propagating under the wave guide becomes more visible. (c) Fourier transform of the original topograph; only half of the dual space has been represented since it is centrosymmetric. The origin is at the middle of the left edge. The arrow indicates the cluster of high frequencies corresponding to the acoustic wave contrast. (d) Enhanced topograph using an elliptical filter. The values of the data corresponding to the cluster of high frequencies have been multiplied by 3, while all the other Fourier components are unchanged. The propagating waves are clearly visible under the wave guide. One can see the energy dissipation outside the wave guide.
M. PILARD, Y. E P E L B O I N A N D A. SOYER 287 for such treatments. The extension of Gaussian filters
is too large for selective filtering. Thus, the Tournarie function is a good solution for building the narrow filters necessary to select precisely the frequential information.
Performance of these treatments requires first a deep analysis of the Fourier transform. Its visualiza- tion reveals important information about the structure of the image. Furthermore, it often suggests directly the best filter shape to be applied. It might be necessary to apply independently different filters to study various features in the same image.
The filtering program XTRN, developed in our laboratory, is available from the authors. It runs on various Unix workstations using X-Window and OSF/Motif. Its main characteristics will be discussed in another paper. X T R N has been tested on an IBM
RS6000/560, on a Hewlett-Packard 715, on a Silicon Graphics Indigo XZ and an IBM-compatible PC 486 66 M H z with Linux operating system. The processing time to filter an image with 512 x 512 pixels is about 5 s for the IBM RS6000 (in multiple-user working conditions) and for the HP715 as single user. About 10s are needed by the P C 4 8 6 6 6 M H z . This processing time includes two Fourier transforms, the construction of the frequential filter and its appli- cation to the image. Experience shows that the processing time is negligible compared with the time required for the analysis of the image and the definition of the filter to be applied.
Image treatment based on Fourier transformation is a very efficient tool to obtain more information from a topograph. It may be applied recursively to a single image to achieve a deeper analysis of the topograph.
(a)
(c)
(b)
Fig. 6. Stroboscopic topograph of an excited langasite crystal in a BAW device. (a) Original topograph: the vibration mode contrast (the two large black areas) masks the dislocation contrasts. (b) Fourier transform of Fig. 5(a): the arrow indicates slightly inclined lines corresponding to the dislocation contrast. (c) Enhanced topograph: the dislocation contrast is enhanced by a factor of 3, while the vibration-mode contrast has been removed using background correction.
Other mathematical transforms, such as wavelet analysis, may provide complementary means for the analysis and the enhancement of synchrotron topographs. They are under investigation.
The authors thank B. Capelle, J. Detaint, A. Zarka, J. Schwartzel, J. Baruchel and F. Zontone for the topographic experiments and D. Cochet-Muchy (Crismatec) for the provision of langasite crystals. They also thank F. Morris for his kind help in both the mathematics and the software building.
References
ANDREWS, H. C. (1970). Computer Techniques in Image
Processing. New York: Academic Press.
ARSAC, J. (1961). TransJbrmation de Fourier et Thkorie des
Distributions, pp. 250-285. Paris: Dunod.
BARUCHEI,, J., EPELBOIN, Y., GASTALDI, J., HARTWlG, J., KULDA, J., REJMANKOVA, P., SCHLENKER, M. & ZONTONE, F. (1994). Phys. Status Solidi A, 141, 59.
BUAOUI, A. (1981). Image et Information. Paris: Masson. BUSECK, P. R., EPELBOIN, Y. & RIMSKY, A. (1988). Acta Cryst.
A44, 975-986.
CASTLEMAN, K. R. (1977). Images and Digital Processing.
Digital Image Processing, pp. 3-13. Englewood Cliffs:
Prentice-Hall.
COOLEY, J. W. 8L TUCKEY, J. W. (1965). Math. Comput. 19, 297-301.
COSTER, M. t~ CHERMANT, J. L. (1985). Precis d'Analyse
d'lmages. Paris: CNRS.
DETAINT, J. t~ SCHWARTZEL, J. (1994). J. Phys. (Paris), 4, 93-106.
GONZALES, R. C. • W1NTZ, P. (1977). Digital Image
Processing. Reading, MA: Addison-Wesley.
KATO, N. (1963). J. Phys. Soc. Jpn, 18, 775.
MAX, J. (1985). M~thodes et Techniques de Traitement du
Signal, Vol. 1, pp. 61-69. Paris: Masson.
MOHAMMAD-DJAHEARI, A. & DEMOMENT, G. (1988).
Maximum Entropy and Bayesian Methods in Science and Engineering, Vol. 2, pp. 341-355.
SAXTON, W. O. (1978). Image Formation Theory, Computer
Techniques for Image Processing in Electron Microscopy,
pp. 1-33. New York: Academic Press.
SAXrON, W. O. (1986). 44th Annu. Proc. Electron Microsc.
Soc. Am. pp. 526-529.
TANNER, B. K. 8/. CRINGEAN, J. K. (1987). Prog. Cryst. Growth
Charact. 14, 403-424.
TOURNARIE, M. (1958). Bull. Soc. Fr. Min&al Cristallogr. 81, 278-286.
ZARKA, A., CAPELLE, B., DETAINT, J. 8z SCHWARTZEI., J. (1988).