The Carbon Climax:
End of HydroCarbon Legacy
A Decade of Metamorphosis
and Rapid Change
The Carbon Climax:
End of HydroCarbon Legacy
A Decade of Metamorphosis
and Rapid Change
Mihir Mathur
rbon Climax:
The Carbon Climax
End of HydroCarbo
A Decade of Metam
and Rapid Change
HydroCarbon Legacy
ade of Metamorphosis
pid Change
The Carbon Climax:
End of HydroCarbon Legacy
A Decade of Metamorphosis and
Rapid Change
for Management and Leadership Development (SCMLD) Pune, and is currently working with WOTR as Sr. Research Analyst in Climate Change Adaptation project.
His areas of interest are Systems Thinking, System Dynamics, Energy and Local Economics. On weekends he teaches Systems Thinking and Water Management to post graduate students at SCMLD, Pune. He has previously worked in retail banking, stock markets and commodity markets.
Photo Courtesy: Mr. Ravinder Kumar Mathur
Creative Commons License.
The Carbon Climax: End of HydroCarbon Legacy – A Decade of Metamorphosis and Rapid Change by Watershed Organisation Trust is licensed under a Creative Commons Attribution 3.0 Unported License
Reader’s Comment and Feedback
We invite you to share your comments, thoughts and reflections, as this will help us improve our collective understanding. Do respond at <[email protected]>. Thank you and looking forward to your valuable suggestions.
Key Words: Peak Oil, Adaptation, Globalization, Energy, Economics, Climate Change.
Published by:
Watershed Organisation Trust (WOTR)
„The Forum‟, 2nd Floor, S.No. 63/2B,
Padmavati Corner, Pune Satara Road, Parvati, Pune 411009, India. Phone: +91-20-24226211 Fax: +91-241-2451134 Email: [email protected] Website: www.wotr.org ISBN: 978-81-86748-20-6 Printed by: Mudra, 383, Narayan Peth, Pune 411030. Email: [email protected]
Contents
Foreword ... 5 Acknowledgements ... 7 Carbon Catastrophe ... 9 Carbon Salvo ... 12 Buried Sunshine ... 13Unearthing Buried Sunshine ... 15
Oil Exploration Dynamics ... 16
World Oil Discoveries ... 17
World’s Giant Oil Fields ... 19
Ghawar: The King of Super Giants ... 21
End of HydroCarbon Legacy ... 21
Indian Peak Oil ... 23
Carbon Climax ... 25
The Road Ahead ... 27
Post Carbon Dawn: Cuba Peak Oil ...… 28
Foreword
While unbridled use of fossil fuels has triggered climate change, the impending peak oil will make it frighteningly difficult for the world to adapt to variations in weather and other extreme events.
The monologue that follows traces the dependence of human civilization – as it stands today – on oil. It is this addiction to oil that is responsible for massive release of carbon dioxide into the atmosphere, leading to a rise in temperature and pushing the climate out of its dynamic equilibrium. The unprecedented variations in weather pose one of the biggest challenges for development. This is particularly true for the resource-poor who depend on fragile ecosystems for their livelihood.
We depend on oil not only for transportation but also for fertilizers, pesticides, cloth and energy. Oil is necessary for food security, upkeep of infrastructure, and our need for cover and shelter. Therefore assured supply of relatively inexpensive oil appears to be a precondition for adaptation to climate change.
Lurking around the corner is the phenomenon of peak-oil, which has the potential to trigger unprecedented volatility in oil prices. This could send economies around the world on a roller coaster. If the oil is priced out of reach for those who need it most, it would severely compromise our abilities to adapt to climate change.
Should oil prices get out of hand, due to reasons brought out succinctly in the following report, modern agriculture would take a big hit, for its dependence on cheap oil is much more insidious and pervasive than is ordinarily acknowledged. The food crisis that would follow peak oil would only exacerbate the impact of climate change-induced variations in weather.
Compounding the problem is the fact that while the march of climate change might take a few decades, peak oil could unleash its mischief any time now. Should that happen it would take us by complete surprise and drastically reduce our ability to adapt to climate change.
It is therefore imperative that we take a serious look at this challenge before we run out of the ancient sunshine stashed away in deep oil wells. Underplaying these challenges will only advance the date when we write our epitaph.
Sushil Bajpai
Director - WOTR
Acknowledgement
This paper is a compilation of information collected over several years. It is an outcome of the work done by dozens of people around the world, some of whom laid the foundations of this work long before I was born. This work is dedicated to them and all others whose names we don’t hear. They were either way ahead of their times, or for one reason or another, their work did not catch fancy of the mainstream.
I owe a debt of gratitude to so many:
Prof M.S. Pillai, Director of Sadhana Centre for Management and Leadership Development (SCMLD), Pune, inculcated in me the rigor during my postgraduate studies. Mr. R.S. Sharma, Chairman and Managing Director of ONGC, promptly acknowledged and responded to my thoughts on this subject.
My earlier employer provided me with an opportunity to engage myself into meaningful research and deepen my understanding. I appreciate the time taken out by Mr. Richard Heinberg, Mr. Rembrandt Koppelaar and Mr. Jeremy Leggett for exchanging thoughts and information on this complex subject.
My family, friends and colleagues provided me support and were my cheer-leaders. My friends, Mr. Rajinder Raina, Mr. Rajesh Rajak, Mr. Shashank Shekher, Ms. Kavita Bisht, Ms. Pradnya Ghag, Ms. Sonakshi Anand, Ms. Rina Rodriques, Mr. Anand Sehgal, Ms. Vandana Salvi and so many more, were my sounding board. My students at SCMLD helped me think deep by asking questions that others don’t.
The management of WOTR, Dr. Marcella D’Souza, Mr. Crispino Lobo and Mr. Sushil Bajpai provided the platform to carry out this work. Mr. Sushil Bajpai is not only my teacher and the first person to introduce me to this topic during my post graduation, but also nearly always provides a fresh twist to my arguments, showing another perspective, cracking open one window here and another
door there. Mr. Sam Jewler and Ms. Radha Kunke have been particularly patient to read and edit the paper on more than one occasion. My parents provided their loving support and encouragement. My sister Minal Chatterjee “constructively” critiqued the work.
This work is dedicated to all who came before me, and who were not aware of the issues and problems that are brewing on this planet, as well as to those who will follow me, but will not be able to do anything. Ours is perhaps the only generation who have chanced upon fore-knowledge of impending challenges, while at the same time being privileged to do something about them. This work is also dedicated to these foot soldiers who hold the key to make it or break it.
The Carbon Climax: End of
HydroCarbon Legacy
A Decade of Metamorphosis and
Rapid Change
Carbon Catastrophe
The world is headed for a catastrophic energy crunch because most of its major oil fields have passed their peak production. Our current rate of oil consumption is substantially higher than its rate of regeneration. Inevitably, the stock of oil will deplete and the production decline. Once the highest level of oil extraction is achieved, the production reaches a plateau followed by a decline – this plateau is called Peak Oil. Interestingly the highest production levels are reached around the time half the total oil from any well is pumped out. In other words, once we have consumed half of the world’s oil, the rate of production cannot be increased any further. Inevitably an irreversible decline in production would follow, creating a growing gap between demand and supply.
A first detailed assessment of more than 800 oil fields of the world, covering three quarters of world oil reserves, has found that most of the giant oil fields have already peaked and the rate of decline in oil production is now running at nearly twice the pace calculated earlier. Duroc-Danner (2009) gives an average decline rate for oil and gas today of about 6%. The International Energy Agency (IEA) came to the conclusion that the average production decline rate worldwide was 6.7% for post-peak fields (IEA, 2008).1
Oil production has already peaked in Non OPEC countries2 and with
oil prices nearly consistently clocking the $100 mark, the era of cheap oil could well be over. In most fields, oil production has now peaked, which means that other sources of supply have to be found to meet existing demand.
1 http://www.businessgreen.com/bg/news/1805964/iea-official-peak-oil-closer, 15-02-11
Even if demand remained steady, the world would have to find the equivalent of four Saudi Arabias to maintain production3, between
now and 2030. It’s a big challenge in terms of geology, investment and geopolitics. However the behavior of most governments vis-à-vis oil and energy sustainability, reflected in policies related to oil, does not inspire much confidence. If immediate and difficult decisions are not taken to get ready for a future with less oil, then we may be forced to face unprecedented hardships post peak-oil.
Environmentalists fear that as supplies of conventional oil decline, governments will be forced to exploit even dirtier alternatives, such as the massive reserves of tar sands in Alberta, Canada, which would be immensely damaging to the environment. Shell and other oil companies want to turn to tar and extract oil from coal. But these are very carbon intensive processes, which will only hasten climate change.
Jeroen van der Veer, the former chief executive of Royal Dutch Shell, acknowledged what many have long considered a foregone conclusion: the end of the oil era is almost upon us, and sooner than we might think. “Regardless of which route we choose, the world’s current predicament limits our maneuvering room and Shell
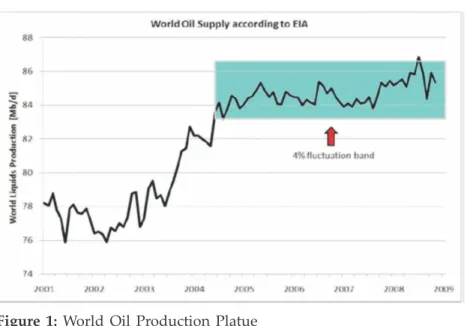
estimates that after 2015 supplies of easy-to-access oil and gas will no longer keep up with demand."4 Global oil production has been
on a plateau since 2004 because the existing old oil fields have been on decline and unconventional oil (tar sands, coal to liquids etc) filling in the gap. Also, use of technology has made it possible to marginally extract more oil from existing fields. But if we attempt to extend this plateau and not let it slide down slowly, through preparatory adaptation, then it will end with a cliff.
Judging from global production trends and information from experts, we are going to witness irreversible decline in oil production and we will witness it in this decade. The rate of decline could be anywhere between 4-8% per year. A recent analysis by Cambridge Energy Research Associates estimated that the weighted decline of production
2 ONGC Investor Presentation June 2009
3 http://www.europeanenergyreview.eu/index.php?id=793
The Carbon Climax: End of HydroCarbon Legacy 11
Figure 1: World Oil Production Platue
Source: Giant oil field decline rates and their influence on world oil
production, pg2
from all existing world oil fields was roughly 4.5% in 2006 (CERA, 2007), which is in line with the 4-6% range estimated by ExxonMobil (2004). However, Andrew Gould, CEO of Schlumberger, stated that “an accurate average decline rate is hard to estimate, but an overall figure of 8% is not an unreasonable assumption” (Schlumberger, 2005)5. During the 1970’s-80’s oil embargo a 4-5% decline in supply
lead to a 200% rise in prices6. That was a one time happening; now we
are talking about compounded 4-8% yearly decline. Prices are likely to go up exponentially due to this compounded decline in supply. Once oil availability declines, the fate of industrial societies is sealed. We would head towards blackouts, global economic contraction, declining food production and hyperinflation. Life at $300 a barrel would be very different from what we see today. The future may not necessarily look like the past. We are in for times of rapid change.
5 Giant oil field decline rates, by Micheal Hook, Robert Hirsch and Kjell
Aleklett
Carbon Salvo
We live in times of exponential growth. This growth has caused an overshoot: of population, economy and consumption. What follows an overshoot is an exponential collapse. How steep this collapse will be depends on how much we have overshot. Our present runaway success is borrowed from the past, in the form of fossil fuels, and loaned from the future, as overexploitation of resources. And we are defaulting on these loans. If we don’t repay in good time and measure, it will lead to bankruptcy, bankruptcy of our civilization. The fabric of our growth is about to tear. Accelerated growth in business, economy and population is quickly taking us towards a collapse threshold of resources that we once considered infinite.
For the past 200 years, we have been eating and living on fossil energy. It is a onetime gift, which will run dry within the lifetimes of most of us alive today. We are 200 years old in the 3.4 billion years of t h e biology of Earth. Our energy intensive industrial era may just be a blip in the course of human history7. Lester Brown says in Plan B
4.0, “Ever since civilization began, each generation has left the next, a planet similar to the one it inherited. Our generation may be the first to abandon that tradition. Failure to develop and act on foresight would reflect our insensitivity and insincerity towards future generations. It would surely be an ethical failure on our part.
Figure 2: Energy Curve of History
Source: Dr. M King Hubbert, www.lifeaftertheoilcrash.com
The Carbon Climax: End of HydroCarbon Legacy 13
Buried Sunshine
For most of history, life on earth was sustained through energy from sunlight – both directly and indirectly. All forms of life on earth eventually died and were sequestered underneath the earth’s crust. After millions of years of chemical reaction, they got transformed into fossil fuel. This massive store of fossil energy when unearthed led to a surplus stock of energy. We arrived at the industrial era, in the middle of the 18th century, when we learned how to combust oil for energy on a mass scale. The basis of our current civilization is fossil energy, specifically crude oil. This hydrocarbon reserve is exhaustible. It has an expiry date the same way a contract does. It is nothing but buried sunshine. It has converted itself into its current form after undergoing millions and billions of years of chemical reaction. Thus, we have billions of years of buried sunshine, which we are now excavating in a span of 200 years. The unabated extraction and combustion will soon be over. But not before it has caused disruptions to and altered climate cycles. Closed Systems8 are subject to degradation as a result of
their increasing Entropy9; earth, when seen as a system, is mostly a
closed one. Hence it is subject to degradation as a result of increasing entropy, mainly attributable to human activities. Burning fossil fuels and releasing the massive store of sunshine is the base structure of our industrial era. We can’t escape laws of entropy and thermodynamics. We have caused enough randomness in the atmosphere to alter the climatic cycle. Using this past glory, we have systematically stripped earth’s resources and converted them into waste. We have also managed to find ways to harness this fossil energy and convert it into food. Few realize that fossil energy has been feeding us for over a century.
When human beings lived as hunters and gatherers, 500 calories of human effort yielded 2000 calories of food produce, giving a ratio of 1:4.10 In our endeavor to leave nomadic life, we moved from a
tribal culture to the agriculture age.
8 A Closed system is a one that exchanges energy but not matter with its environment.
9 Entropy is the degree of randomness caused by the loss of heat during the
During the agriculture age, ancillary occupations like artisans, skilled workers etc., evolved and thus laid the foundation for occupations other than growing food. This resulted in a drop of human energy used to produce food, but we still managed not only to survive, but also to grow. This growth was due to the external source of surplus energy which we found in the form of fossil fuels. Today it takes close to seven calories of fossil energy to produce one calorie of food in modern industrial agriculture11; the
ratio is 7:1. We are essentially eating fossil fuels. Pre-industrial agriculture was a net producer of energy; today it is a net consumer of energy. The human population has grown exponentially in the past 200 years. We are now one hell of a consuming species.
All the borrowed energy from the past is now partially stored in the form of human beings. We use this energy to run our economy and produce gross domestic product (GDP).
Table 1: Energy Intensity of food production and goods manufacturing
Finished Product Quantity Fossil energy consumed
for production, oil equivalent
Vegetarian Food (US, 2002) 1 calorie 7 calories
Non Vegetarian Food (beef) 1 calorie 54 calories
Bottled Water 1 liters 0.25 liters
Computer 1 desktop 371 liters
Electricity 1 kwh 0.36 liters
Computer memory chip 1 chip 2.2 liters
Cement 1 kg 0.2 liters
Copper 1 kg 3.2 liters
Average US Car 1 car 3,180 liters
Source: lifeaftertheoilcrash.net, http://uclue.com/index.php?xq=724., http://www.physorg.com/news156506896.html, www.convertunits.com/ from/joule/to/gallon+[UK]+of+automotive+gasoline, www.michaelbluejay. com/veg/environment.html, http://www.beeffrompasturetoplate.org/ mythmeatproductioniswasteful.aspx#Sixteen pounds of grain, WOTR Analysis 10 Beyond Civilization by Daniel Quinn.
11 Food and farming transition by Richard Heinberg – Post Carbon Institute, pg. 2.
The Carbon Climax: End of HydroCarbon Legacy 15
GDP is the sum total of all goods and services produced in a given year. These goods and services are a derivative of natural resources, which get converted into waste at the end of a product’s life. We are using the one time gift of fossil energy to strip earth’s resources and make the biosphere unfit for human survival. Climate change and resource depletion are the outcomes of industrialization and what we call human progress. It is a kind of a progress trap12. The paradigm of
infinite growth is based on finite resources. We are heading towards an explosive collapse of resources, especially oil, and with it, a collapse of civilization as we know it.
Unearthing Buried Sunshine
Dr. M. King Hubbert
Peak Oil refers to that point in time where the Oil production reaches a maximum that is difficult or impossible to achieve again in the future. The life cycle of natural resources follow a gaussian or bell shaped distribution and thus have a peak level which may be achieved only once in their lifetime. Peak production is soon followed by a continuous decline, which becomes difficult to arrest. The theory of peak oil was first pioneered by Dr. M. King Hubbert, a geologist with Shell Oil and later with US Geological Survey. The theory in general parlance is known as Hubbert’s Peak. He conceptualized that there is a different and more fundamental cost that is independent of the monetary price, which is the energy cost of exploration and production. The amount of energy spent to find and produce more energy. It is also known as Energy Return on Energy Invested (EROEI). When the energy cost of recovering a barrel of oil becomes greater than the energy content of the oil, production will cease no matter what the monetary price may be13. He estimated that
if present trends continued, production would peak in 1995 – his predicted deadline for alternative forms of energy to compensate for the sharp petroleum sharp drop-off that follows. With the given technology advancements and current slowdown in economy, this peak production may have got delayed by another decade or so. But technology and economy cannot replace the fundamental logic behind peaking of natural resources.
12 The Progress Trap by Ronal Wright
Oil Exploration Dynamics
The genesis of Peak Oil lies in the history of oil discoveries and present trends. The production of oil from an oil well is a function of availability, affordability and accessibility. Oil fields, discovered over a period of time, vary in size and in the amount of oil that they hold. As the fields age and mature the level and pressure of oil drops and it becomes difficult to maintain production at a constant rate. As the rate of production goes down in existing fields, the need to find new fields increases. Thus, finding new oil fields is of prime importance for sustaining oil production at constant or incremental rates.
The dynamics of an oil field are complex. Someone thinking about an oil field might model it as a glass full of water, from which you can extract as much water as remains in the glass. But in the case of oil, the rate of oil extraction is heavily dependent on the amount of pressure in the reservoir of an oil field. This pressure is generated by a mix of water, gas and oil. As more oil gets extracted from the oil well the pressure reduces and the oil and water contact increases, which is a signal that the field is maturing. Also, gas collects at the top of the well in gas caps, which make it difficult to extract oil at the same rate as when the oil field was fresh and young. Once oil becomes difficult to find and extract, the cost for processing goes up, along with the cost of transportation. Thus the price of petroleum rises. As the prices of oil and its byproducts go up, the input cost for all kinds of goods and services goes up. Here we start witnessing cost-push inflation which leads to rising prices and declining purchasing power.
Once 50% of the initial oil reserves have been extracted, what remains is the oil that requires more energy to extract and process. As the pressure in the reservoir goes down,the use of artificial water and gas injection techniques is done to maintain the pressure. The water/gas injection processes are known as Enhanced Oil Recovery (EOR) and Initial Oil Recovery (IOR) techniques.
The Carbon Climax: End of HydroCarbon Legacy 17
This kind of process has been effective in some of the Giant and Super Giant oil fields, which has led to an increase in the oil recovery rates (the amount of extractable oil from an oil well). Worldwide average recovery rates for oil wells are in the range of 30-35%14. What this means is that, from an Initial Oil In Place (IOIP), of
say 100%, only 35% is available for use and the other 60-65% is left behind because it is not viable, either economically or operationally or both. This implies that close to 60% of oil ever discovered could be left behind underneath the earth’s crust, not available for human consumption.
In the best of places, like the Middle East, the recovery rate has been around 40-45%. This suggests that the best chances of recovering oil from an oil well are 45%. With the use of these EOR and IOR techniques, the recovery rate may have gone up for some fields and could be revised up to 50%. The world’s largest oil field, Ghawar in Saudi Arabia, has been able to produce close to 40 % of its IOIP and has been put under EOR and IOR techniques for decades now. India’s Mumbai high oil field has 30 % recovery rates but not before it underwent EOR and IOR phase. However, we need to keep in mind that these extraction techniques can only marginally improve the recovery factor which may not be enough if we need to maintain or increase the production rate.
World Oil Discoveries
The world discovered its first oil during the 1850’s, when Mr. Charles Drake discovered a free flowing black liquid at 59 feet beneath the earth’s crust, about 100 miles north of Pittsburgh. From 1859 to 1873, this was the largest oil field in the world with 56 million barrels of oil coming out of the ground. One hundred and fifty years hence, 56 million barrels of oil is good enough only to last us 16.8 hours at current levels of world consumption.15 The rate of Oil Discoveries
was at its peak in the 1960’s and early70’s.
14 A thousand barrels a second, pg 124, by Peter Tertzakian
15 http://www.greentechhistory.com/2009/08/gallery-the-worlds-first-oil-Field, 22-02-11
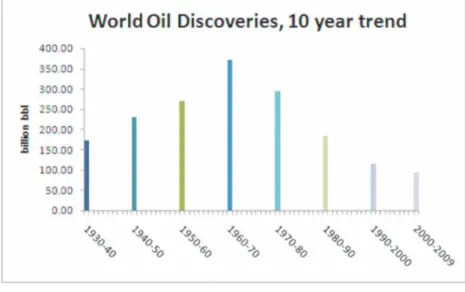
We use to discover 25 barrels for every barrel consumed. Today we discover 1 barrel for every 3-4 barrels that we consume.16 We live in
an energy deficit world, a substantial one.
Oil discoveries peaked during 1960-70. Since then we have been facing a constant decline in discoveries. At the same time, the cost of exploration has been rising. More oil rigs are being built, with use of state-of-the-art technology and massive infrastructures for drilling in areas that were earlier unheard of. As we are finding it difficult to explore oil on land, offshore exploration has picked up pace - with limited success and at least one well-known failure.
There will always be some oil lying somewhere, but it may cost us more than the benefits of putting it to daily use. It may be technically difficult, too expensive compared with other fuels, or too polluting. Events of unsuccessful drilling are on the rise, which are hampering the profitability of Oil companies and lowering their motivation to drill oil wells, at lower crude prices. Eventually, this could lead to
Figure 3: World Oil Discoveries, 10 year trend
Source: R.H.E.M. Koppelaar & WOTR Analysis
16 www.ted.com/talks/rob_hopkins_transition_to_a_world_without_oil.html, 22-02-2011
The Carbon Climax: End of HydroCarbon Legacy 19
a rise in prices, not only due to demand- supply mismatch, but in order for the oil industry to sustain drilling at such high costs of exploration.17 The size of recent oil discoveries are getting
smaller, averaging less than 9 billion barrels per discovery18, only
four months worth of world consumption. Close to 40 oil fields have been discovered in the past decade, none of them having the potential of producing more than 1 million bpd. A newly discovered oil field can take anywhere from 4-6 years before it is operationally viable for starting production. With this, any discovery is ready to meet demand only after a time lag, thus any decline in the rate of discovery needs to play a catch up game for filling up the deficit. This gap may only get filled if the size of the coming discoveries are big enough to ramp up production and has the capacity to come on board for production in a short time.
World’s Giant Oil Fields
There are currently about 70,000 oilfields in production across the world. The bulk of oil production comes from a smaller part of them, mainly from giant and super giant oil fields. Citing most of the renowned geologists and petroleum engineers (as well as common sense), we derive a theory that the largest oil fields are found first. All Giant and Super Giant oil fields of the world (except Cantarel ) were found in the early 1950’s and 60’s, after which the size of discoveries shrunk. The Middle East accounts for majority of the World’s largest oil fields and holds nearly 60% of world oil reserves. There are no universal rules for calling an oil field Giant or Super Giant, but any field with an estimated 2P (proven and probable) ultimate recoverable oil reserve in range of 500 million barrels to 5 billion barrels could be categorized as a Giant and in excess of 5 billion barrels be called a Super Giant oil field19.
17 http://news.bbc.co.uk/2/hi/science/nature/3623549.stm, 14th
Sept 2009, http://docs.google.com/gview?a=v&q=cache:ctEqm
Z6vxecJ:search.datapages.com/data/bulletns/1938- 43/images/
pg/00220001/0100/01090.pdf+number+of+dry+oil+wells+found+recentl y&hl=en&gl=in, 10-09-09
18 http://www.hubbertpeak.com/campbell/, Giant Oil Fields – The Highway to oil, by Fredrik Robelius, pg 84
The world’s largest oil fields have been pumping oil for more than 40 years; some even for 60 years, and are at a state of saturation and maturity. The 20 largest oil fields of the world produced 19.2 mbd in 2008, contributing to 25% of world oil production20. All these fields
could well be headed towards their decline phase.
The most recent of the Giant Oil fields from the table below is in Mexico, the Cantarell oil field. However, in the recent past the oil field has been facing problems and the rate of production has gone down from its peak of 2 mbpd to 0.7 mbpd.
The Burgan oil field of Kuwait is the second largest oil field of the world, second only to Saudi Arabia’s Ghawar. It commenced production in year 1946 and currently accounts for 50% of Kuwait’s oil supply. However, the field is more than 60 years old and in decline phase, with estimated current production levels of 1.2 mbpd. Considering the torture Burgan had to go through during the Iraq Kuwait war (1991), when approximately 750 wells were blown up
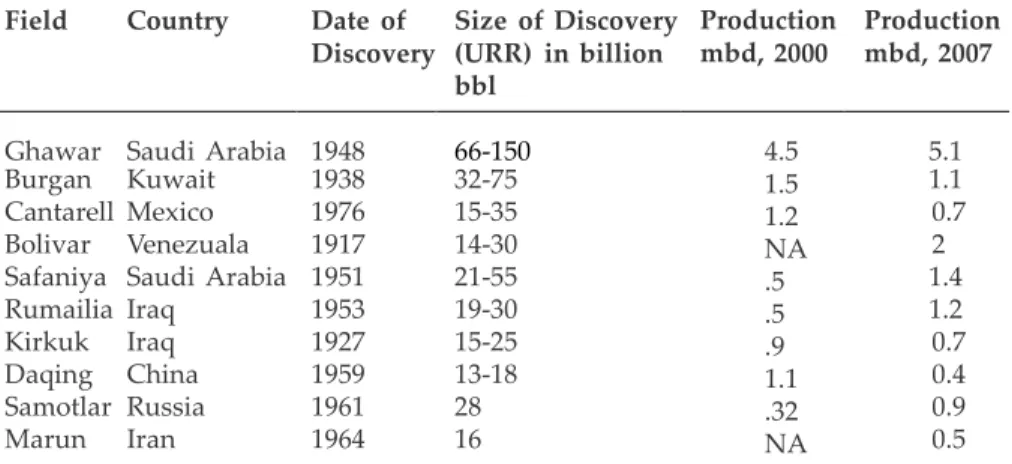
Table 2: World’s Giant Oil Fields
Field Country Date of
Discovery Size of Discovery (URR) in billion bbl Production mbd, 2000 Production mbd, 2007
Ghawar Saudi Arabia 1948 66-150 4.5 5.1
Burgan Kuwait 1938 32-75 1.5 1.1
Cantarell Mexico 1976 15-35 1.2 0.7
Bolivar Venezuala 1917 14-30 NA 2
Safaniya Saudi Arabia 1951 21-55 .5 1.4
Rumailia Iraq 1953 19-30 .5 1.2
Kirkuk Iraq 1927 15-25 .9 0.7
Daqing China 1959 13-18 1.1 0.4
Samotlar Russia 1961 28 .32 0.9
Marun Iran 1964 16 NA 0.5
Source: Twilight in Desert – Matthew Simmons, pg 373, Wikipedia, Giant Oil Fields – Highway to Oil, IEA WEO 2009,
http://www.hubbertpeak.com/mx/, WOTR analysis 20 IEA WEO 2009, pg 225
The Carbon Climax: End of HydroCarbon Legacy 21
with more than 600 burning for more than 10 months, there is little hope of incremental production from this field.21
Ghawar: The King of Super Giants
The undisputed king of all is Saudi Arabia’s Ghawar oil field. The field was discovered in 1948 and has a large anticline structure spanning over 250 kms with an estimated Ultimate Recoverable Reserves (URR) of 66-150 billion bbl. It started production in 1951 and has pumped nearly 66 billion barrels of oil over the past 58 years. Ghawar crude accounts for most of the Saudi Arab light export blend.22 There is a threat that Ghawar h a s been overexploited, as
it has depleted more than 70% of its oil. Ghawar reached peak production in year 1981 with an output of 5.5 million barrels a day. Since then, this feat has never been achieved by any other oil field in the world. Saudi Aramco, Saudi Arabia’s flagship petroleum company, has managed to keep Ghawar producing at 5 million barrels of oil a day. IEA World Energy Outlook 2009 suggests that Ghawar would have been producing close to 5.1 million barrels a day contributing to 7% of world conventional oil production. With 70% of its oil getting depleted, what is left is the bottom 30% of less desirable
oil.23 With the top 3 fields of the world already surpassed their
peak production and reaching a phase of decline, the world oil production scenario looks bleak, and ripe for peak oil.
End of HydroCarbon Legacy
Our best case estimates give us a Peak Production period of 2004 to 2010. We anticipate oil production to start declining between 2011 and 2015. The plateau production that is stated to last for about 6 years can be seen from the graph below. The reason for world oil production reaching stagnation could be multifold.
21 Fredrik Robelius, Burgan Decline November 2005 pg 1 22 IEA WEO 2009, pg 237
23 http://www.theoildrum.com/node/2470, Giant Oil Fields – The Highway to oil, by Fredrik Robelius
0 5 10 15 20 25 30 35 0 200 400 600 800 1000 1200 1400 1965 1970 1975 1980 1985 1990 1995 2000 2005 2010 2015 2020 2025 2030 2035 2040 billion bbl billion bbl years
Base Case Reserves , LHS 4% Depletion 6% Decline Rate 9% Decline Rate
Peak Oil
Firstly, the recession caused by the famous subprime debacle has led to a sharp fall in worldwide demand for oil and its by products. This came as a succor to the over stretched oil supplies of the world, where it was getting difficult to raise production since early 2004. Secondly, the application of EOR and IOR techniques in leading oil fields has made it possible to arrest the decline and delay the fall. However, these measures are quick fixes which will backfire in the long-term and could cause the decline to eventually become steeper. We have forecasted three scenarios for decline in world oil production at 4% (base case), 6% and 9%. What the graph below reveals is that even taking the most optimistic of all, a 4% base case scenario, by 2020 the world would be able to produce the same quantity of oil which we did in 1985. This implies that the world will need to adjust to the falling oil supplies and reduce our dependence on oil to the same level as seen in the 1980’s. But the world population in the 1980’s was 30% less than what we have today and linear projections indicate that by 2020 we will have reached 7.5 billion people, which is 50% more than the 1980’s level. Also, if we are required to reduce our oil consumption by 4.5% a year, how would we register economic growth rates as seen in the past?
Figure 4: Peak Oil Forecast
Source: BP Statistical Review of World Energy 2009, Mihir Mathur,
The Carbon Climax: End of HydroCarbon Legacy 23
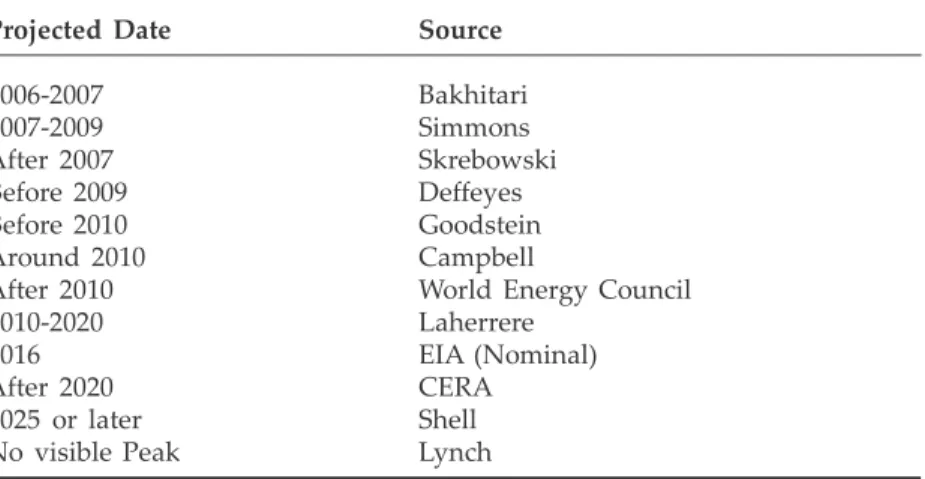
Table 3: Existing Peak Oil Forecasts
Projected Date Source
2006-2007 Bakhitari 2007-2009 Simmons After 2007 Skrebowski Before 2009 Deffeyes Before 2010 Goodstein Around 2010 Campbell
After 2010 World Energy Council
2010-2020 Laherrere
2016 EIA (Nominal)
After 2020 CERA
2025 or later Shell
No visible Peak Lynch
Source: Robert L. Hirsch, SAIC – Feb 2005, pg 8
India Peak Oil
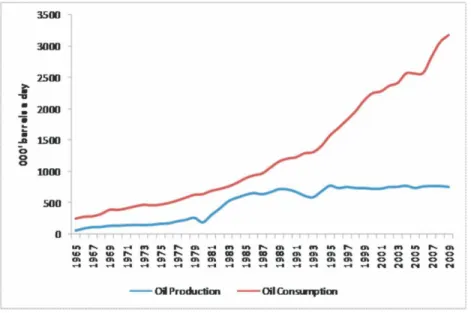
India’s energy needs are highly dependent on coal and oil as primary sources. More than 80% of the country’s primary energy consumption comes from these two sources, of which 20% is import dependent, in the form of crude oil imports.24 Three quarters of India’s oil
comes from imports. The oil import bill, for FY09-10, is expected to hit `60,000 crores25. Any kind of price fluctuation or import
instability would negatively impact the Indian economy because most of its oil is imported. It could lead to higher domestic energy prices in the form of higher electricity bills and rising fuel prices. So far, India has got a semi-regulated market with respect to petroleum prices. This has lead to soaring fiscal deficits. If there is any slack in imports, it could lead to price spikes, causing even higher deficits with soaring oil bonds and subsidy burden. For example, in year 2008 India’s average crude basket price was $83 per barrel and the subsidy and under recovery bill clocked a massive `1,03,292 crores26. If oil
prices stay above $110 per barrel in 2011, they could have substantially higher deficits.
24 BP Statistical Review of World Energy 2009
Seventy percent of India’s crude production comes from ONGC and its oil fields.27 The largest oil field in India was founded in 1967
with the discovery of Bombay High – an ultra deep water oilfield located 160 km off the coast of Mumbai. This oil field accounts for 40% of India’s oil output. The majority of the oil produced by ONGC is from its offshore oil wells, which account for 69% of the total oil produced. Bombay High commenced production in the year 1974 and has so far produced nearly 3.6 billion barrels of oil. In its latest annual report, ONGC mentioned that the application of EOR and IOR techniques would help the company improve its oil recovery rate from 28% to 33%. The oil field had undergone a redevelopment phase in early 2000 with an objective of improving the declining oil production rates.
Figure 5: India Oil Statistics
Source: BP Statistical Review of World Energy 2010
26 ppac.org.in, 22-02-2011
The Carbon Climax: End of HydroCarbon Legacy 25
Application of EOR and IOR techniques have been used to arrest the production declines. ONGC has been successful in their endeavor so far, with incremental oil production of 350 million barrels offsetting the ₨14 billion capital expenditure incurred for the redevelopment. However, as we have seen earlier, these artificial techniques to boost production are temporary in nature and do not give a long term solution. Bombay High is again witnessing declines in its oil production and is scheduled to undergo a redevelopment phase II for arresting this decline.
Carbon Climax
If we were to see an oil scarcity-induced tightness of the markets, people in the street will see it in terms of prices much higher than we see now. It would definitely have a negative impact on the economy, especially if we were to see it happen in the next few years, as we would be totally unprepared for it. The global economy is very fragile and very vulnerable to high oil prices.
Energy is the lifeblood of any economy. We had a global GPD output of $58,141 billion in 2009 with a primary energy consumption of 95 billion28 barrels oil equivalent energy29, implying that we
produced $600 of output for every barrel of energy we consumed. Taking Cuba’s case, their GDP fell by more than 34% in response to a drop of 10% in their oil imports30. We anticipate rapid economic
contraction post peak oil. Mass levels of unemployment could surface due to slowdown in economy. This in turn would lead to reduced purchasing power.
Also, a drop in GDP would imply fewer goods and services available in the market. Concurrently, the cost of manufacturing would go up as a result of increase in energy input costs. This could result into cost-push inflation31.
28 http://data.worldbank.org/indicator/NY.GDP.MKTP.CD/countries?cid =GPD_29&display=graph, 17-02-11
29 BP Statistical Review of World Energy, 2009
Cost-push inflation tends to push wage rates also. Increased wage rates again drives prices. Hence, it moves into a vicious circle. Once countries have reduced oil supply, domestic hoarding will take place. After a certain time, oil exporting nations will start dropping their oil exports, exacerbating the oil scarcity. The system then sets into a reinforcing process till a threshold is reached. Food production, supply and distribution are heavily dependent on oil. Once oil prices go up the prices of food are bound to go up. Not only will the prices go up, but food production will also drop. There is a potential threat of food riots. Trade and communication
Figure 6: Multi Causal Loop diagram showing Interrconectedness of
Energy, Economy and Food
Source: Mihir Mathur – WOTR
The Carbon Climax: End of HydroCarbon Legacy 27
are the pillars of globalization – high oil prices will adversely affect both of them. Globalization in its current form will probably not be viable at high oil prices. This will further reduce the availability and transfer of resources. A potential resource war could be sparked. This would pose a threat to the social fabric of life, both globally and locally.
Welcome to a decade of Metamorphosis and Rapid Change.
The Road Ahead
This paper is an endeavor to develop a foresight. We see challenges today which we will face in the time to come. What do we do to prepare for them? How do we prepare? Do we have enough time left? Do we have the required resources? Do we have consensus on the urgency of the situation? These are some of the questions that come to our mind and we are sure they will come to you too. They call for collective thinking, sharing and action. We will discuss our reflections on the road ahead in our future publications. Also, a more comprehensive and detailed insight on peak oil is required especially in the Indian context. Hence, we at WOTR are hopeful of coming out with a series of publications showing the interconnectedness of peak oil, climate change and risks of globalization.
Post Carbon Dawn: Cuba Peak Oil
In 1989 the Soviet Union collapsed. Cuba had been dependent on the USSR for oil, purchase of its sugar crop, and other economic aid. Deprived of this assistance, Cuba‟s economy and agricultural production collapsed, resulting in what the Cubans euphemistically refer
to as their “Special Period.” When trade relations with the Soviet Bloc
crumbled in late 1989 and 1990, and the US tightened the trade embargo, Cuba was plunged into an economic crisis. In 1991 the
government declared the “Special Period in Peacetime,” which basically
put the country on a wartime economy-style austerity program. An immediate 53% reduction in oil imports not only affected fuel availability for the economy, but also reduced to zero the foreign exchange that Cuba had formerly obtained via the re-export of petroleum. Imports of wheat and other grains for human consumption dropped by more than 50 %, while other foodstuffs declined even more. Cuban agriculture was faced with an initial drop of about 70% in the availability of fertilizers and pesticides, and more than 50% in fuel and other energy sources produced by petroleum. Suddenly, a country with an agricultural sector technologically similar to California‟s found itself almost without chemical inputs, with sharply reduced access to fuel and irrigation, and with a collapse in food imports. In the early 1990s average daily caloric and protein intake by the Cuban population may have been as much as 30% below levels in the 1980s. Fortunately, Cuba was not totally unprepared to face the critical situation that arose after 1989. It had, over the years, emphasized the development of human resources, and therefore had a cadre of scientists and researchers who could come forward with innovative ideas to confront the crisis.
In response to this crisis Cubans and their government rushed to develop and implement alternatives. Because of the drastically reduced availability of chemical inputs, the state hurried to replace them with locally produced,
and in most cases biological, substitutes. This has meant
biopesticides (microbial products) and natural enemies to combat insect pests, resistant plant varieties, crop rotations and microbial antagonists to combat plant pathogens, and better rotations and cover cropping to suppress weeds. Scarce synthetic fertilizers were supplemented by biofertilizers, earthworms, compost, other organic fertilizers, animal and green manures, and the integration of grazing animals. In place of tractors, for which fuel, tires, and spare parts were often unavailable, there was a sweeping return to animal traction (Rosset and Benjamin 1994). When the crisis began, yields fell drastically throughout the country. But production levels for domestically-consumed food crops began to rise shortly thereafter,
The Carbon Climax: End of HydroCarbon Legacy 29
especially on Agricultural Production Cooperatives (CPAs) and on the farms of individual small holders or campesinos. In September 1993 Cuba began radically reorganizing the state sector in order to create the small- scale management units that seemed most effective in the Special Period. The government issued a decree terminating the existence of the majority of state farms, turning them into Basic Units of Cooperative Production (UBPCs), a form of worker-owned enterprise or cooperative. Much of the 80% of all farmland that was once held by the state, including sugarcane plantations, was essentially turned over to the workers. By the latter part of the 1990s the acute food shortage was a thing of the past, though sporadic
shortages of specific items remained a problem, and food costs for
the population had increased significantly. The shortage was largely
overcome through domestic production increases which came primarily from small farms, and in the case of eggs and pork, from booming backyard production (Rosset 1998). The proliferation of urban farmers who produce fresh fruits, vegetables and some meat and dairy products has also been extremely important to the Cuban food supply (GNAU 2000; Murphy 1999). The earlier food shortages and the resultant increase in food prices suddenly turned urban agriculture into a very profitable activity for Cubans, and once the government threw its full support behind a nascent urban gardening movement, it exploded to near epic proportions. Formerly vacant lots and backyards in all Cuban cities now sport food crops and farm animals, and fresh produce is sold from stands throughout urban areas at prices substantially below those prevailing in
the farmers‟ markets. There can be no doubt that urban farming, relying
almost exclusively on organic techniques, has played a key role in assuring the food security of Cuban families over the past two to three years. As an indication, more than 90% of perishable produce consumed in Havana is grown in and around the city limits.
Bibliography
1. ASPO. (n.d.). Retrieved from www.peakoil.net
2. BMO. (Fall 2007). Oil & Gas Global Cost Study. Energy Politics. 3. BP. (2009). BP Statistical Review of World Energy.
4. Brown, L.R. (2009). Plan B 4.0. Earth Policy Institute.
5. Bunter, M.A. (Spring 2009). Is The Age Of Oil Coming To An End? Energy Politics.
6. Burns, K.J. (2005). Burgan Decline. In K.J. Burns.
7. Campbell, C.J. (2002). Forecasting Global Oil Supply 2000-2050.
Hubbert Center Newsletter.
8. EIA. (2009). International Energy Outlook. EIA. 9. Friedman, T.L. (2008). Hot, Flat and Crowded.
10. Gowdy, J. (2006). Production Theory And Peak Oil: Collapse Or Sustainability? International Journal of Transdisciplinary Research, 23-33.
11. Hubbert Peak. (n.d.). Retrieved from www.hubbertpeak.com
12. Hubbert, M.K. (1962). Energy Resources. 13. IEA. (2008). World Energy Outlook. IEA.
14. Koppelaar, R. (October 2009). Oilwatch Monthly. Oilwatch Monthly.
15. Laherrere, J. (Spring 2009). Forecasting world oil and gas production under strong economic constraints. Energy Politics. 16. lifeaftertheoilcrash. (n.d.). Retrieved from www.lifeaftertheoilcrash.
net
17. Nations, U. (1999). The World At Six Billion.
18. Norman Brinkman, General Motors Corporation, Michael Wang,
Argonne National Laboratory, Trudy Weber, General Motors Corporation, Thomas Darlington, Air Improvement Resource, Inc. (2005). Well-to-Wheels Analysis of Advanced Fuel/Vehicle
Systems – A North American Study of Energy Use, Greenhouse Gas Emissions, and Criteria Pollutant Emissions.
19. ODAC. (n.d.). Retrieved from www.ODAC.com
20. ONGC. (2009). Annual Report.
21. OPEC. (2008). Annual Statistical Review. OPEC. 22. OPEC. (September 2009). Monthly Oil Report. OPEC. 23. Peak Oil. (n.d.). Retrieved from http://www.dieoff.org/
24. Peak Providence. (n.d.). Retrieved from http://www. peakprovidence.com
The Carbon Climax: End of HydroCarbon Legacy 31
25. Saudi Armanco Homepage. (n.d.). Retrieved from http://www.
saudiaramco.com/index.html
26. SIAM India. (n.d.). Retrieved from http://www.siamindia.com/
scripts/gross-turnover.aspx
27. Simmons, M. (2005). Twilight in The Desert. Wiley.
28. Tertzakian, P. (2006). A Thousand Barrels A Second. McGraw-Hill. 29. the oil drum. (n.d.). Retrieved from www.theoildrum.com
30. View from the Peak. (n.d.). Retrieved from http://www.
theviewfromthepeak.net/
31. World Population. (n.d.). Retrieved from http://www.census.
Watershed Organization Trust (WOTR)
The Watershed Organization Trust (WOTR) is a not-for-profit NGO founded in 1993. Its operations presently span five Indian states – Maharashtra, Andhra Pradesh, Madhya Pradesh, Rajasthan and Jharkhand.
WOTR’s mandate is reflected in its vision “communities, especially the
poor within, are empowered and secure their livelihood and well being in sustainable ecosystem.”
Since its inception WOTR has been working in resource-fragile semi- arid rain-fed regions through participatory watershed development. Now, WOTR has moved from “regenerating the degraded lands through in-situ harvesting of rainwater” to a holistic integrated and systemic ecosystems based model of community development that aims to address climate variation and climate change.
WOTR mobilises the communities to tap into their capacities to help them move on the path of equitable sustainable development – and along the way – reduce poverty, through regenerating the eco-space and watersheds they live in. It helps the rural communities in resource fragile rain-fed and drought-prone regions, to organise themselves, to respond to, emerging climate variations while enhancing their adaptive capacities, to address the climate change.
fa th e ro fs h r@gm ai l.c om
Watershed Organisa on Trust (WOTR) ‘The Forum’, 2nd Floor, S.No. 63/2B, Padmava Corner, Pune Satara Road, Parva , Pune 411009, India. Phone: +91-20-24226211 • Fax: +91-241-2451134 Email: [email protected] • Website: www.wotr.org