Obishur Watershed Activity Plan
2
Table of content
1. Introduction ... 3
2. Obishur watershed description... 5
3. Hydrology of the watershed ... 7
4. Erosion and sediment transport potential ... 10
5. Natural disaster risk. ... 13
5.1 Dehlolo ... 13
5.2 Guliston ... 14
5.3 Kulchasma Bolo ... 15
5.4 Kulchasma ... 17
6. Pressures and impact ... 18
7. Proposed actions ... 23 7.1 Mitigation ... 24 7.2 Pasture management ... 25 7.3 Conservation agriculture ... 27 7.4 Energy efficiency ... 28 7.5 Reforestation ... 30 Annex 1 maps
3
1
Introduction
Muminabad District is located in the South Eastern part of Khatlon region of Tajikistan. The rural population in Muminabad District is vulnerable to natural disasters since poverty levels are high. At the same time the District is frequently hard hit by flood disasters, e.g. like in spring 2012. These disasters damaged infrastructural works and properties of villagers and cost the Hukumat/Jamoat and the community members a lot of money. Notably in the village Kulchasma, a lot of damage occurred.
Next to this Muminabad has a high level of food insecurity. As a consequence, intensified hazards and lack of efficient preventive measures threaten to have a negative impact on the livelihoods of the population, in particular in the selected areas of the SDC funded Integrated Watershed Management project (IWSM project), the watersheds Obishur and Chukurak. The IWSM project started on 12th September 2011 and will end 31st May 2014.
This Watershed Activity Plan (WAP) for Obishur watershed is the outcome of the project activities carried out during the project inception phase (September 2011-June 2012). The plan describes the activities that will be undertaken during the main phase of the project (July 2012-May 2014). It serves as a guide for those involved in project activity advising and implementation; it shows the interventions that are expected to be most effective and should therefore have the highest priority and it indicates the locations of the intervention areas that will give the best possible impact. After a process of extensive problem identification, involving many stakeholders, a list of possible interventions was developed based on various studies carried out and through engagement with the heads of departments of the Hukumat and the community members, represented by the Civil Society Committee (CSC). In short, the final decisions made on the proposed interventions are based on (1) assessment of previous DRR experiences implemented in Muminabad District, (2) studies carried out during inception phase (as described in chapters 2-6) and (3) discussions with the CSC and Steering Committee (SC) members.
Through the various studies conducted during the inception phase the following emerged as the major problems existing within the Obishur watershed:
Riverbank erosion and sediment build up in riverbeds; Overgrazing leading to pasture degradation;
Unsustainable crop management practices (especially wheat) leading to sheet and rill erosion; Deforestation.
The various studies served as an input into the decision making process, enabling (1) to prioritize areas within the watershed and (2) to prioritize intervention themes. As a result possible interventions were defined for the watershed, which will be taken up by the project: (1) Protective structures, (2) Pasture management, (3) Awareness creation and training on Conservation Agriculture (CA), (4) Energy Efficiency (EE) campaign and (5) Reforestation. For implementation of the projects, the cost sharing principle will be applied (minimum 15% own contribution by the community) and as much as possible local partners will be engaged in the implementation of the thematic projects. Where relevant, reinforcement of existing rules and regulations on sustainable land-use will be facilitated.
4 Objective and focus of the Watershed Action Plan
Based on the identified problems and solutions for Obishur watershed, the CSC of Kulchasma agreed to the following objective for the Watershed Activity Plan to be implemented during the main phase.
“To reduce water run-off on slopes, reduce downstream water flows and to reduce damage inflicted to public infrastructural works and private properties of the population of the 10 villages of Obishur watershed and make a contribution to improving their livelihoods by introducing Sustainable Land Management practices that increase the infiltration capacity of the soils in the upper and transfer zones”. The decision making process in WAP formulation
At the start of the project, the head of the Civil Society Committee of Kulchasma Jamoat nominated 10 people to form the project CSC and to act as sounding board for the IWSM project. They were recruited from villages within the watershed or those that influence SLM practices.
Four meetings with CSC of Kulchasma were held; one establishment meeting where information was given about the project and 3 consultative meetings, including a field visit to the upper zone. These meetings very much enhanced the sense of urgency among the communities to tackle the problems and harmonized the thoughts of the members about which interventions need to have the highest priority in Obishur watershed. It also increased the insight of the members into the connection between unsustainable land management practices and the occurrence of frequent floods downstream. The interactions between CSC and Project Support Unit (PSU) helped to raise support for longer term preventive measures.
5
2
Obishur watershed description
The Obishur watershed is located north of Muminabad town in the Jamoat of Kulchasma. It covers an area of around 80km2, is east-west oriented and has a length of around 13km. The eastern border of the watershed is formed by the Hazratishoh ridge with altitudes of up to 2600m. The Hazratishoh ridge consists of alluvial deposits from the Panj river and rivers draining from Darvaz that ascended due to tectonic movements. The Hazratishoh ridge is incised with canyons formed through erosion activity in the early mountain forming and ridge ascending period. Later on, due to climate aridization wind-borne sediments were deposited against the formed relief. It resulted in the formation of loess deposits that are now covering the alluvial deposits. The abundance of alluvial and loess sediment sources in the upstream areas in combination with intense and flashy rainfall events led to the formation of large alluvial fans at the foot of the mountain belts. More towards the west the watershed drains towards the Surgh river through agricultural lowlands at altitudes of around 1200m.
The Obishur watershed consists of four parallel sub-watersheds with a surface that ranges from 26km2 to 8km2. In their reference state these would all drain to the Surgh river. The watershed has been heavily modified though during the Soviet period by the construction of a canal that cuts through the watershed along a north-south axis (see Map3 in Annex). Only the northern sub-watershed still drains to the Surgh because the canal is flowing through a culvert where river and canal intersect. The other three sub-watersheds all drain in the canal.
The climate in Muminabad is semi-arid, with annual precipitation varying from 500 to 1400mm. The main rainfall season is spring with a maximum in April (180mm as an average). The summer is almost dry, what results in a complete drying out of Muminabad mountain streams. During spring, short and intense rainfalls often result in flashfloods combined with considerable debris flow or fluvial sediment transports.
The population in the watershed is around 10.000. The larger villages are located in the downstream areas. Five smaller villages, or around 25% of the population are
located in the upstream parts. The average
population growth in the district is 2%, though the population in Jamoat Kulchasma is expanding faster due to a migration from Muminabad town and from outside the district1. Mainly the villages located in the upstream areas are growing fast, at an average rate of 8% since 2003. The villages Chargi Kalon, Chargi Bolo and Sayod have doubled over this period. Infrastructure in these communities is poorly developed, but the natural disaster risk tends to be lower due to their
upstream location. The larger settlements are growing at a lower rate, around 1-2%. Unfortunately due to
1 District Development Plan Muminabad.
Villages 10
Population 9.865
Surface in hectares 7.800 Pasture land in hectares
Cropland in hectares
3.040 1.500 Cropland on slopes in hectares 250 Livestock units 8.000
6
land scarcity the housing of the growing population is concentrated on the fan areas. The natural disaster risk in these areas is high and more difficult to manage. It requires new infrastructure works that are expensive and high in maintenance. In spite of this, the trend of developing the fans in residential areas remains.
The land use in the watershed is mainly agricultural. The downstream areas west of the canal are irrigated and used to grow potatoes and wheat (around 630ha). In the area east of the canal agro-pastoralism is practiced. On the non-irrigated croplands wheat, flax, chickpeas, alfalfa and esparcet are cultivated (around 800ha). After the harvest the fields are used as grazing areas for the herds of the villages. More upstream land is used for permanent pastures. Around 70ha are orchards.
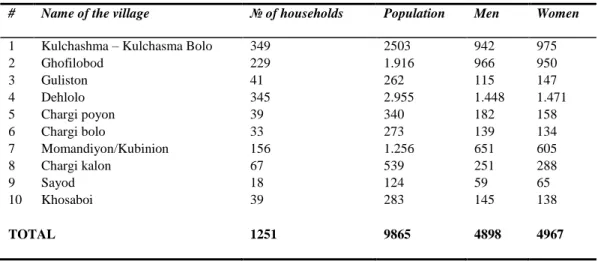
Some characteristics of the watershed and details of the population are shown in table 1 and 2.
# Name of the village № of households Population Men Women
1 Kulchashma – Kulchasma Bolo 349 2503 942 975
2 Ghofilobod 229 1.916 966 950 3 Guliston 41 262 115 147 4 Dehlolo 345 2.955 1.448 1.471 5 Chargi poyon 39 340 182 158 6 Chargi bolo 33 273 139 134 7 Momandiyon/Kubinion 156 1.256 651 605 8 Chargi kalon 67 539 251 288 9 Sayod 18 124 59 65 10 Khosaboi 39 283 145 138 TOTAL 1251 9865 4898 4967
7
3
Hydrology of the watershed
The Obishur watershed consists of two drainage systems. System 1 is shown in Fig 1 (up). It has three sub-watersheds: an upstream zone w480, a transfer zone w470 and a downstream zone w460. The outlet of the downstream zone discharges in the Yakhsu river. The downstream zone w460 is densely populated, with villages Kulchasma, Ghofilobod and Kosaboi.
Drainage system 2 is shown Fig 1 (down). It is formed by three ephemeral mountain streams that all drain in the canal. The most northern stream is the smallest and drains the sub-watershed w380. Because this river does not drain the upstream areas there is no alluvial fan in this sub-watershed. The outlet flows along the south side of Kulchasma Bolo into the canal. The middle stream drains sub-watersheds w280-w270. The village Guliston is located in its downstream part. Runoff from this watershed flows over a road and into the canal. Through a nearby irrigation valve on the canal excess runoff can be channelled towards a ditch that takes the flow further downstream to the Yakhsu river. The third stream drains the
sub-watersheds w180-w170. The village Dehlolo is situated at the outlet of w170. A part of the river flow in fact cuts the border of the watershed and drains towards Guliston in w270. Therefore between Dehlolo and Guliston a large alluvial fan has formed with sediments from the upstream areas w180-w280.
Because the purpose of this watershed plan is amongst others to define measures that can reduce the rainfall run-off volumes and sediment transports through increased precipitation retention, the contribution of each sub-watershed in the hydrological balance have been determined. These results are also used later on in the hazard and risk assessment. The hydrological balance has been determined by
Fig 1 Obishur watershed. The percentage indicates the share in the precipitation runoff volume of the watershed for the modelled rainfall event. System 1 (above), drains in the Yakhsu river. System 2 (below), drains in the canal
W480 W470 W460 downstream transfer zone upstream transfer zone W170 W180 W380 W270 W280 upstream
8
means of a HEC-HMS hydrological model2. Only surface runoff has been considered given the short duration of flash flood phenomena, often not more than a couple of hours. Through the simulation of a once in a generation rainfall event over both systems, the relative runoff share of the upstream and transfer zones have been obtained.
The results are
graphically shown in Fig 1. In system 1, 66% of the runoff is originating from the upstream zone w480. In system 2, the largest percentage of the runoff volume, around 56%, is generated in the transfer zone. However, because
of the watershed
configuration it makes more sense to concentrate on the southern
sub-watersheds w170 (downstream)
and in particular w180
(upstream). Together these are
good for 48% of the total runoff in system2.
The hydrological balance results tell us that in order to reduce the runoff, land management projects can best be implemented in sub-watersheds w480 and w470. These results however need to be checked against the elements at risk in the downstream areas of the watersheds. The overall objective of the watershed management plan is
namely to reduce the natural disaster risk. If there are few elements at risk, or if there are, but they have low susceptibility, than the flood risk will be low, despite high runoff volumes. The hydrological analysis therefore needs to be tied in with the analysis of the hazards and natural disaster risks in the next section.
2 See P. Vlieghe (2012). Hydrological analysis of the Obishur and Chukurak watersheds. Consultancy report for Caritas CH. Zone Sub-watershed Surface(ha) System villages
Upstream W480 1463 1 Sayod
W280 265 2 -
W180 1000 2 -
Transfer W470 1225 1 Kulchasma bolo, Chargi kalon
W380 742 2 Kulchasma bolo, Momandyon, Chargi kalon, Kubinion W270 1065 2 Guliston, Chargi Poyon,
Chargi bolo
W170 790 2 Dehlolo
Downstream W460 924 1 Kulchasma,
Ghofilobod, Kosaboi, kubinion
Zone Sub-watershed Peak flow (m3/s)at outlet
comments
Transfer W470 60 1/3 flows over fan
W380 20
W270 42 High runoff because watershed receives 75% from runoff from w170 W170 12 Low runoff because
watershed loses 75% of the runoff to
neighbouring w270
Table 3 Sub-watersheds of the Obishur watershed. The system indicates whether the
watersheds are draining to the Yakhsu (1) or to the canal (2).
9
One indicator of damaging potential of the floods is the peak flows that are generated during intense rainfall events. Higher peak flows result in higher flood depths and velocities, and are potentially more damaging. Therefore peak flows that can be expected downstream during a once in a generation event have been assessed. They are listed in table 4. The highest peak flows are expected at the outlet of sub-watershed w470, in Kulchasma. However, the main channel spreads out in a number of branches on the top of the fan. The northern branch conveys an estimated 1/3 of the discharge. The remaining 2/3 of the runoff flows in the main channel along the south edge of the fan towards Kulchasma and the other settlements located more downstream. Therefore the peak flow in Kulchasma3 will be lower, between 40-45m3/s. The peak flows in w270 are high for the size of the watershed because a large part of the runoff from w180-w170 ‘breaks’ through its border and flows towards the outlet of w270 over a large joint fan. For the same reason is the peak discharge at w170 lower than one would expect for the size of the watershed.
3
The flow over the northern branch on the fan is flowing overland in the canal, mainly because of a blocked culvert. Part of this water is flowing back in the main fan channel on the south edge in Kulchasma, through a diversion on the culvert that conveys the canal flow under the main riverbed.
10
4
Erosion and sediment transport potential
Erosion and sedimentation processes in the watersheds play a dominant role in the formation of most of the natural disaster risk in the downstream areas in Muminabad district. Therefore understanding these processes and their consequences is an important precondition for the design of an effective sediment management approach. Hereto field assessments have been held in the Obishur watershed. During transect walks from upstream to downstream ongoing erosion, transport and sedimentation processes have been observed. The following observations are valid:
In the upstream watershed areas (+2000m) mainly natural erosion processes are ongoing that cannot be stopped. What exactly triggered these processes is unclear; Change in climate or tectonic activities may have been at the origin, whether or not reinforced by ancient anthropogenic actions.
There are clear signs that human interactions are aggravating land degradation and erosion. Throughout the watersheds destructive signs of overgrazing, logging and tillage are visible. Sediments are accumulating in the downstream areas and this trend is expected to continue. This
has implications for natural disaster risk that needs to be taken into account during risk assessments. Without sediment transports the discharges in the riverbeds would be much easier to manage. The possibility that large volumes of sediment are transported downstream during intense rainfall events changes the potential risk situation in the populated areas.
Through a simplified approach the volumes of sediment available for transport downstream during a large event (once in a generation) have been determined (see table 5). The largest sediment density is found in the upstream watershed w280. It has the steepest slope and also most rugged terrain. Debris flows here are most likely. Other watersheds with large
sediment accumulations are w480 and w180. The downstream watersheds have much less sediment accumulations and they are generally less course due to the loess layers present in these areas. During a large event not all of these sediments will accumulate downstream. A large fraction will accumulate on the fan slopes. In the Obishur watershed these slopes range from 4 degrees upstream on the fan to around 2 degrees downstream. Sub-basin Erosion susceptible surface (ha) Watershed surface (km2) Average basin slope (degrees) Sediment volumes(m3) Sed/km2 Obishur W480 368 14.7 19 36800 2503 W470 232 12.2 14 11600 950 W380 73 7.4 10 3200 432 W280 84 2.6 22 8400 3230 W270 137 10.6 11 6850 646 W180 261 10 20 26100 2610 W170 82 7.9 11 3100 392
Table 5 Sediment volumes in the watershed. The surface in the watershed that is prone to
erosion is shown in column 1. Multiplying the surface with an erosion rate of 1cm gives the sediment volumes for the upstream areas, multiplying with 0.5cm gives the sediment volumes for the downstream areas.
11 Estimated is that around 30% of the
sediment volumes in the upstream river basins will be flushed through the system. These are finer materials that are not accumulating in the downstream areas, unless there are obstructions like for instance in Kulchasma Bolo where the river outlet is perpendicular on the canal. Around 30% of the upstream sediments will be accumulated on the fans. Observations have shown that coarse sediments (+200mm to boulder size) are accumulating on the fan, somewhere between the 3 and 4 degree line. Flow infiltration on the fan and a decreasing slope prevents these course sediments to travel further downstream.
A large volume of sediments is also accumulating behind the old airport. Around 70% of the sediments volumes from the downstream watersheds are flushed through. The composition of these sediments is finer than the upstream ones, containing more silt and smaller sized gravel. For the same reason downstream sediments will accumulate less on the fan, roughly estimated around 10%. Given this the resulting sediment volumes that are expected be deposited downstream in case of a large event are shown in table 6.
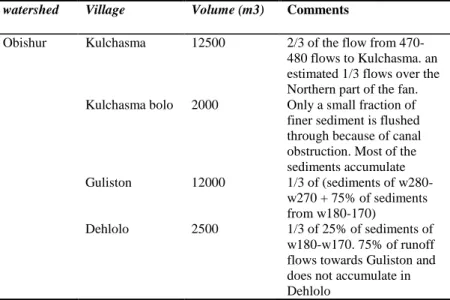
Whether these potential sediment accumulations will cause problems downstream depends on the sediment storage capacity in the villages downstream. The free volume in the riverbed and near river obstructions such as bridges or culverts determines the behaviour of the floods. If riverbeds are already fully accumulated than a large volume of additional sediments may lead to a river breakout of the riverbed through a community, causing a lot more damage than if riverbeds still have sufficient storage space. The storage volume in the watershed has been determined for the critical villages and is listed in table 7.
watershed Village Volume (m3) Comments
Obishur Kulchasma 12500 2/3 of the flow from 470-480 flows to Kulchasma. an estimated 1/3 flows over the Northern part of the fan. Kulchasma bolo 2000 Only a small fraction of
finer sediment is flushed through because of canal obstruction. Most of the sediments accumulate Guliston 12000 1/3 of (sediments of w280-w270 + 75% of sediments from w180-170) Dehlolo 2500 1/3 of 25% of sediments of w180-w170. 75% of runoff flows towards Guliston and does not accumulate in Dehlolo
watershed Village Volume (m3) Comment
Obishur Kulchasma 8500 Estimated available volume upstream of the bridge. Downstream of bridge riverbed is filled up. Kulchasma bolo (south of) Kulchasma Bolo (north of) 1000 8500 Volume in 200m of straight riverbed perpendicular on canal (outlet w380) Free volume on around 1km of riverbed north of Kulchasma Bolo on outlet w470.
Guliston 22500 Accumulation area on the fan just upstream of Guliston Dehlolo 12500 Accumulation area on the
fan just north of Dehlolo
Table 6 Potential sediment accumulation loads in downstream sections
12
We can conclude that from the three upstream sub-watersheds in Obishur, the most active one is w280. It has the highest percentage of degraded areas, the steepest upstream slope and the most rugged terrain. We can therefore expect this watershed to have a higher probability of debris flows. The total volume of sediments that can accumulated downstream during a large event are around 12000m3. however, the downstream sediment storage capacity in Guliston is high, over 20000m3, and there are relatively few elements at risk.
The other two sub-watersheds w480 and w180 are comparable in slope and terrain ruggedness. In watershed w180 the upstream accumulated sediments are high, over 20000m3, but most of these sediments will accumulate on the fan south of Guliston. Only a smaller fraction of an estimated 2500m3 will deposit in the riverbed north of Dehlolo. The accumulation space is several times higher, over 10000m3. Therefore the risk in Dehlolo from floods caused through sediment accumulations downstream is on the lower side.
The situation in Kulchasma is more critical. The sediment bulking in the upstream watershed is over 35000m3, of which an estimated 12500m3 could be accumulating in the downstream part. The free storage is around in the same order of magnitude, around 8500m3. Therefore floods combined with large sediment transport downstream are expected to cause more serious problems here. Kulchasma Bolo, a smaller settlement, is located along the same riverbed somewhat upstream. Here the risk exists that high flows break out of the riverbed in case sediment accumulation occurs.
13
5
Natural disaster risk
Hazard zones and elements at risk have been determined through transect walks in the villages and rivers. Information obtained from the sediment potential and sediment storage capacity, as well as results form the hydrological analysis are used to determine the likelihood of floods in a particular location. Two events have been considered: a high frequency event that occurs once every five years and a low frequency event that occurs once every 30years. For the risk calculations a one in a hundred has also been considered4. Note that risk has to be interpreted as the average annual expected damage. This is different than the total damage that could occur in a single event!
5.1 Dehlolo
This community is situated 1.5km north of Muminabad town. It has a population of around 2955, or around 345 households. Over the past few years Dehlolo has been expanding towards the east on the fan. Around 30 new houses have been constructed on this site, and more houses are being built. Runoff from the sub-watersheds w180-w170 is partly flowing north of the village through the main riverbed and partly through the village through a ditch. A dike was built in 2010 upstream of Dehlolo to protect the community from possible flooding. The dike guides the runoff from the southern slopes of watershed w180 towards the main river. Without the dike the runoff will flow through the village. However, a gully is now developing at the upstream toe of the dike which is eroding this structure. This is putting a part of the community at risk. Floods occurred in Dehlolo in 1983 and 2004, with a reported total damage to 5 houses and partial damage to 19.
Low recurrence: once in a generation event
The potential sediment volumes that could be transported downstream from the upstream watershed w180 in case of a large event are around 26000m3. Most of these sediments (an estimated 75%) will accumulate on the fan south of Guliston. The remainder, an estimated 4500m3, will be deposited on the fan and in the upper riverbed just north of Dehlolo (see annex 1, map 2), as well as before the bridge downstream. The possible consequences of such an event are
an outbreak of the river on the fan towards the riverbed north of Dehlolo (see red arrow map1). Mainly cropland and a few houses are at risk. Due to the terrain topography it seems unlikely that main riverbed can break out towards the houses in the village.
Inundation of the bridge and a zone of cropland around the riverbanks downstream of the bridge. There is only around 10cm free riverbed under the bridge. The discharge during a large event can reach an estimated 12m3/s, leading to local floods at this point.
Increased flow of up to 5m3
/s through the new and old part of Dehlolo. This flow originates from overland flow from the southern slopes of the downstream sub-watershed w170. An area of around 1.5km2 is draining towards the village. This overland flow is now channeled to the main river north of Dehlolo via the dike. The structure is eroding and may break during a large event, putting Dehlolo at risk.
High recurrence: <5 years
4
A one in a hundred event has been included for the risk calculations. Such an event is not expected lead to much larger sediment transports than a one in a 30years due to sediment limitations
14
More frequent events will cause problems at the bridge downstream of Dehlolo, given it is filled with sediments. This is the most critical point. Discharges are relatively low but sufficient to cause scour on upstream and downstream sides of the bridge. There are no other elements at risk for such events.
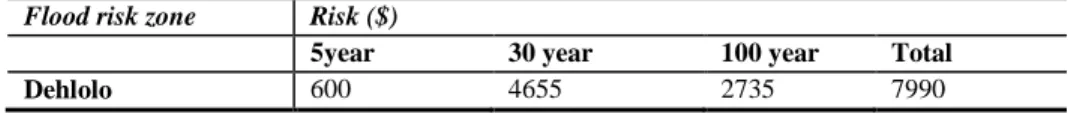
Flood risk Dehlolo
An estimated total of 25 households or around 200 people are at risk of being affected in old and new Dehlolo. The flood risk is shown in table 9.
Flood zone Households People
Dehlolo 25 200
Table 8 number of households at risk in Dehlolo for a once in a generation event.
Flood risk zone Risk ($)
5year 30 year 100 year Total Dehlolo 600 4655 2735 7990
Table 9 Flood risk in Dehlolo
5.2 Guliston
Guliston is a smaller community some 1.5km north of Dehlolo. It counts around 40 households or 250 inhabitants. Most of the houses are situated north of the fan outlet in a safe area. Only around 5 houses are located south of it. A riverbed is channeling the outflow of the watersheds on the east side of these houses, towards the canal (see annex 1, map 3). The dikes of this riverbed are eroding and will break if not maintained. When this happens damage may occur depending on the magnitude of the event.
Low recurrence: once in a generation event
A large event can transport a substantial amount of sediments to the accumulation zones indicated on map 3. Sediments originate mainly from sub-watersheds w280 and w180. Estimated is that around 10000m3 may be deposited in these downstream areas. This may lead to a (partial) blockage of the canal. Discharge can be substantial, reaching up to 40m3/s. Under such a scenario flooding of up to around 8ha of croplands located on the downstream side can occur. Additional damage can be expected at the bridge
Conclusions
Flood risk in Dehlolo is around 8000$.
A low frequency event (once in a generation) can lead to floods in new and old Dehlolo from overland flow that breaks through the dike. In addition the road downstream as well as a zone of cropland north of Dehlolo are at risk of being flooded.
Higher frequency event (< five years) will cause flooding of the bridge downstream of Dehlolo if sediments are not cleaned, and will continue to erode the dike upstream of the village
15
over the canal a few hundred meters downstream, as well as to irrigation structures on the canal and a stretch of asphalt and gravel roads.
Additional elements at risk are located on the left bank of the riverbed stretch that conveys discharge from the fan north towards the canal. The capacity of the riverbed is fairly large, but at some points the embankment (unprotected earth dike) is strongly eroded. When it breaks around five houses and kitchen gardens are at risk. The flood will follow a shortened path as indicated by the red arrows.
High recurrence: <5 years
For more frequent less intense events the only element at risk is the asphalt road near the canal where fan runoff discharges in the canal. There are no culverts on this location, even for minor events the road on this location floods.
Flood risk Guliston
An estimated total of 3 households or around 20 people are at risk of being affected in Guliston. The flood risk is shown in table 11.
Flood zone Households people
Guliston 3 20
Table 10 number of households at risk in Guliston for a once in a generation event.
Flood risk zone Risk ($)
5year 30 year 100 year Total
Guliston 145 1770 1007 2921
Table 11 Flood risk in Guliston
5.3 Kulchasma Bolo
This is a smaller new community at the height of Kulchasma on the east side of the canal. It counts around 65 households or 586 inhabitants. The village is built between the outlets of sub-watershed w470 in the north and sub-watershed w370 in the south (see annex 1 map 4). The community itself is still
Conclusions
Flood risk in Guliston is around 3000$.
A low frequency event (once in a generation) can lead to a blockage of the canal through sediment accumulation. Damage to around 6ha of cropland and 3 houses is possible.
A high frequency event (< five years) will cause minor damage, to asphalt road and further erosion of river embankment.
16
expanding towards the east on the fan. During intense rainfalls overland runoff is flowing through the southern part of the community. Floods occurred here in 1976 and more recently in 2009.
Low recurrence: once in a generation event
Three hazard zones have been identified in the village. The largest and most dangerous one is located in the northern part. This zone can flood in case a part of the main river from sub-watershed w470 breaks out of its riverbed. The embankment of the river above the village is still around 0.5m high but the sediments in the bed are accumulating. Previously it was estimated that a large event can transport around 12500m3 of sediments downstream. If this happens the riverbed may fill up and a break out of the river on this location may occur (indicated by red arrows on the map). The flood will flow back towards the main riverbed because the village is located on a convex slope. Around 25 houses on the northern part are at risk of being affected by such an event. The slope of this hazard zone is around 1.5 degrees. Therefore flood velocities will be less than in hazard zones in Chukurak, around 1m/s. Estimating discharge is difficult due to the braided nature of the fan upstream. Assuming that around 20% of the discharge could break out, according to the hydrological model, a flow of around 10m3/s can be expected.
A second hazard zone is located in the south part. This zone is regularly affected by overland flow from the north part of sub-watershed w380. An area of around 0.5km2 passes through the settlement as it drains towards the outlet of the watershed. Given the smaller size it is unlikely that larger floods will develop in this zone. A large event could result in a flow of max 2m3/s. There are around 10 houses in this hazard zone. More likely floods will affect mainly kitchen gardens and to a lesser extend houses in this area.
The third hazard zone is downstream of the intersection of the outlet of sub-watershed w380 and the canal. A large event during spring 2012 transported an estimated 2000-3000m3 of sediment into this intersection. As a consequence the canal blocked, and discharge from both the watershed and the canal flooded the croplands as the water drained towards the main road. No damage was incurred though in the village itself, although problems in zone 2 and 3 occur during the same event.
High recurrence: <5 years
For more frequent less intense events only problems are expected in the second hazard zone from overland flow that drains towards the watershed outlet. Discharge will be rather low, up to 1m3/s and while disturbing, it should only affect kitchen gardens.
Flood risk in Kulchasma Bolo
An estimated total of 35 households or around 315 people are at risk of being affected in Kulchasma Bolo. The flood risk is shown in table 13.
17
Flood zone Households people
Kulchasma Bolo 35 315
Table 12 number of households at risk in Kulchasma Bolo for a once in a generation event.
Flood risk zone Risk ($)
5year 30 year 100 year Total
Zone 1 0 2892 2263 5155
Zone 2 625 616 329 1570
Zone 3 0 333 168 501
Total 625 3641 2682 7226 Table 13 Flood risk in Kulchasma Bolo
5.4 Kulchasma
This is the largest village in the Jamoat. It counts around 280 households or 1830 inhabitants. The village is located on the right bank of the Obishur, on the west side of the road to Gesh. It can be affected by excess flow in the canal or by floods in the main river Obishur.
Low recurrence: once in a generation event
The riverbed in Kulchasma is around 20m wide, with a slope of around 1 degree. It is a zone of strong sediment accumulation. During soviet times the riverbed was around 3m deep. Now it is entirely filled up with sediments. Therefore the average accumulation rate is around 15cm/yr. Kulchasma is located at the outlet of the largest sub-watershed of around 24km2. Flashfloods with high discharge and sediment loads are possible. Estimated is that over 10000m3 of sediments could be accumulated downstream during a large event. Most of these sediments will accumulate upstream of the bridge. Sediment storage capacity in that area is in the same order of magnitude as sediment delivery potential. There is around 1m x6m free space under the bridge. Therefore a blockage of the bridge is possible. The discharge in the river during a large event can reach an estimated 40m3/s. In case the bridge blocks the flood will overtop it and part of the discharge will flow through the city centre (see map 5, annex 1). Under current circumstances the bridge will be overtopped during a large event without additional sediment accumulation. The slope of the flow path through the village centre is around 1 degree. Expected velocities are around 1m/s. Additional elements at risk are houses up to 200m downstream of the bridge along the right embankment, and an area of croplands on the left bank, if the river breaks out in that direction.
A second risk originates from the canal, which has a capacity of around 2m3/s. An additional diversion was built on the culvert that can channel an additional 1m3/s in the river. However, due to a blocked
Conclusions
Total flood risk in Kulchasma Bolo is around 7200$.
Around 25 households are at risk of being affected by floods in case a river break out occurs on the main river following a rise in the riverbed.
More frequent events (< five years) will cause only minor damage caused by overland flow. Mainly kitchen gardens are at risk.
18
culvert situation more upstream and substantial overland flow from the fan during heavy rains, the canal discharge can reach over 10m3/s. This excess discharge breaks out of the canal upstream of the bridge and flows through Kulchasma towards the river downstream of the bridge.
High recurrence: <5 years
More frequent less intense events are causing flood problems because of the limited capacity of the canal. If the discharge in the canal exceeds around 3-4m/s floods will occur. The excess water flows through Kulchasma towards the river. Such floods occur on a regular basis and cause minor damage to houses and infrastructure along its flow path. Problems in the main river are not expected during such events.
Flood risk in Kulchasma
An estimated total of 25 households or around 165 people are at risk of being affected in Kulchasma. The flood risk is shown in table 15. For more frequent events up to five years the flood discharge originates from overflow of the canal and is relative small, up to 5m3/s. for larger events the risk exists that the bridge blocks and or overflows. In that case floods can be substantial, up to 25m3/s5. Flood depths can reach over 0.5m, which is in most cases higher than the stone foundation of the houses. Therefore in such a scenario damage can be assumed to be substantial.
Flood zone Households people
Kulchasma 25 165
Table 14 number of households at risk in Kulchasma for a once in a generation event.
Flood risk zone Risk ($)
5year 30 year 100 year Total
Zone 1 6230 11070 5578 22878
Table 15 Flood risk in Kulchasma
5
Assuming that 50% of the flow breaks out of the river bed.
Conclusions
Total flood risk in Kulchasma is around 23000$.
Around 25 households are at risk of being affected by a once in a generation event in case the river breaks out. Due to high flood volumes damage will be substantial.
More frequent events (< five years) cause floods in the village due to canal overflow. Flood volumes are less, up to 5m3/s. Damage is moderate but risk relatively high due to high frequency of occurrence.
19
6
Pressures and impact
6.1 Arable lands
In the Obishur watershed about 20% of the area is dedicated to crop farming and approximately 17% of these arable activities are carried out on slopes. Given that the slope farming is an important determinant for soil erosion rates, agriculture is of lesser important as contributor to the sediment budget than pasture land management. This is amplified by the fact that in Obishur watershed a lot of cropping is taking place on historical terraces, which tend to have lower erosion rates.
Recovery potential of the crop lands varies from high to low, depending on the location and current state of degradation. The highest potential is in the downstream areas where soils are depleted but sheet erosion is low. The lowest potential is on those croplands with severe rill and/or gully erosion. The occurrence of these areas is indicated on the land degradation map of Obishur.
During the last 20 years a considerable degradation of arable lands took place due to cultivation of crop in unsuitable areas which is leading to soil erosion. Arable plots are situated on slope till 30 degrees and ploughed along the slopes. This facilitates rill erosion leading to washout of soil and nutrients. To make things worse, farmers practice trench digging along their plots, which can cause gully formation depending on the location.
The main cultivated crop is winter wheat, sometimes alternated with chick-pea and flax. Mono-cropping of these cultures leads to soil infertility and depletion of soil organic matter. Mineral fertilizers or manure is rarely applied, so that the effective nutrient balance over a cropping season becomes negative.
The consequences are that the crop yields became very low and in some cases not enough to cover the production costs. Yet farmers muddle on due to lack of perceived alternatives, to be self-sufficient and to provide their cattle with hay. This pushes them further in a vicious circle of poor production, land depletion and increased soil degradation and erosion.
In the Obishur watershed about 20% of the total surface is crop land. Approximately 17% of the cropland, or around 250ha, is situated on slopes, most of it in the transfer zone. Destructive agriculture on these slopes can boost the sediment run-off potential dramatically. Run-off rates of bare soil have been recorded that are a few orders higher compared to forested lands. Although the eroded soil
consists of fine material that likely will get flushed through the system, it has a negative impact on the transport capacity of the river flow. If concentrations of fine loess like material in the water increases, the river will be able to transport higher volumes of course debris, which we want to avoid. Therefore introducing improved agricultural techniques that cause less erosion is an important aspect of watershed sediment management.
Type of land Hectares
Cropland 1500
Cropland on slopes 250 (17%) Cropland in downstream zone 760 (51%) Cropland in transfer zone 740 (49%) Cropland in upstream zone 0
Orchards 70
20
The actual recovery potential of the crop lands varies from high to low, depending on the location and current state of degradation. The highest potential is in the downstream areas where soils are depleted but sheet erosion is low. The lowest potential is on those croplands with severe rill and/or gully erosion. The occurrence of these areas is indicated on the land degradation map (see annex 1, map 5).
6.2 Pastures
In general there are three types of pastures: spring, summer and permanent pastures. Spring pastures are located near villages and are confined to those areas that are not cultivated, such as fans, embankments, or areas not suitable for cultivation. When wheat has been harvested, livestock is grazing the crop residues on the summer pastures. Permanent pastures are located more upstream. Only a few communities in Obishur watershed have access to them (3 out of 10 villages). Villagers
further complained about pastures being converted into cropland or Dehkan farms. On the other hand upstream pastures are often not used by the communities. In Obishur watershed an area of around 30km2 was indicated as not used by village herds.
The pasture survey confirmed that heavy overgrazing takes place, as shown in table 17. The number of animals is on average two times more than the calculated carrying capacity. Interviews with livestock keepers revealed that on average the livestock herds are expanding with up to 5% per year, depending on the village, whilst on the other hand pasture areas are decreasing.
The grazing pressures have been determined for each community as part of the pasture survey. A map indicating local grazing pressures is presented in annex 1, map 6. Results indicate that the overgrazing rate varies widely per community. The actual grazing pressure ranges from 0.6 times to 7.2 times the carrying capacity of the pastures (see table 18). This
large spread is due to the fact that livestock herding is organized per community level. Each community has access to different grazing areas in the watersheds. The more fortunate villages can herd their livestock in permanent upstream pastures. The unfortunate ones have to rely on the fan areas in the spring and the crop lands in the summer, which are not real pastures.
The trends of increasing herds and decreasing pastures will aggravate in the future as the communities keep expanding. Upstream villages as Chargi-bolo and Sayod at this point still have reasonable access to pasture grounds. The grazing pressures are still below carrying capacity. However, these communities are
Item
Livestock Units 8000 Total pastures (ha) 3040 Permanent pasture (ha) 630 (or 21%) Spring pasture (ha) 1387 (or 45%) Summer pasture (ha) 1023 (or 34%) % livestock on permanent pastures 17%
Carrying capacity (LU) 3780 Average overgrazing factor 2.1
Village Pasture type
Spring Summer Permanent Chargi-bolo - 3.6 0.6 Sayod - - 0.8 Guliston 1 1.5 - Chargi-kalon 1.9 - - Chargi-poyon 3 1.8 - Dehlolo 1.6 6 - Kulchasma 1.5 5.7 - Ghofilobod 2.4 7.2 - Momandiyon Khosaboi (not surveyed) 2.9 - 4.2 - 1.5 -
Table 17 Obishur pasture situation
Table 18 Grazing pressure per village as fraction of carrying
capacity. For instance the carrying capacity on the summer pastures for Dehlolo is exceeded by a factor 6.
21
growing fast, at an average rate of 8% since 2003. If the expansion of the herds is in line with that of the population than the pressure on the grazing grounds will deteriorate rapidly, and with it the quality of the pasture grounds.
The productivity and quality of pasture lands is already low and the ongoing degradation is high, the causes of which are:
Absence of practicing rotational grazing;
high number of livestock units per hectare leading to overgrazing;
early spring grazing due to insufficient fodder stocking for the winter period; absence of overview of pasture quality/availability and grazing law enforcement.
Changes of the floristic composition and increase of inedible grasses further degrade the quality of the pasture lands. Currently large parts of pasture areas are covered with such species. This leads to a low productivity estimated at around 0.6 – 1.5 ton hay per ha.
Recovery potential of the pasture lands varies from high to low, depending on the location and current state of degradation. The pasture grounds of the villages Sayod and Momandion, around 500ha in the north of the Obishur watershed are heavily degraded and show signs of extreme sheet erosion. Recovery potential of these areas is low. Most of the upstream pastures have a low degradation rate with signs of moderate sheet erosion. They have a medium recovery potential. Grazing areas along the riverbeds and river gorges show signs of extreme degradation with outcropping of bedrock material. The recovery potential of such areas is extremely low. .
6.3 Forests and energy
In the past forests were wide spread in the region. Today they have been severely reduced. In the lower part of the watersheds, around the populated areas forests have completely disappeared. Forests are cut for fuel wood and only sometimes hawthorns can be found in those areas.
In the upper zone of the watersheds, in spite of popular belief, forests have never formed dens woodlands due to certain climate factors and strong relief ruggedness. But even here timber poaching can be seen and particularly of the young trees, which are more easily transported by donkeys. The most afforested is the middle part of the watersheds where the forests are located in the northern part of the steep slopes. Unsystematic cutting of trees (especially woody plants) led to forest thinning and poor possibility for regeneration of the wood species.
Grazing of the cattle on the forest territories makes reforestation difficult. The livestock eat rootstocks and young trees. Over the past 20 years the forest rehabilitation rates have been poor. It is expected that with the current forest degradation rate and lack of reforestation measures the forests can completely disappear in the nearest future. This will have dramatic consequences for the soil erosion rates of the slopes.
22 As long as people depend heavily on wood for energy sources the thinning of the forest and wood reserves will continue. Consistently it has been reported by the population of the Obishur watershed that they depend heavily on wood and manure cakes (tapak) for their energy needs (see table 19). Reportedly the children spend increasingly more time in fetching firewood, as they need to cover a larger distance to find the wood and brushes. This is demonstrated by the large number of donkeys that
can be observed in the upper zone, carrying (sometimes even fresh) firewood. Firewood shortage became a real issue for Muminabad after independence, when the gas and coal supply from the Soviet states halted and electricity supply became irregular.
In average the households consume 30m3 of wood per year for heating and cooking. The total number of households in the watershed is around 1250. This implies that the annual consumption of wood is about 37’500m3
. The natural increment for small-leaf forests in Tajikistan is 3-5 m3 per ha per year. This means that an area of around 100 km2 covered by forest is needed to supply the inhabitants of Obishur watershed with fuel wood, without destroying the forest. In contrast, there is only approximately 8km2 of forest and 22km2 of lower yielding bush land.
To reverse the trend of clearing bushes and cutting trees in an irresponsible way, energy saving devices and alternative energy sources can make a contribution in the reduction of erosion. The cow manure plays an important role in household energy supply, however burning manure instead of taking it back to the field goes at the expense of soil fertility and its water holding capacity and eventually also contributes to low crop yields.
Energy source Quantity used Average (range)
Wood (m3) 12.5 (10-20) Shrubs (bundles) 113 (60-200) Manure cakes (pieces) 702 (200-2000) Electricity (KWatt hours) 1122 (1000-5000)
Table 19 Energy sources and quantities used at
23
7
Proposed actions
Given the nature of the natural disaster risk described in chapter 5 and its underlying causes described in chapter 6, it is evident that both short term mitigations works and long term prevention actions are required. In particular actions in the following five themes are proposed: (i) mitigation infrastructure, (ii) pasture management, (iii) conservation agriculture, (iv) energy efficiency and (v) reforestation.
Activity implementation will be a mix of project supervised and sub-contracted to a local implementer and in special cases, e.g. where knowledge is not readily available as with Conservation Agriculture practices and low cost fencing, the activity will be implemented by the PSU in strong partnership with the local population and land users.
The IWSM Project Trust Fund provides an opportunity for implementation of 7.5 projects for Obishur. Each project has a budget ceiling of 60.125 TJS. The minimum contribution for each project demanded from the community is 15%. This can be in cash or in kind, through materials or labor provision. The protective infrastructure can be financed through pooling of two or more projects.
The implementation of the projects will be outsourced where appropriate and if this is not possible because it needs special expertise, it will be carried out by the Caritas PSU. For outsourcing the Caritas tender system will be used and at all times project implementation will be carried out with supervision of the PSU and the beneficiaries. In all projects ownership and the longer term responsibilities (e.g. maintenance) will be considered as a factor.
24
7.1
Mitigation
#O1 MITIGATION
1. WHAT Replacement of blocked culvert and bridge repair
2. WHERE On the canal, near the Kulchashma-Gesh junction, 2km north of Kulchasma. (see map 7, annex 1)
3. HOW (1) PSU: Finalize design and bill of quantity, develop maintenance plan (2) PSU: outsource implementation through tender system, Hukumat/wodchoz to organize own contribution of minimum 15% of budget (3) PSU supervision jointly with Jamoat/CSC, (4) official handing over to Wodchoz/Jamoat, who will be both responsible that maintenance is carried out. 4. EFFECT The culvert will channel discharge from the north side of the fan directly into the Surgh river.
Now this discharge flows into the canal and causes floods in Kulchasma because it exceeds the canal’s capacity. The impact of the culvert is mitigation of 5yrs floods and strong reduction of the 30yr and 100yr. Mitigated risk is around 10000US$.
5. RISKS The main risk lies in the design and execution of the structure. Good design and execution of steel and concrete works are needed to ensure longevity of the structure. Since the culvert will be around 2x2m, blockage to sediment accumulation is not expected.
6. WHO Local contractor under supervision of Caritas.
7. WHEN Implementation schedule: November/December 2012 Design and planning, April 2013 tender, May 2013 Construction of culvert.
8.
BUDGET
25
7.2 Pasture management
#O2
Improved Pasture Management through Village Livestock Committee (VLC) establishment1. WHAT Improve the quality of the mostly degraded pastures in the upper zone of the watershed through establishment of VLC in each village. Options are reducing the number of animals, increase pasture area and yield through road rehabilitation or installing water points, controlled grazing (restricted period/rotational grazing) and growing fodder crops. Training and coaching of VLCs is main strategy.
2. WHERE VLCs will be established in all villages that use pasture land inside the watershed, Kulchasma, Ghofilobod, Guliston, Dehlolo, Chargy poyon, Chargy bolo, Momandiyon, Chargy kalon, Sayod and Khosaboi. For infrastructure priority will be given to the villages that have presently no access to permanent pasture and/or have high pressure on permanent pasture and are located in the transfer zone, in the areas with high potential for run-off reduction. Sayod, Chargi-poyon, Chargi-kalon and Momandyon.
The highest natural disaster risk is situated in Kulchasma/Kulchasma Bolo (see chapter 5 natural disaster risk). Communities with pastures in its drainage area (sub-watershed w480/w470) are Sayod, Momandiyon and partly Chargi Kalon. Around 400ha of permanent pasture of Momandiyon and Sayod are located on heavily eroded soils. Chargi-Kalon is herding cattle on an area of around 300ha of steep landslide prone slopes with moderate sheet erosion. (see map 8, annex 1). Improving land cover in that area will results in improved infiltration capacity of the soil and reduce rainfall runoff and soil loss.
3. HOW PSU will design trainings and demonstrations, produce handouts and training modules. Implementation by Livestock Association in partnership with Jamoat agronomist and Land-use department. Beneficiaries of the training will be committee members, herders, owners of livestock keeping Dehkan farms. Together with the Land use department of Jamoat a village pasture use agreement will be elaborated, stating maximum stocking rate, pasture management plan, fees to be paid to Jamoat and duration of the contract (20years). This contract will be signed between VLC and Jomoat, who will supervise reinforcement of the agreement.
Steps: Establish committee and train VLC members, Negotiate agreement with Jamoat to secure village pasture use, Train and coach VLC members, Develop Village Pasture Management Plan, Establish water points for animals, shade and do road rehabilitation, Monitoring for impact and learning
4. EFFECT Short term effect of this activity will be that VLCs are established who will take better control over the way the communal pastures are managed, awareness is raised on the negative effects of the present pasture use of the village herds, alternative management options are known to VLCs and villagers and infrastructure (water-points/roads) needed to access the available pasture lands, is in place.
On mid-term this will improve the yield and the quality of the pasture land and enhance soil coverage on at least 50% of the watershed pastures (1500ha). Through this change in coverage, the infiltration of rain water will increase and hence the volume of water run-off from slopes will decrease. The reduction of run-off that can be achieved by this measure is estimated at 5% initially. The effect will increase gradually, as it needs time (2-3 yrs) to reach maximum ground cover. The reduction of run-off water which eventually will lead to less soil
26
loss and floods downstream is expected to be reached within the same 2-3 yrs.
On a longer term (10) yrs, the effect will slowly increase because (1) organic matter build up in soils is naturally slow and the improvement of the water holding capacity will thus also improve slowly and (2) the project has limited funds for infrastructure, but it is expected that this good example will be copied through self-help efforts by other villages or with help of other donor support, once farmers experience the benefits. The improved pasture land area could then double and combined with the longer term effect of infiltration capacity improvement; this should lead to a reduction of 10% runoff in the Obishur watershed. The livestock keepers themselves will benefit directly from faster growth of their animals, increased number of off-spring and more milk, leading to increased income from livestock keeping. Logically the additional off-spring they get through these measures should be disposed off and not added to the village herd and increase the pressure on the pasture lands. 5.RISK The risks related to this activity implementation are
it can be difficult to reach an agreement to secure access to communal pasture land for the next 20 years, as more and more private land-users put claims on pasture land;
in bigger villages the number of people participating may become too large and it may be difficult to make decisions as there can be conflict of interest.
To minimize the risks, the PSU will closely monitor whether the pasture law is being followed and encourage the Jamoat to take up their role, as reaching an agreement with VLCs can facilitate fee collection which is to the benefit of the Jamoats. The group size can be limited by organizing 2-3 herds in one village and by involving the imam, to enhance unity in the villages.
6. WHO PSU, Muminabad Livestock Association, Jamoat agronomist.
7. WHEN November 2012-November 2013. Implementation schedule: November 2012 Design and planning, December training on VLCs, January VLC establishment and further training on pasture management plan. Further technical training, following livestock calendar. Demo’s on fodder crops and infrastructure establishment, spring 2013.
27
7.3 Conservation agriculture
#O3
Conservation Agriculture (CA) training and demonstrations
1. WHAT Conservation Agriculture training and demonstrations for landowners in the transfer zone. It entails crop farming that (1) respects Good Agriculture Practices, including minimum tillage. (2) use of crop rotation and (3) keeps the soil covered year round (for at least 30% of the surface).
2. WHERE Priority areas for conservation agriculture are arable land on slopes higher than 7degrees. Around 200ha of such cropland is situated in the sub-watersheds w380 and w270 (annex I, see map 9).
3. HOW Introduction of CA practices among crop farmers. PSU will design trainings and on-farm demonstrations, produce handouts and training modules. Implementation by PSU in partnership with Jamoat agronomist, Biotech and Khuzai Zarrin, the Muminabad based seed associations. Beneficiaries of the training will be local agronomists, innovative farmers, land users and tractor drivers. For reinforcement of sustainable land management practices, the Land use department of Jamoat will be engaged.
4. EFFECT In the short term, farmers and tractor drivers will be motivated to adopt CA practices, because of the training of farmers, field demonstrations and reinforcement of existing SLM regulations.
In the mid-long term these practices will increase the soil organic matter and increase infiltration capacity and thus reduce water run-off from slopes. Over time it will reduce erosion and the volume of water downstream. The action directly contributes to flood risk reduction for the communities of Kulchasma Bolo (south part) and Guliston. Farmers will benefit from higher yields and increased income.
5.RISK The risks related to this activity implementation are
drought during the growing season and the demonstrations will not show the intended results.
This can be minimized by demonstrating also CA measures that are less depending on rainfall and choose varieties that are drought resistant.
6. WHO PSU, Jamoat agronomist, Biotech and Khuzai Zarrin
7. WHEN Implementation schedule: November 2012 Design and planning, Training January 2013 onwards, following crop calendar. Demo’s spring 2013
28
7.4 Energy efficiency
#O4
Energy Efficiency campaign
1. WHAT Implement EE campaign, for all household inside the watershed, that will promote reduction of fuel consumption (wood, bushes and manure cakes). The whole spectrum of available energy saving technologies relevant for Muminabad will be promoted. Special focus will be on upgrading of cook stoves by fitting a steel plate to cover the otherwise open front and upgrading the commonly used heating stove with a heat exchanger. Formation of energy clubs will be promoted to facilitate exchange of experiences about the most effective ways to save energy on household level. Group bread baking will be one of the promoted activities. A competition element will be built into the campaign, with attractive prices for the household/club which manages to realize the largest energy saving.
2. WHERE The EE will be conducted in all villages of the watershed, Kulchasma, Ghofilobod, Guliston, Dehlolo, Chargy poyon, Chargy bolo, Momandiyon, Chargy kalon, Sayod and Khosaboi. 3. HOW PSU will design an EE campaign, consisting of advertisements, awareness raising meetings,
trainings and practical demonstrations. Handouts, training modules and demo packages will be prepared. The campaign will be put up for tendering, whereby preference will be given to a local organization for implementation, e.g. Public Women organization Zamzam, who has already trained female EE promoters and who would be in a good position to implement this EE campaign at low costs. Beneficiaries of the training will be all heads of households of the villages inside the watershed and teachers of elementary schools.
4. EFFECT Short term effect is that households inside the watershed adopt EE technologies which will reduce the firewood, brushwood and manure cake consumption.
On the mid-long term land coverage will improve as less firewood will be collected in the upper part of the watershed and in the longer this will increase infiltration of rain water and decrease the run-off from slopes. This will in turn reduce erosion and the volume of water downstream, reducing the risk of flooding for the downstream villages. A side effect of introducing EE measures is that less time is needed for fuel wood collection, which can then be utilized for more productive activities. For those who actually buy wood-fuel there will be a benefit in terms of a reduction on the household expenditure. The upgraded cook-stove produces less smoke and has a positive effect on health for the women.
5.RISK The risks related to this activity implementation are
a soft winter will show less spectacular effects in terms of savings;
women have a high daily workload and are not always available for training or hands-on workshops.
To mitigate these risks, in the campaign we will work with female EE promoters who have experience with the technologies in their own homes and they will focus on the labour saving aspects of adopting the technologies.
29
7. WHEN November 2012-March 2013. Implementation schedule: November 2012, design and tendering. December training of EE promoters. January 2013 onwards EE activities implementation by local organization.