HAL Id: hal-01084110
https://hal.sorbonne-universite.fr/hal-01084110
Submitted on 18 Nov 2014
HAL is a multi-disciplinary open access
archive for the deposit and dissemination of
sci-entific research documents, whether they are
pub-lished or not. The documents may come from
teaching and research institutions in France or
abroad, or from public or private research centers.
L’archive ouverte pluridisciplinaire HAL, est
destinée au dépôt et à la diffusion de documents
scientifiques de niveau recherche, publiés ou non,
émanant des établissements d’enseignement et de
recherche français ou étrangers, des laboratoires
publics ou privés.
A three dimensional thermoplastic microfluidic chip for
robust cell capture and high resolution imaging
Guillaume Mottet, Karla Perez-Toralla, Ezgi Tulukcuoglu, Francois-Clement
Bidard, Jean-Yves Pierga, Irena Draskovic, Arturo Londono-Vallejo,
Stephanie Descroix, Laurent Malaquin, Jean-Louis Viovy
To cite this version:
Guillaume Mottet, Karla Perez-Toralla, Ezgi Tulukcuoglu, Francois-Clement Bidard, Jean-Yves
Pierga, et al.. A three dimensional thermoplastic microfluidic chip for robust cell capture and high
resolution imaging. Biomicrofluidics, 2014, 8 (2), pp.024109. �10.1063/1.4871035�. �hal-01084110�
A 3D thermoplastic microfluidic Chip for robust cell capture and high
resolution imaging
Guillaume Mottet,
1,a)Karla Perez-Toralla,
1)Ezgi Tulukcuoglu,
1)Francois-Clement
Bidard,
3)Jean-Yves Pierga,
3,4)Irena Draskovic,
2)Arturo Londono-Vallejo,
2)Stephanie Descroix,
1)Laurent Malaquin
1)and Jean Louis Viovy
1)1
Institut Curie, UMR 168, 11 rue Pierre et Marie Curie, 75005, Paris, France
2
Telomeres & Cancer laboratory, Institut Curie, UPMC Univ. Paris 06, Equipe Labellisé « Ligue », Paris, France
3
Department of Medical Oncology, Institut Curie, Paris, France
4
Université Paris Descartes, Paris, France
We present a low cost microfluidic chip integrating 3D micro-chambers for the capture and the analysis of cells. This device has a simple design and a small footprint. It allows the implementation of standard biological protocols in a chip format with low volume consumption. The manufacturing process relies on hot-embossing of Cyclo Olefin Copolymer (COC), allowing the development of a low cost and robust device. A 3D design of microchannels was used to induce high flow velocity contrasts in the device and provide a selective immobilization. In narrow distribution channels, the liquid velocity induces a shear stress that overcomes adhesion forces and prevents cell immobilization or clogging. In large 3D chambers, the liquid velocity drops down below the threshold for cell attachment. The devices can be operated in a large range of input pressures and can even be handled manually using simple syringe or micropipette. Even at high flow injection rates the 3D structures protects the captured cell from shear stress. To validate the performances of our device, we implemented Immuno-Fluorescence labeling and Immuno-Fluorescence in Situ Hybridization (FISH) analysis on cancer cell lines and on a patient pleural effusion sample. FISH is a FDA approved cancer diagnostic technique that provides quantitative information about gene and chromosome aberration at the single cell level. It is usually considered as a long and fastidious test in medical diagnosis. This process can be easily implanted in our platform, and high resolution fluorescence imaging can be performed with reduced time and computer intensiveness. These results demonstrate the potential of this chip as a low cost, robust and versatile tool adapted to complex and demanding protocols for medical diagnosis.
2
I. INTRODUCTION:
Immobilizing cells or tissues on glass slides is the common way of performing cytological analyses in biological laboratories and hospitals. Glass slides are cheap, easy to use and benefit from a large variety of well-established surface treatments. However this approach suffers from rather laborious and time-consuming protocols that require large quantity of reagent. Some robots are available1, but they are usually expensive and do not solve the reagent consumption problem above. Implementation in microtiter plates allows higher automation and some level or reagents saving2, but this approach requires the parallel processing of a large number of samples, which is not often well adapted in a clinical setting, in which the diagnosis procedure must follow as closely as possible the rhythm and requirements of the patients’ status and treatment, and not the reverse. Microfluidics is expected to bring strong improvements and new added value to these techniques3: reduction of reagents and samples volumes, high automation at low cost, better control of fluid flows, improved reproducibility, new perspectives as real-time studies at the single-cell level, and a better flexibility regarding samples processing agenda. However, the microsystems developed so far are often complex to operate, requiring specific knowledge and also specific fluidic platforms like sensitive syringe pumps, valves or electrical devices which are not compatible with standard devices used in hospitals4. Furthermore, most of microsystems are based on the polydimethylsiloxane (PDMS) materials which are not suitable for mass-production or long-term storage in ambient conditions5. In light of this observation, our aim is to propose a low cost and easy to use chip that could be used in routine by medical doctors and biologists
.
A large variety of microfluidic devices have been developed for cell analysis. These devices aim at providing a selective capture of cells in specific areas permitting their stimulation and observation. For that purpose, methods based on biochemical interaction or physical confinement have been used to provide a selective and spatially controlled cell capture. In the latter case, different strategies were proposed to catch cells in specific locations, such as mechanical traps6,7, dielectrophoretic force8,9, micro-robots10,11 or optical force12. All these microsystems require rather complex manufacturing processes and/or external devices (laser, electronics devices), making them difficult to implement in hospitals or biology laboratories. Other strategies rely on specific surface treatments inside microfluidic channels to selectively attach cells. Most commonly used adhesion molecules are fibronectin13,14, poly-L-lysine14,15 and antibodies16,17. Antibodies have the advantage of specifically targeting a cell type but they are rather expensive. This approach also requires to locally pattern the capturing antibodies in a specific area which makes the chip fabrication more complex18,19. An elegant method using fibronectin coated surface has been recently proposed by Delamarche et al.20. The design uses a combination of microfluidic channels with different widths that provide regions with different flow velocities. At a critical pressure, the flow velocity contrast between
3
the two geometries induces a localized cell attachment in the low velocity areas. This system yielded convincing results, but it involves a large footprint, a complex architecture to provide a homogeneous spreading of cells inside the chamber. Furthermore, because of the relatively low flow velocity contrast this device requires an accurate control of the threshold velocity to guarantee a selective cell attachment. This is also critical to preserve cells from high shear stresses appearing in small dimension channels21 that may damage or detach the cells.
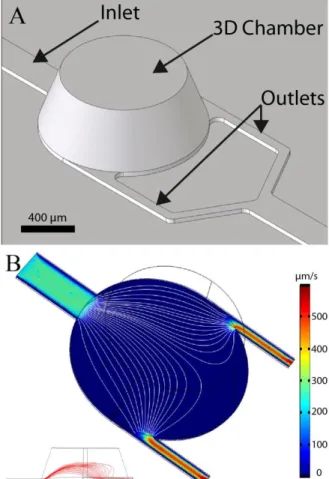
To address the above issues we propose an innovative solution that relies on a 3D chip design to create a flow velocity contrast and a selective cell attachment (Fig. 1). The approach takes benefit from latest innovation in the field of micromilling and replication technologies. It involves a 3D capture chamber connected to low profile injection channels. Because of a tremendous enhancement of flow velocity distribution into the 3D geometry as compared to the other part of the device, this approach creates a flow velocity contrast that pushes the balance between adhesion forces and shear stress in favour of cell-surface interaction thus increasing the probability for a cell to adhere. This approach enables to selectively capture and process cells in the 3D chamber with a high flow rate in less than 15 min with a simple syringe or a micro-pipette. Furthermore, this design provides a homogeneous spatial distribution of the immobilized cells in the capture chamber (making microscopic observations easier) and an efficient reduction of shear stress that might be detrimental for cells. It is important to notice that the workflow does not involve any centrifugation steps such as the cytospin method used to concentrate cells on a specific area of the slide22. Finally, the 3D shape provides a small device footprint, thus enabling the multiplexing of the microfluidic channels to conduct the multiple experiments in parallel. To validate the 3D chip design we implemented two different biological analyses: an immunofluorescence (IF) analysis used to detect targeted molecules through antibody labelling and a more complex protocol called Fluorescence in Situ Hybridization (FISH)23. FISH protocols are employed to reveal the presence of genomic or chromosomal aberrations of a cell, thanks to the use of fluorescent DNA probes. These processes are usually long and fastidious and very few examples of whole FISH experiment on-chip can be found in the litterature24–26. Finally, to confirm the ability of our chip to process clinical samples from patients, a FISH analysis with a pleural effusion was performed.
II. Experimental
A. Cells cultivation and preparation
Cancer cell lines G401 (kidney) and SKBR3 (breast) were grown in Minimum Essential Medium (Invitrogen Life Technologies) containing 10% heat-inactivated FBS (Invitrogen), 500 U/mL penicillin, 500 µg/mL streptomycin (Invitrogen)
4
at 37°C in a humidified 5% CO2 atmosphere. Cells suspensions were prepared as follows: cells were detached from the flask surface by incubating them with a 0.25% Trypsin-EDTA solution (Sigma-Aldrich). Trypsin was then inactivated by adding an equal volume of cell culture medium. The cell suspension was washed two times with phosphate buffered saline solution (PBS, Invitrogen) using centrifugation, before cell concentration was adjusted to 1 to 3 million cells /mL in PBS. Volumes ranging from 5 to 10 µL of cell suspension were used for injection. The cell concentration influences the number of cells inside the chamber. Typically, for a concentration of 1 million cells/mL, a chamber captures around 500 cells (see supplementary data fig. SI-127), and the number of cells captured per chamber for an initial concentration of 3 million cells/mL is between 800 and 1000 (Fig. 4).
B. Chip fabrication and surface treatment
We chose Cyclo Olefin Copolymer (COC, TOPAS) as a thermoplastic material for the device fabrication28. This material is optically transparent and enables high magnification optical microscopy. Its chemical and thermal resistance allow the implementation of complex biochemical protocols. This material is also FDA approved. Hot embossing was used for COC chip manufacturing. This low cost and simple replication process is well adapted to rapid prototyping while being easily amenable to massive industrial production. Replication of 3D structures in the COC chip was done using an aluminium master mould (Fig. 2) obtained by 3D micro-milling (Minitech Machinery) using a 100µm milling tool. COC substrates (5mm thickness, 8007 TOPAS Advanced) were embossed at 130°C with an equivalent pressure of 1 kg/cm² during 8 min (Specac hydraulic press) and finally cooled down quickly at room temperature. After separation from the mould, the resulting COC was drilled to define inlets and outlets. Sealing of the chip was performed by laminating a thin 145 µm COC sheet (8007,TOPAS) following a solvent assisted bonding process that we published previously29. To finish, Teflon tubes were plugged to the inlet and the outlet and secured in place by epoxy glue. The chips such prepared could be stored at room temperature in a dust-free for at least 6 months. To enable cell capture on COC, a surface coating was performed on the whole channel surface. 100 µL of a 2% Hydroxyethyl Cellulose solution diluted in water was first injected to turn the hydrophobic surface of the COC to hydrophilic. After one hour, the chip was rinsed with 100 µL of a deionised water solution. Then, 50 µL of poly-L-lysine solution (0.1% in H2O, Sigma-Aldrich) were injected and incubated during a minimum of 4 hours at 37°C to promote cell adhesion. Finally, the chip was rinsed with 100 µL of PBS and dried. Chips with this surface treatment and filled of water could be stored at 4°C during one week.
5
IF experiments were achieved using a commercial mouse monoclonal antibody targeting Cytokeratin proteins (Cytokeratin clones AE1/AE3, Dako, 100µg/mL). Labelling was performed using Zenon Alexa fluor 555 (Life technology) adding a fluorescent label directly to the primary antibody. A 100 µL of BSA (1% diluted in water) solution was injected in the chip as a blocking reagent prior to the introduction of 10 µL of labelling antibodies and 30 min incubation. The chip was then washed with 100 µL of 1X PBS solution. During this washing step, 5 µL of DAPI (Fluorescent DNA intercalating, Life technology) was diluted in the PBS solution to selectively stain cell nuclei.
D. FISH experiments
A commercial FISH kit currently used for cancer diagnosis was used (Poseidon FISH kit, KREATECH). This FISH kit targets the HER-2/neu gene locus and the centromeric region of chromosome 17. The standard protocol was optimised for microfluidic conditions and COC material (Work to appear). After cell trapping within the 3D chamber cells were washed with 100µL of SSC (Saline Sodium Citrate, 2x) buffer and treated for 10 min with 50 µL of pepsin solution (0.1 mg/mL) at 37°C. The chip was then rinsed with 100 µL of PBS and 100 µL of SSC (2x) solutions. This step is implemented to remove the digested cytoplasmic debris and to inhibit the enzymatic activity of pepsin. Then, cells were fixed by injecting 50 µL of Acetic acid/Ethanol (1:3 v/v) and incubated with no flow during 20 min at 4°C. A washing step was performed with 100 µL of SSC during 20 min at 37°C. Next, 5 µL of probe solution (containing two colours labelled DNA complementary to the HER2 gene and the centromeric region of chromosome 17 respectively) was injected. The chip was then heated up to 75°C on a hot plate for 15 min to induce genomic DNA and probe denaturation and incubated overnight at 37°C for hybridization. The following day, a post-hybridization washing steps were performed with 100 µL of solution I (0,4x SSC +0.3% NP40) at 72°C during 5 min first and then with 100 µL of solution II (2x SSC +0.1% NP40). Finally 10 µl of Vectashield mounting solution with 1 µg/mL of DAPI (Vector Lab.) was injected to stain the nuclear DNA and prevent fluorophores quenching.
E. FISH on a pleural effusion sample
To demonstrate the efficiency of this chip to process a medical sample, a pleural effusion was studied. As cancer cell lines often display less heterogeneity and higher HER2 amplification levels than observed in clinical samples30, we then wanted to demonstrate the efficiency of this chip to process a medical sample. We analysed a pleural effusion that was drained from a metastatic HER2-amplified breast cancer patient as part of the standard management of symptomatic pleural effusion and after the patient consent. From around 1L of pleural effusion drained, 10 mL were aliquoted and centrifuged
6
(1000 rpm, 5 min) to concentrate the cells and re-suspend them in 1 mL of PBS. From this latter solution, 10 µl were injected into the chip and a FISH experiment was performed.
F. Instrumental setup, imaging and computer simulation
The flow inside channels was generated either manually, either using a micropipette, a syringe (see an image in supplementary data Fig. SI-327), or a pressure controller (MFCS31, Fluigent). High resolution images and movies were recorded on an inverted microscope (Eclipse Ti, Nikon) equipped with a CCD camera (Cool SNAP HQ2, Photometrics). For the FISH experiment, 3-D images stacks were captured on a Leica epi-fluorescence microscope equipped with a piezo-stage and 100x oil immersion objective. Images of cell nuclei were captured with a DAPI filter, centromeric probes on chromosomes 17 with a FITC filter and HER-2/neu probes with a Rhodamine filter. Image acquisition was performed through Metamorph platform. Image processing was achieved using ImageJ software. To determine the number of cells inside the chamber, we used also the ImageJ software with the plugin “cell counter”. Hydrodynamic and flow velocity simulations were done with finite element software COMSOL 4.0 and the 3D microfluidic module.
III. Results and discussion
A. Design optimization
The chip design is composed of four specific round chambers (1 mm diameter, 350 µm heights) connected to one inlet in the centre of one side and two outlets on the opposite side (Fig. 3.A). The conical shape of the 3D chambers was decided to facilitate milling of the master and demolding of individual chips, and to limit the risk of recirculation areas and stagnation points in the chambers. First we investigated the spatial distribution of captured cells in the device in order to compensate for the typical limitations of glass slides where the spatial distribution of cells is random and relatively non-homogeneous. Imposing a well-defined cell trapping area and improving the cell attachment distribution are both critical parameters to facilitate optical observation and characterization of cells. The flow velocity simulation in the capture chamber shows a relatively homogeneous flow distribution (Fig. 3.B). Indeed, thanks to its round shape geometry, the in-plane streamline density is relatively homogenous on a large part of the chamber.
The second objective was to provide a simple and robust fluidic platform that would be able to induce reproducible and selective cell trapping. As mentioned earlier, the use of a deep 3D chamber provides a significant decrease in the flow
7
velocity and hydrodynamic drag as compared to injection channels. Contrary to the previously reported approach that relies on channel enlargement, this 3D device combines a large volume together with a limited footprint. The difference of thicknesses between the injection channels (height= 30 µm) and the capture chamber (height= 350 µm) induces an abrupt deceleration of the laminar flow (Fig. 3.B, Tab. I). This flow velocity contrast can be exploited advantageously to induce a selective immobilization of cells. In the narrow injection channels, the flow velocity is high and the shear stress induced on the cell is sufficient to overcome adhesion.
B. Cell trapping experiments
Our objective is to propose a simple and robust process for selectively catching and maintaining cells inside the chambers. Experimental observations performed with fibronectin coated channels showed that under a critical threshold flow velocity around 100 µm/s, cell adhesion is possible20. Above this value the shear stress in the vicinity of the channel walls (4.10-2 dyn/cm²) is sufficient to cause cell detachment. Based on these observations, two strategies may be considered to provide a selective immobilization process. A first strategy is to work in a continuous flow mode and to impose a flow velocity inside the capture chamber below this critical value. While cell attachment occurs in the chamber, the flow acceleration in the injection microchannels avoids cells deposition. This strategy has proven its efficiency, but it requires an accurate control of the flow rate through expensive master flow controller system or automated syringe systems.
In order to reduce the constraints related to the development of an external fluid handling device, we proposed a simpler strategy that relies on a three steps workflow: a cells injection followed by 5 min incubation with no external pressure, allowing cells to sediment and attach to the surface and finally a washing step (See Fig. 1). A typical result of this process is shown in figure 4: more than 1000 cells/mm² were trapped in each chamber with a relatively homogenous distribution, while no cell is observed inside channels (Fig. 5). The chip has 4 capture chambers, so that more than 3000 cells are trapped. This amount is sufficient for the statistics required in clinical diagnosis.
This result is made possible by the specificities of the 3D design and process. During the injection of cells suspension, the mean flow velocity in the whole device is too high to allow for cell deposition (Fig. 1, Fig. 6). Moreover, both experimental observation and COMSOL simulation revealed that the Poiseuille flow distribution within the 3D chambers tends to drag cells to the middle high of the chamber so, far away from the surface (streamlines in Fig. 3.B). These comb ined effects thus limit cell attachment during injection. Cell attachment occurs during the incubation step, in which no external
8
pressure is applied in the system. Even in the case of a residual flow rate in the device, caused by a small difference of hydrostatic pressure between the inlet and the outlet, the mean flow velocity inside channels is too high to permit cells attachment (Fig. 7). However, within the chambers, the drastic decrease of flow rate permitted by the 3D structure (below 20 µm/s) enables cells sedimentation and attachment to the surface (Fig. 7). Thanks to this, even the small number of cells remaining in the channels at the end of sample injections is collected and sedimented in the chambers in less than 1 minute. In addition, in case of a residual nonspecific cell attachment within channels, cells can be further removed easily during the washing step thanks to the high flow rate in these channels. This simple strategy provides a very flexible and robust platform. Correlations between experimental observation and simulation show that, in our case, the critical flow velocity can be estimated around 20µm/s (see supplementary data Fig. SI-227). This value is lower than that reported in literature for pure fibronectin coatings. This difference may be explained by our use of a different coating for the COC surface. This treatment relies on a combination of HEC and PLL coating, which may provide lower adhesion forces.
C. Flow experiment in 2D extrusion chip versus 3D chip
To better illustrate the advantages of the 3D shape device we compared its performances with those of a 2D extrusion device with a similar design. In this latter case, the height of both channels and chambers were kept constant all over the device (30 µm). COMSOL simulation revealed that the use of a 3D design provide speed ratio between chamber and channels up to 25, as compared to 5 for an equivalent 2D design (Fig. 8 and Tab. I). Furthermore, this large difference of speed can limit the influence of the shear stress force on the captured cells, thus protecting them from mechanical strain (Fig. 8). The shear stress could be detrimental for the cell integrity, and it may also affect cell properties32. To confirm these simulations, a comparison of experiments performed in both configurations is shown in figure 9. The results show that in a 0 to 800 hPa pressure range, the number of cell captured in the 3D chamber remains stable (>90%). In this system, the average shear at the wall in the chambers is <10-2dyn/cm². In the case of a 2D design, the flow velocity causes cell detachment even for a low injection pressure (~15mbar). For an injection pressure around 100hPa only 20% of the initially attached cells remain in the 2D chamber. The average shear at the wall in the chambers at this inlet pressure is already 4.10-2dyn/cm², higher than at 800 hPa in the 3D design. These results strengthen the interest of 3D chips, which provide a robust capture device and also preserve cells from high shear stress. Fig 9 also shows that, in contrast with the 2D chip, the 3D chip captures more than 97% of the cells along two orders of magnitude of flow rates: this is important to avoid shear-induced bias of capture, which could for instance create a bias in characterization between more or less flow-resistant cells. Finally thanks to the robustness of capture pattern and efficiency to flow rate, injection using a syringe (delivering a mean pressure value around 1 hPa) can even be
9
performed manually while providing a reproducible cell capture inside 3D chambers. The 3D design thus provides more robustness and flexibility, and broadens the portability of the platform.
D. Application to biological analysis
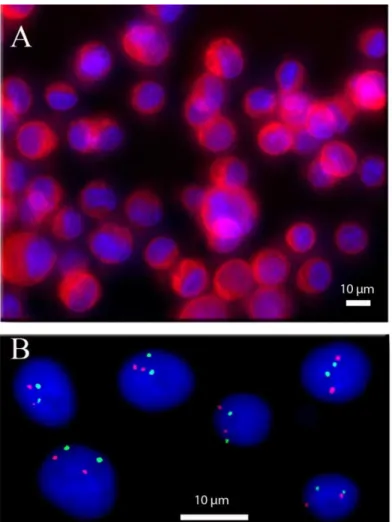
Immunofluorescence (IF) analysis is a common process to label a molecule of interest (e.g. proteins33,34). It is generally based on a first antibody that targets the molecule of interest and on a second antibody linked to a fluorophore and directed against the first antibody. IF analysis is usually an expensive method (mainly due to the price of reagents) but is highly sensitive and it provides both quantitative and spatial information, e.g. regarding the distribution of the target antigen within the cell. We implemented IF experiments inside this 3D chip by selectively targeting the cytokeratin proteins on SKBR-3 cell lines. The AE1/AE3 pancytokeratin antibody is used to recognize epithelial cells. It is commonly used to detect circulating and disseminated breast tumour cells35. Figure 10.A shows an example of fluorescence images taken after the immobilization and labelling of SKBR3 cell lines. The images show both a low background signal and a good images quality. This confirms the compatibility of the device with immunofluorescence labelling protocol. Noteworthy, at high cells densities we could observe some vertical cell overlap. Many cancer cells from solid tumours have significant cell-cell adhesion, due to their epithelial origin, and may constitute small cellular aggregates, a property indeed dependent on the nature of the cancer36. For instance, some clusters involving a few cells can be seen in fig 10A or 11. Our device tends to prevent the attachment of large aggregates, because the increase of friction arising both from the increased friction coefficient and increased flow at distance from the wall tends to drag away these big aggregates. Thus, our chips do not fully prevent cells images overlap, but are still significantly better than conventional glass slides, at comparable cell densities. Thanks to the high quality of images, it is in general possible to optically segment these small aggregates into individual cells (the ideal for that being confocal microscopy, which is also possible in our device). In the worst of cases, the aggregates leading to ambiguous cells identification can be discarded in the analysis, as done in conventional glass slide FISH.
In addition to IF analysis, FISH experiments were also performed. FISH is a FDA approved diagnostic technique, commonly used in hospitals to characterize cancer cells37. It is, however a rather long and fastidious process that requires sequential injection and incubation of numerous different reagents at well controlled temperatures. It is also an expensive process due principally to the price of fluorescently labelled DNA probes. Automated robots that perform the different incubation steps were developed, but they are themselves expensive, and they do not reduce the cost of consumables. Microfluidics offer unique opportunities to reduce sample and reagents volume and automate this experiment, thus
10
decreasing the cost of experiments while improving its reproducibility. Typical images of the implementation of the FISH protocol on cancer cell lines are shown in figure 10.B. The assessment of HER2 amplification status is a routine diagnostic test in breast cancer, since HER2-amplified breast cancer are eligible for anti-HER2 targeted therapies; the HER2/centromeric ratio, as performed here, is the gold standard technique for this assessment on cytological samples from patients38. The red dots show the presence of HER2 gene while the green dots reveal the centromere of chromosome 17 (C17). Both a high signal to noise ratio and a low fluorescence background are essential to perform accurate counting and estimation of the HER2/C17 ratio. The image analysis results are comparable with standard FISH performed on glass slide (see supplementary data Fig. SI-427 to see the same FISH experiment made on a glass slide). Furthermore, the high density and uniformity of cell density in the chambers help to reduce acquisition time. The good quality of these results has enabled us to make a FISH experiment directly on a medical sample. The medical sample was a pleural effusion from a patient with a HER2-amplified metastatic breast cancer. The results showed in figure 11 highlight the presence of cancer cells in the sample (polysomy and the presence of the amplification of gene HER2). These results confirm the compatibility of our chip with clinical samples, and its ability to give high quality images.
In addition, we also demonstrated a strong reduction of the amount of reagent solution needed. For the washing steps the standard volume necessary in a glass slide format, is around 50 mL. In our 3D chip only 100 µL are required, i.e. 500 times less. For expensive reagents like antibodies solution or FISH probes, the differences in volume are 10 times (10µL versus 100µL) and 2 times (5µL versus 10µL), respectively.
IV. Conclusions
The first aim of our project was to elaborate a chip for cells analysis more user-friendly and cheaper than conventional methods based on glass slides. Thanks to a 3D design, the use of common fluid handling tools like syringes and micropipettes is made compatible with a microfluidic chip based device. The cell capture process is based on a simple three steps workflow: cell injection, incubation, and washing. This process yields a chip filled with typically more than 3000 cells inside chambers only and with a homogenous distribution. Furthermore, 3D chambers protect cells from the detrimental effects of the shear stress. This allows the injection of reagents (notably rinsing) at a flow rate high enough to evacuate desorbed reagents without delay, but still low enough to not detach the cells, and thus inducing a reduction of the total experiment time. We checked that our rinsing flow rate was in this optimal range, by confirming that the images background signal and signal to noise were independent of the flow velocity used during rinsing, in the vicinity of the velocity selected in the final
11
protocol (not shown). The total volume in a chamber and its connection channels is only 230 nL, and since we observed no significant deviation in cell capture between the 4 chambers of the current device, in routine a single chamber will be sufficient for reliable statistical analysis. Loading of the sample can be directly performed on chip, so the system will also be able to accommodate µl or sub-µl samples. Indeed, because of the very large difference between the shear in channels and in chambers, the dimensions of the latter can be adapted in a rather large range without changing the efficiency of capture in the chambers, This will be useful in order to optimize the number of cells captured, e.g. depending on the type and number of biomarkers to be screened, or to characterize cellular heterogeneity or subpopulations in the sample. Noteworthy, in actual clinical practice samples can come out in very different volumes and states, e.g. several ml of raw blood for CTC search, or a few tens µl of a medium possibly containing lipids and emulsions, for FNA. A unified microfluidic sample preparation for all these samples would be difficult to consider, and most analytical labs are equipped in standard with a centrifuge, and can thus perform in a few minutes the pre-treatment eventually needed to obtain a cell suspension injectable in our system. Therefore, although our system in its present stage does not propose full automation from raw sample, it automates the longest and most technically delicate part of the protocol.
To confirm the compatibility of our chip with standard biological cells experiments, we implemented two common biochemical characterization methods namely IF and FISH. The feasibility of these two protocols within our chip confirms the relevance of our choices of material and design. In particular, the chip is compatible with the use of standard biochemical products, withstands high temperatures and enables high magnification fluorescence imaging. Thanks to these results, we elaborated a FISH experiment on a patient sample, to confirm the potential of this device for medical diagnostic experiment. The good quality of the images obtained let us to be confident for its use in diagnostic application. Moreover, the microfluidic format provides a reduction of reagent volumes, and opens the way for parallelized and automated experiments at low cost. Also, the compatibility of the fabrication process with a replication based technique (hot embossing or injection moulding), combined with a low-cost thermoplastic material such as COC makes the fabrication process easily amenable to economically viable mass production of disposable chips. Finally, it should be noticed that the use of enclosed chips, as opposed to glass slides, facilitates the preservation of cells from harsh environments, during storage or transportation. We thus believe that this property, in combination with cost reduction and user-friendly automation, will also facilitate the development of high content cell-based diagnostic in the field or in the developing world.
12
FIG. 1. Four diagrams showing the workflow used to catching cells and the schematic speed inside the chip for these 3 cases.
FIG. 2. Micro-milled Aluminum master mold with a 3D design. The master is made with three independent capture channels enabling to make three experiments in parallel. Each channel is composed of two inlets, 4 cells chambers and one outlet. The zoom image shows a chamber in the manufactured COC chip.
13
FIG. 3. (A) Virtual image of the 3D chip design. The chamber has a tapered profile with an inner diameter ranging from1 mm diameter at the bottom down to 750 µm diameter on top and a height of 350 µm. Channels have a width of 200 µm for the inlet and 60 µm for outlets. The channel’s height is 30 µm. (B) 3D simulation of the flow velocity distribution at 15 µm from the surface, inside chamber and channels. The mean flow velocity is higher in the channels as compared to the chamber area. Furthermore, the flow velocity distribution in the horizontal plan is relatively homogenous across the chamber (Streamline density). Streamlines show the laminar flow inside the chamber (white line). On the bottom left insert, a side cross section view of the chip showing the vertical development of streamlines is provided.
FIG. 4. Fluorescent image of a both chamber and channels area after the injection of SKBR-3 cells (6 µL of a 3x10⁶/mL cells solution). The nucleus of cells was stained with a fluorescent dye (DAPI). Channel walls appear as dashed lines on the image. The density of cells inside the chamber is around 1000 cells/mm2 ±18% (average on 4 chambers, standard deviation).
14
FIG 5: Still image from video showing the result of cells capture within 3 different chambers of the 3D chip. Cell’s nuclei were stained with fluorescent intercalating molecules (DAPI, white dots). The channels are relatively preserved from cells adhesion while chambers are filled of cells (Multimedia view).
FIG 6: Still image from video showing a typical cell captures experiments. Cell injection was performed manually using a syringe inside the chip. The injection was stopped at the third second. The residual flow induces by the difference of hydrostatic pressure in the reservoirs is sufficient to prevent the cell adhesion in the microchannels (Mean flow velocity > 150µm/s) while, in the chamber, cells sediment and attach to the surface (Mean flow velocity = 0-20µm/s) (see fig. 7 for analysis of this video) (Multimedia view).
FIG. 7. Different residual cells velocity measurements inside channel and inside chamber just after to have stopped to push the fluid inside chip. The last cells velocity measured at 37 s is the speed of the last cell view inside the channel. After 37 s, the channel is full depleted of cells.
15
FIG. 8. Velocity simulation inside channels and inside chamber (at 10 µm from the surface and for a velocity magnitude of 200 µm/s imposed at the inlet). The velocity is very low inside the chamber as compared to the channels. A cell (typical diameter ~10µm) attached in the chamber will be thus protected from high shear stress.
FIG. 9. Capture experiments were performed in 2D extrusion chip and in 3D chip. The graph shows the percentage of cells attached on the surface while increasing the pressure drop and thus the flow rate in the device. The 3D geometry offers capture efficiency above 95% for flow rate ranging from 0 to 850mBar (limit of the pressure regulation system).
16
FIG. 10. A) IF experiment performed on cancer cells line (SKBR3, breast cancer). The red colour shows the presence of cytokeratin proteins. The blue colour is due to fluorescent DNA intercalating agent (DAPI) highlighting cell nuclei. The cytokeratin protein is present inside the cytoplasm as it is shown in this picture (red signal present around the blue colour). (B) FISH experiment performed on cancer cells line (G401, kidney). The red dots show the presence of HER2 gene while the green dots reveal the chromosome 17 centromere. Image shows two red dots per cell that correspond to a normal presence of HER2 gene. In the same way the two green dots showing the normal presence of two chromosomes 17. This image was obtained by a deconvolution algorithm39.
FIG. 11. FISH experiment performed on a pleural effusion from a patient with a with a HER2-amplified breast cancer. More than 2 copies of chromosome 17 (centromeric probes in green) are seen in cell nuclei, demonstrating the tumoral origin of the isolated cells. HER2 amplification (HER2 probes in red) in these cells is demonstrated by a ratio HER2/centromeric probe >2.2 (as per current clinical guidelines for HER2 status assessment by FISH38). This image was obtained by a deconvolution algorithm39.
17
VI. TABLES
TABLE I Ratio of speeds between inlet channel and inside 3D chamber in the case of simulations and experiments.
Ratio of velocity Channel/chamber 2D extrusion 3D Flow Simulation 5 25 Experiment
(cells average velocity) 4,6 (±0,2) 22,3 (±1)
ACKNOWLEDGMENTS
We thank B. Lemaire and R. Fert for their help in master fabrication and micromilling, B. Coudert for his help in cell biology experiments and N. Arnoult bringing for fruitful discussions. We also thank the members of the PICT-IBiSA imaging facility of the Institut Curie for their help in image acquisition and processing. This work was supported by the INCA/DHOS "recherche translationelle" programme, Caminems and Diatools European Projects (FP7).
REFERENCES