HAL Id: hal-01644568
https://hal.archives-ouvertes.fr/hal-01644568
Submitted on 22 Nov 2017
HAL is a multi-disciplinary open access
archive for the deposit and dissemination of
sci-entific research documents, whether they are
pub-lished or not. The documents may come from
teaching and research institutions in France or
abroad, or from public or private research centers.
L’archive ouverte pluridisciplinaire HAL, est
destinée au dépôt et à la diffusion de documents
scientifiques de niveau recherche, publiés ou non,
émanant des établissements d’enseignement et de
recherche français ou étrangers, des laboratoires
publics ou privés.
Uncovering Influence Cookbooks : Reverse Engineering
the Topological Impact in Peer Ranking Services
Erwan Le Merrer, Gilles Trédan
To cite this version:
Erwan Le Merrer, Gilles Trédan. Uncovering Influence Cookbooks : Reverse Engineering the
Topo-logical Impact in Peer Ranking Services. 20th ACM Conference on Computer-Supported Cooperative
Work and Social Computing CSCW 2017, Feb 2017, Portland, United States. 5p. �hal-01644568�
Uncovering Influence Cookbooks : Reverse Engineering the
Topological Impact in Peer Ranking Services
Erwan Le Merrer
Technicolor, France
Gilles Tr´edan
LAAS/CNRS, France
ABSTRACTEnsuring the early detection of important social network users is a challenging task. Some peer ranking services are now well established, such as PeerIndex, Klout, or Kred. Their function is to rank users according to their influence. This notion of influence is however abstract, and the algorithms achieving this ranking are opaque. Following the rising de-mand for a more transparent web, we explore the problem of gaining knowledge by reverse engineering such peer ranking services, with regards to the social network topology they get as an input. Since these services exploit the online activity of users (and therefore their connectivity in social networks), we provide a method allowing a precise evaluation of the extent to which given topological metrics regarding the social net-work are involved in the assessment of the final user ranking. Our approach is the following : we first model the ranking service as a black-box with which we interact by creating user profiles and by performing operations on them. Through those profiles, we trigger some slight topological modifica-tions. By monitoring the impact of these modifications on the rankings of created users, we infer the weight of each topo-logical metric in the black-box, thus reversing the service in-fluence cookbook.
INTRODUCTION
The need for an increased transparency in the functioning of web-services has recently arised, motivated by various use cases such as privacy or copyright control. For example, work such as [7] proposes to retrieve which piece of information of a user-profile triggered advertisement to that user. Goal is thus to infer the internals of black-box services provided by com-panies on the web. Klout or PeerIndex propose to rank users based on their behavior on social networks (using their so-cial connectivity and activity). They nevertheless keep secret the algorithms and parameters used for this ranking1. This motivated some users to try reversing their internals [4]. So-metimes information leaks about some ingredients of those hidden recipes ; CEO of PeerIndex admitted to use Pagerank2
(and thus graph topological-metrics), as a part of the ranking algorithm, to compute user intrinsic influence in a network. Such an understanding of which metrics are involved is also of a particular interest for information sharing and coordina-tion, as it has been shown that some centrality metrics cor-relate with the actual ability of network actors to coordinate others [5, 3]. This knowledge can then serve to assess if the centrality metric leveraged by the ranking function makes the
1. Those services may provide a score as an output. Clearly, re-versing a ranking function is harder than rere-versing a score, as you can obtain a ranking from scores, while the opposite is impossible.
2. blog post onhttps://www.quora.com/
ranking service relevant to dispatch roles for given tasks for example [3].
Nevertheless, reverse engineering such black-boxes is a chal-lenging task. Indeed, in this web-service paradigm, the user only has access to the output of the algorithm, and cannot ex-tract any side-information. Moreover, in many cases such as in peer ranking services, the user can only take action on a li-mited part of the algorithm input. Motivated by this challenge for transparency, we ask the following question : can a user infer, from the results returned by such peer ranking al-gorithms, what are the topological metrics in use, and to what extent ?
We first introduce the ranking service we consider and model our actions, before warming-up on a toy example. We then generalize the example and provide a construction to identify the use of a single arbitrary centrality among a given set of candidates. Then, we assume that the ranking can be produ-ced by a linear combination of multiple centralities, and give a generic reverse engineer approach. We conclude by illustra-ting such a generic approach on a concrete scenario, before giving perspectives.
MODEL & WARM UP : REVERSING ONE CENTRALITY
Let us model a social web-service. Each user is represented by a vertex v, together with a set of (possibly unknown to the user) attributes a(v). To interact with the web-service, users have access to a finite set of actions A. We consider two types of actions : i) single actions that only involve a single user (e.g., posting a message on a wall) and might change part of the user profile a(v). And ii), pair actions that involve a pair of users (e.g., following, declaring or deleting a “friendship” re-lation). These actions impact the network of relations among users, that we capture as a graph G∞(V, E).
Among the features of this web-service, a ranking of the users is available. While the internals of the ranking methodology are unknown, each user accesses its output, that is her own ranking at any time. Let f be the ranking black-box function. More specifically, f takes as input the graph G∞ along with
the attributes of its nodes (that is {a(v), ∀v ∈ V}) and assigns each node a score f (i, a(i)), i ∈ G∞ from which is derived
an observable ranking r of all graph nodes such that : ∀i, j ∈ V(G∞)2, i >r jiff f (i, a(i)) > f ( j, a( j)), that is : “node i is
more important (or “influent”) than node j”.
The objective of this paper is to gain knowledge on f , and more specifically to evaluate the impact of each action in A on users rankings. For a given user, the two main difficulties are that first, she witness only a limited part of the input of f (typically her own friends in the social graph). Second, the output of f is sparse, as it only provides nodes with a total
G∞
a1
a2 a3
a4 a5
Figure 1: A small query graph GQ, solving the single
centra-lity reverse engineering problem for plausible set Cbase.
order relation (e.g., user x is better ranked than her neighbor y). In order to try reversing f , we assume the querying user is able to create a set of profiles Vain the social service, and
have those profiles issue any single action of A. She is also able to achieve any pair action between two profiles of Va,
therefore updating the subgraph of G∞ induced by nodes of
Va. Those two operations are conduced through API calls, as
it is e.g., observed in practice in Facebook [2].
As a warm up, let us assume that f leverages exactly one of the following classic centralities Cbase = {degree,
eccentricity, betweenness, Pagerank, closeness} [6]. To de-termine which one is in use, one user wants to build a small query graph GQ, attached to G∞ (then G∞ ← G∞ ∪ GQ),
in order to reverse f . To start our analysis of f on a clean basis, the user creates nodes ∈ GQthat are strictly identical
up to their connectivity (i.e., their attributes in a(v) regarding single actions such as tweets or posted comments are empty). LEMMA 1. The query graph GQdepicted on Figure 1, of
5 nodes, is sufficient to reverse engineer a function f that is based on a single centrality ∈ Cbase, relatively to the other
centralities in the same set Cbase.
PROOF. The proof requires showing that such GQis able
to discriminate the centralities considered in the set Cbase.
Consider graph G∞∪ GQon Figure 1. GQnodes are given the
following ranking, for centralities in Cbase3: < degree, [a1=r
a2 >r a3 =r a4 =r a5] >, < eccentricity, [a1 >r a2 =r
a3 >r a4 =r a5] >, < betweenness, [a1 >r a2 >r a3 =r
a4 =r a5] >, < Pagerank, [a2 >r a1 >r a4 =r a5 >r a3] >,
< closeness, [a1>r a2>ra3 >ra4=r a5] >. All rankings are
indeed unique, thus allowing to designate the centrality used, by user observing rankings produced by f at GQ nodes she
controls.
Note that GQ is not the unique graph solving this problem
instance.
There are obvious interests in minimizing the size of the constructed query graph : first, constructing a bigger graph re-quires a longer time, especially if actions on the service plat-form are rate-limited on operations. Second, the bigger the query, the easier it can be detected by the social service. Note that the graph GQ\ n5, of size 4 is not a solution, as degree
3. we conducted numerical simulations using the networkx library :
https://networkx.github.io/
and betweenness produce the same [a1 >r a2 >r a3 =r a4]
ranking, as for both fringe nodes a3and a4, betweenness is 0,
and degree is 1.
GENERAL DISCRETE CENTRALITY DISCRIMINATION
We now generalize the reversing logic used on the previous example to a set C of arbitrary centralities, possibly in use nowadays. Furthermore, we extend the notion of centrality to the one presented in [1] : a centrality is any node-level measure.
We first draw two observations : discrimination is made by the ranking, therefore to distinguish between d different centrali-ties one requires at least d different rankings. Thus |GQ|! ≥ d.
Second, the discrimination in this set of centralities is made thanks to graphs we call delta-reversal graphs.
DEFINITION1 (DELTA-REVERSAL GRAPHS). ∆XY is
the set of graphs such that ∀G ∈ ∆XY, ∃i, j ∈ V(G) s.t.
fX(G, i) < fX(G, j) ∧ fY(G, i) > fY(G, j).
A delta-reversal graph for two centralities X and Y is a graph where the ranking r induced by using the ranking provided by fX (i.e., by a function f only relying on centrality X) on the
nodes of G would be different than the ranking induced by fY. Any such graph would thus allow to discriminate between
Xand Y being used as f4. The following property is a very handy property for using delta-reversal graphs.
DEFINITION2 (CENTRALITYk-LOCALITY). Let X a
centrality. X is said k-local if ∀G1, G2graphs, ∀i ∈ V(G1), j ∈
V(G2), Vk(i, G1)= Vk( j, G2) ⇒ fX(i, G1)= fX( j, G2), where
Vk(i, G) is the graph induced by the k-hop neighborhood of i
in G.
The intuition is the following : a k-local centrality only consi-ders the k-hop neighborhood of a node when assessing it’s im-portance. This can be seen as the “scope” of a centrality : any topological modification beyond this scope leaves the node importance unchanged. This can be exploited to join Delta-reversal graphs into one single query graph while maintaining their discriminating power. Following this intuition, the follo-wing definition states an important property of those graphs.
DEFINITION 3. Let G a∆XYgraph, and dist(i, j) the
hop-distance between nodes i and j. If ∃i, j, k ∈ G s.t. dist(i, k) > ` ∧ dist( j, k) > ` ∧ fX(G, i) < fX(G, j) ∧ fY(G, i) > fY(G, j)
then G is`-discriminating. k is called an anchor.
Combining Delta-reversal graphs
We now explain how to combine pairwise discriminating graphs into a single query graph.
LEMMA 2. Let X, Y, Z three centralities and let k their maximum locality. Then ∀G1 ∈∆X,Y, G2 ∈∆X,Z, G3 ∈∆Y,Z, if
all these graphs are` > k-discriminating, then GS = (V(G1∪
G2∪ G3) ∪ {a}, E(G1∪ G2∪ G3) ∪ {(a, m1), (a, m2), (a, m3)}) ∈
∆XYZ.
4. Examples of discriminating graphs are known in the literature, as they serve as motivation for introducing new centralities : see for instance [8], where a graph is presented that discriminates random walk betweennessfrom classic betweenness centrality.
Data: G∞, a target node a ∈ V(G∞), the set C of suspected
centralities (|C|= d), D the set of pairwise discriminating graphs for set C
Result: The centrality X in use in f
1 ∀GXY∈ D, let iXY, jXYs.t.
fX(iXY) > fX( jXY) ∧ fY(iXY) < fY( jXY);
2 //Building and attaching the general query graph to G∞ 3 for ∀G ∈ D do
4 V(G∞) ← V(G∞) ∪ V(G);
5 E(G∞) ← E(G∞) ∪ E(G) ∪ (a, anchor(G)); 6 r ← r( f (G∞);
7 Let M be a d × d matrix initialized to false; 8 //Retrieving the centrality in use in f 9 for a= 1 . . . d do
10 for b= a + 1 . . . d do 11 Ma,b= iXaXb>r jXaXb;
12 Let s be s.t. ∀k= 1 . . . d, Ms,k= true; 13 return Xs;
Algorithm 1: A reverse engineering algorithm, identifying the centrality in use in arbitrary centrality set C.
PROOF. Since G1 is discriminating, m1 exists. Let i1, j1
the corresponding anchor nodes. Let σX(G1), σY(G1) the
ranks of centralities X, Y. Assume w.l.o.g. that σX(G1, i1) >
σX(G1, j1) and yet σY(G1, i1) < σY(G1, j1). Consider i1 :
we have d(i1, m1) > k and thus Vk(i1, G1) = Vk(i1, GS).
Thus fX(i, G1) = fX(i, GS). As the same applies for j1 we
deduce that σX(GS, i1) > σX(GS, j1) and yet σY(GS, i1) <
σY(GS, j1).
Thus GS ∈∆XY. A similar reasoning holds for i2, j2and i3, j3
thus GS ∈∆XZ∩∆YZ∩∆XZ= ∆XYZ.
This lemma is very useful, as it provides us with a way to create discriminating graphs from pair of known ones. The following lemma finally generalizes the construction :
LEMMA 3. Let C a set of d centralities and let k their maximum locality. Let D= {GAB ∈∆AB, ∀A, B , A ∈ C2}, a
set containing a pairwise discriminating graph for each pair of centrality in C. If all these graphs are` > k-differentiated, then let GS = (V(∪G∈DG) ∪ {a}, E(∪G∈DG) ∪ {(a, mAB, ∀A, B ,
A ∈ C}), where mXYis an anchor of GXY∈ D. Then GS ∈∆C.
PROOF. (sketch) : identical to Lemma 2.
The GS construction therefore allows for any set of
centra-lities, given pairwise discriminating graphs, to construct one general discriminating graph achieving the reverse enginee-ring process. Note that the complexity is quadratic : a graph to compare d centralities requiresΩ(d2) pairwise discrimina-ting graphs.
We are now ready to propose a general method to infer which centrality is in use in f . It is shown in Algorithm 1.
THEOREM 1. Let G∞a graph, and r an unknown ranking
function relying on centrality z. If z ∈ C then Algorithm 1 returns z.
PROOF. First, observe that in Algorithm 1, lines 1 − 5 im-plement the construction of a combined Delta-reversal graph as defined in Lemma 3. Line 6 collects the resulting ranking. Consider M at line 12. For z to be correctly identified, two conditions must hold : i) the line Mz,.contains only entries at
true, and ii) all other lines Mi,., i , z contain at least one false
entry.
Consider line Mz,.. By contradiction, assume that one entry,
say j is false. Then necessarily iz, j <r jz, jline 11. Since r is
obtained using z, we deduce fz(iz, j) < fz( jz, j). This contradicts
the definition of iz, jand jz, jthat are chosen line 1 in the sub-graph Gz jsuch that fz(iz, j) > fz( jz, j). We conclude that Mz,.
contains only true entries.
Now, assume there exists another line, say i, such that Mi,.
contains only true entries. Consider column z : we have Mi,z =true. As in the previous step, we deduce fz(ii,z) >
fz( ji,z) ; this again contradicts the definition of ii,zand ji,z
cho-sen line 1 in Giz such that fz(ii,z) < fz( ji,z). Thus every other
line has at least a negative entry.
Therefore, we conclude that Xs= z line 13 : Algorithm 1 has
identified z.
The sketch presented in Algorithm 1 can be optimized in many ways. First, one can build the query graph incremen-tally and only test the relevant centralities : let Gabbe the first
added Delta-reversal graph line 4 and 5. It is possible to test directly the value of Mab. Assume Ma,b=False, then
necessa-rily centrality Xais not used in f . There is therefore no need
to add any other Gac, ∀c ∈ D graph.
Second, observe that we focus on pairwise Delta-reversal graphs. Some Delta-reversal graphs allow to differentiate bet-ween more than two centralities (for instance, the graph GQ
Figure 1 that allows to differentiate between 5 centralities at once, while containing only 5 nodes). Using such graphs dras-tically reduces the size of final the query graph.
REVERSE ENGINEERING A LINEAR COMBINATION OF CENTRALITIES
In the previous section, we have seen how to identify which centrality is used given a finite set of suspected centralities. We now propose a method for extending to a f that is a li-near combination of suspected centralities, for it allows more complex and subtle ranking functions.
As the space of possible centralities is theoretically infinite, we assume the user takes a bet on a possibly large list of d centralities in a set C, that are potentially involved in f . We will show that our approach also allows to infer the absence of significant impact of a given centrality in set C, and thus conclude that it is probably not used in f .
In a nutshell, the query proceeds as follows. The user leve-rages an arbitrary node a, already present in G∞. She then
creates d identical nodes (i.e., profiles) and connects them to a. The ranking of those d created nodes is thus the same, by construction. She applies to each node a different serie of API calls (i.e., topological operations, attaching them one node for instance). After each serie, ranking of those nodes changes.
Data: G∞, a target node a ∈ V(G∞), operations {u1, . . . , ud}
Result: An estimate of h (i.e., the vector containing the weight of each centrality in f )
1 Let k be a vector of size d − 1 initialized to 0; 2 for 1 ≤ i ≤ d do
3 //attach a query node to target node a, and conduce
operations over it
4 Create node ai: V(G∞) ← V(G∞) ∪ {ai}; 5 Add edge (ai, a) : E(G∞) ← E(G∞) ∪ {(ai, a)}; 6 Apply ui(ai);
7 W.l.o.g., udis the operation with the highest impact (that is
at this step ∀ j < d, aj<rad) ; Reorder otherwise; 8 for i= 1 to d − 1 do
9 //identify operation thresholds 10 ki← maxx≥1(uix(ai) <rud(ad));
11 //J is the matrix where each element(i, j) is the impact of ki
applications of uion the jthcentrality of node ai, minus the
impact of operation udon ad; 12 Let Ji, j= cj(uki i(ai)) − c j(u d(ad)) ; 13 Set Jd,.= 0d;
14 return Ker(J) //find h s.t. J.h= 0, thus is solution to the
reverse engineering of f
Algorithm 2: A general reverse engineering algorithm, esti-mating the linear weight combination of centralities in f .
Based on those observed changes, she is able to sort the im-pact of those calls, and thus to describe the imim-pact of one gi-ven call by a composition of smaller effect calls. This allows her to retrieve the weights assigned by f to the d centralities in set C, by solving a linear equation system.
Lets consider the following image : imagine you have an old weighing scale (that only answers “left is heavier than right” or vice-versa) and a set of fruits (say berries, oranges, apples and melons) you want to weigh. Since no “absolute” wei-ghing system is available, the solution is to weighs the fruits relatively to each other, for instance by expressing each fruit as a fraction of the heaviest fruit, the melon. One straightfor-ward approach is to directly test how many of each fruit weigh one melon. This is the approach adopted here. However, the problem here is that in general, we are not able to individually weigh each fruit (centrality). Instead, we have a set of d dif-ferent fruit salads. This is not a problem if the composition of each salad is known (i.e., the impact of API calls) ; one has to solve a linear system : there are d different combinations that are equal, thus providing d equations.
A reverse engineering algorithm
Black-box function f relies on arbitrary centralities chosen from a set we denote C of size |C|= d. Let ci ∈ Rd be the d
dimensional column vector representing each of the d com-puted centrality values for a node i in G∞.
We assume that f is linear in all directions (i.e., f is a weigh-ted mean of all centralities) : ∃h ∈ Rd s.t. f (i) = c
i.h.
Re-verse engineering the topological impact over the final ran-king thus boils down to find h (and therefore directly obtain f).h is then the vector of coefficients corresponding to
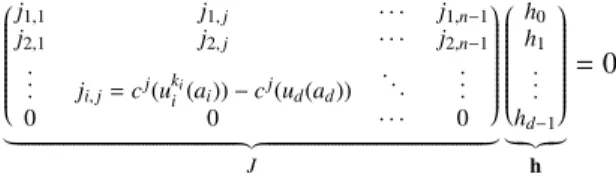
centra- j1,1 j1, j · · · j1,n−1 j2,1 j2, j · · · j2,n−1 .. . ji, j= cj(uki i (ai)) − c j(u d(ad)) ... ... 0 0 · · · 0 | {z } J h0 h1 .. . hd−1 | {z } h = 0
Figure 2: Solution to reverse engineer f , uncovering h.
lities listed in C. The user performs operations on G∞through
API calls, starting from an existing node a. We assume she is able to find d different operations denoted {u1, . . . , ud}.
Consi-der for instance one operation of that set, noted u1(i), and
that simply adds a neighbor to node i : G∞(V, E), i →u1(i)
(V ∪ {a}, E ∪ {(i, a)}). Such an operation has an impact on i’s topological role in f , let u ∈ Rdbe this impact on all
cen-tralities in set C : ci← ci+ u.
Regarding those operations, we assume that : i) the user is able to determine the result of each ui’s impact on her created
node’s centrality values (i.e., she computes uk
i(i), ∀i ≤ d, and
where k > 0 is the number of applications of the operation), and ii) they are linearly independent : each operation has a unique impact on computed centralities from set C.
The query proceeds as shown on Algorithm 2, where notations are defined. First, observe that by construction rank(J) ≤ d − 1. The last operation ud is the reference
against which we compare other operations. Line 12 records the maximum number of same uioperation applications that
lead to the same rank (or close) than a single udoperation on
another node.
Consider a line i of J (L.12 Algorithm 2, also represented on Figure 2). Since at the end ai=rad (or close), we have (cai+ uki
i (ai))h = (cad+ ud(ad))h ± ui(ai).h. Since by construction cai = cad, therefore we seek h s.t. u
ki
i (ai)h − ud(ad)h= 0. Or
matrix notation : J.h= 0 : h is in the kernel of J.
Intuitively, the fact that we get infinitely many solutions (α.h, ∀α ∈ R+) comes from our observation method : we are never able to observe actual scores, but rather rankings. Since multiplying h by a constant does not change the final ranking, any vector co-linear to, e.g., h/||h|| is a solution.
One important remark is that one cannot formally claim that one centrality metric is not in use in C with this algorithm. As-sume for instance that one centrality, e.g., number of tweets of the considered node, is 103times less important than another
centrality, e.g., degree. Then we will not be able to witness its effect unless we produce 103tweets. And after 102tweets, we will only be able to conclude : number of tweets is at least 102
times less important that degree. One can reasonably assume that such an imbalance in practice means that one service ope-rator will not compute a possibly costly centrality to use it to such a low extent in f ; this thus makes our algorithm able to discard barely or not used centralities in C. Finally, we note that with cost(ui) the number of calls issued by operation ui,
the total number of operations for weighting two centralities in C is at most cost(ud)+ Pd−1i=1 ki.cost(ui).
G∞
a
a1 a2
a11 a12 a13 a21 a22 a23
u1 u2
Figure 3: Querying G∞: conducing two sequences of
opera-tions u1and u2, attaching them to a.
Exploiting local centralities : an illustration
We demonstrated how to reverse engineer a linear combina-tion of centralities. The difficulty for the user is to compute the impact of u operations on the suspected centralities. In the easiest case, suspected centralities behave linearly (such as e.g., degree, betweenness), and it is therefore easy to com-pute the impact of an update. The case of non-linearity can be solved using the locality of centralities : if c is k-local, the observation of the k-hop neighborhood of a node is required to reverse engineer f . We illustrate this on a simple example. Let us assume a ranking function f whose internals use a combination of c1 : clustering centrality5 and c2 : degree
(i.e., C= [c1, c2]). Without loss of generality, we assume that
the coefficient for degree in h is h1 = 1, so that we seek the
corresponding coefficient h2 = h. Let us consider the
follo-wing two operations in {u1, u2}. Operation u2simply attach a
node to one initial query node (a1 or a2). u1 starts by
atta-ching queryS ize − 1 nodes to query node a1. At each call, an edge between two randomly selected attached nodes is added, to increase clustering. u1and u2are represented on Figure 3,
for a queryS ize= 4. User can compute the value of uk−1 1 (a1)
and uk−1
2 (a2) at any time, since she controls those nodes.
We simulated the query with a G∞being a 1, 000 nodes
Ba-rab´asi-Albert graph with an average degree of 5, estimating husing u1and u2operations with Algorithm 1. Figure 4
pre-sents the obtained results : a point (x, y) means the real value of h is x and was estimated by Algorithm 1 as y. Black dots plot the real coefficient values of h. Each colored area repre-sents the estimated (reverse engineered) coefficients, while each color represents a query size, i.e., the number of nodes created by the user to reverse f . The larger the query, the more precise the reverse engineered results. We note that if the real values of coefficients to be estimated are bigger (e.g., 4 or 5 on the x-axis), estimations show lower precision (larger areas). Despite this remark, estimations appear unbiased.
DISCUSSION
The will for web-services transparency starts to trigger new research works. XRay [7] for instance proposes a correlation algorithm, that aims at inferring to which data input is asso-ciated a personalized output to the user. This Bayesian-based
5. this centrality has no linear behavior, but is 1−local.
● ● ● ● ● ● ● ● ● ● ● ● ● ● ● ● ● ● ● ● 2 4 6 1 2 3 4 5 Real Coeff. Estimated Coeff . querySize ● ● ● ● ● 20 30 40 50 60
Figure 4: Reversing a f with unknown coefficients from 1 to 5, with various query sizes (node creations.)
algorithm returns data that are the cause of received ads, while we seek in this paper to retrieve the internals of a black-box ranking function, in order to assess what is the effect of user actions on the output peer ranking. We have presented a gene-ral framework. Based on the centgene-ralities that might be used by the ranking function, there remain work for a user, for buil-ding discriminating graphs, and for finbuil-ding small topological operations that will make the reverse engineering possible. For a ranking service operator, the countermeasure is the op-posite : she must find ranking metrics that are computatio-nally hard to distinguish, typically ones that would ensure the detection of the querying user by the internal security system. We find this to be an interesting challenge for futureworks.
REFERENCES
1. S. P. Borgatti and M. G. Everett. A graph-theoretic perspective on centrality. Social networks, 2006.
2. Q. Cao, M. Sirivianos, X. Yang, and T. Pregueiro. Aiding the detection of fake accounts in large scale social online services. NSDI, 2012.
3. S. Feczak and L. Hossain. Exploring computer supported collaborative coordination through social networks. The Journal of High Technology Management Research, 22(2) :121 – 140, 2011.
4. S. Golliher. How i reverse engineered klout score to an r2 = 0.94. blog post, 2011.
5. L. Hossain, A. Wu, and K. K. S. Chung. Actor centrality correlates to project based coordination. CSCW, pages 363–372, 2006.
6. D. Kosch¨utzki, K. A. Lehmann, L. Peeters, S. Richter, D. Tenfelde-Podehl, and O. Zlotowski. Network Analysis : Methodological Foundations, chapter Centrality Indices. Springer, 2005.
7. M. L´ecuyer, G. Ducoffe, F. Lan, A. Papancea, T. Petsios, R. Spahn, A. Chaintreau, and R. Geambasu. Xray : Enhancing the web’s transparency with differential correlation. USENIX Security Symposium, 2014. 8. Newman. A measure of betweenness centrality based on