ORIGINAL ARTICLE
New reference tables and user-friendly Internet application
for predicted heart weights
Jessica Vanhaebost&Mohamed Faouzi&Patrice Mangin&
Katarzyna Michaud
Received: 29 September 2013 / Accepted: 10 December 2013 / Published online: 11 January 2014 # Springer-Verlag Berlin Heidelberg 2014
Abstract
Background Knowledge of normal heart weight ranges is important information for pathologists. Comparing the measured heart weight to reference values is one of the key elements used to determine if the heart is path-ological, as heart weight increases in many cardiac pathologies. The current reference tables are old and in need of an update.
Aims The purposes of this study are to establish new reference tables for normal heart weights in the local population and to determine the best predictive factor for normal heart weight. We also aim to provide technical support to calculate the predictive normal heart weight.
Methods The reference values are based on retrospective analysis of adult Caucasian autopsy cases without any obvious pathology that were collected at the University Centre of Legal Medicine in Lausanne from 2007 to 2011. We selected 288 cases. The mean age was 39.2 years. There were 118 men and 170 women. Regression analyses were performed to assess the relationship of heart weight to body weight, body height, body mass index (BMI) and body surface area (BSA).
Results The heart weight increased along with an increase in all the parameters studied. The mean heart weight was greater in men than in women at a similar body weight. BSA was determined to be the best predictor for normal heart weight. New reference tables for predicted heart
weights are presented as a web application that enable the comparison of heart weights observed at autopsy with the reference values.
Conclusions The reference tables for heart weight and other organs should be systematically updated and adapted for the local population. Web access and smartphone applications for the predicted heart weight represent important investigational tools.
Keywords Heart weight . Autopsy . Reference table . Smartphone application
Introduction
The heart weight at autopsy and its comparison to reference values are one of the key pieces of information used to help determine if cardiac pathology exists. An increased heart weight can be suggestive of certain cardiomyopathies, such as hypertrophic cardiomyopathy, certain valvular disease, ad-vanced stage of ischemic heart disease, pulmonary hyperten-sion and other chronic diseases, all of which should be care-fully considered during autopsy and histological examination. Reference heart weight values enable the comparison of the measured weight at autopsy with the accepted normal range. Numerous quantitative autopsy studies have been previously published [1–16]. Most of them are outdated or were per-formed on different populations compared to that observed locally. The most frequently cited heart weight references are from Kitzman, whose values are based on data taken about half a century ago in North America, as well as from Zeek [10,
15]. In 2000, de la Grandmaison et al. published reference weight values for different organs based on autopsies per-formed on a French Caucasoid population between 1987 and 1991. They stressed the importance of establishing current reference tables based on the local population of concern Electronic supplementary material The online version of this article
(doi:10.1007/s00414-013-0958-9) contains supplementary material, which is available to authorized users.
J. Vanhaebost
:
P. Mangin:
K. Michaud (*)University Center of Legal Medicine, Lausanne, Switzerland e-mail: [email protected]
M. Faouzi
[4]. There is also a need to offer user-friendly technical sup-port to help predict heart weight, as recently suggested by Gaitskell et al. and Lucas [17,18].
The purposes of this study are to establish new reference tables that correspond to the local population and to determine the best predictive factor for heart weight. Taking into consid-eration the rapidly evolving medical reference support system, we have developed a smartphone application to calculate predicted values.
Material and methods Cases
Data were retrospectively collected from forensic autopsies of adult Caucasian cases performed from 2007 to 2011 in the University Centre of Legal Medicine in Lausanne. The post-mortem period did not exceed 72 h. Putrefied cases were excluded. Exclusion criteria included the following: a clinical history of arterial hypertension, myocardial infarction, coro-nary thrombosis and/or >75 % atherosclerotic stenosis of coronary arteries; other presumed natural deaths of cardiovas-cular origin; chronic pulmonary, hepatic or renal diseases; as well as cardiac injuries or general traumatic lesions to the body which modified the body weight (i.e. polytrauma with loss of body parts, burning of the body.). Of the 1,075 autopsy cases, 288 met the inclusion criteria. There were 170 men and 118 women. The most frequent cause of death was a traumatic event (101 cases; traffic accident, fall, etc.), followed by intoxication (76 cases; mostly from methadone), non-cardiac natural deaths (58 cases), asphyxia (49 cases; hanging, drown-ing, positional or compression of the thorax, CO intoxication, etc.) along with two cases of hypothermia and two cases of electrocution.
The autopsies were performed according to international recommendations [19]. Body heights were measured from the vertex to the heel in supine position, and the corpses were weighed naked with the same machine (METTLER, 0–400 kg range, 100-g intervals). A macroscopic and microscopic car-diac examination was performed for all cases. The emerging points of the great cardiac vessels were interrupted and the heart (with epicardial fat) was excised. Each heart was emptied of post-mortem clots and weighed unfixed on a precision electronic balance (DIBAL, 0–15 kg range, 1-g intervals). We ignored the difference introduced by the epi-cardial fat, as suggested in a study that showed that the relation between total heart weight and total myocardial mass is very close [20].
The height and weight were used to calculate the body mass index (BMI) with the standard formula, and the body surface area (BSA) was calculated using the formula of Boyd [21].
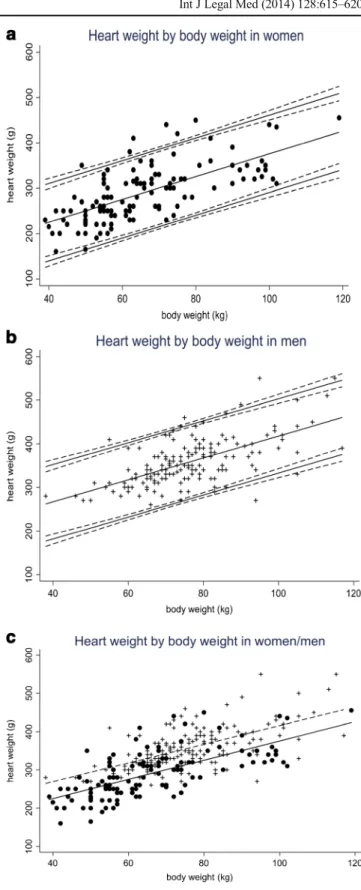
Fig. 1 Heart weight as a function of body weight in women and in men. a Heart weight as a function of body weight in women (circle), with (95 %) reference (solid lines) and their confidence interval (dashed lines). The predicted values correspond to the solid line in the center. b Heart weight as a function of body weight in men (plus sign), with (95 %) reference (solid lines) and their confidence interval (dashed lines). The predicted values correspond to the solid line in the center. c Linear regression line of heart weight as a function of body weight in women (solid line) and in men (dashed line)
Statistical correlations between organ weight and body height, BMI, BSA and age were performed using linear re-gression. R2values were determined for all parameters.
Statistical analysis
Data was summarized as mean±standard deviation for contin-uous variables and as percentages for categorical variables. The heart weight reference limits were established in the reference population using regression analyses, as described by Virtanen et al. [22]. The associations of body weight, body height, BMI and BSA to heart weight were tested using univariate analyses. All the associations were adjusted for gender. The strength of the associations was assessed using the R2and p values. Sep-arate tables to predict heart weight as a function of body weight,
BMI and BSA were calculated. Statistical analyses were per-formed using the STATA software [23].
Results
General data and heart weight
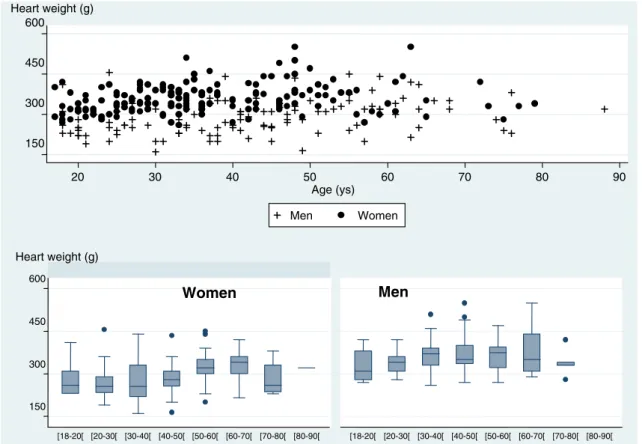
We selected 288 cases. There were 118 women and 170 men. The mean age was 39.2±14.6 years (range 1–88; 18–79 for men and 18–88 for women). Heart weight was fitted to a Gaussian distribution curve (Fig.S1). Heart weight increased with all of the parameters studied. The mean heart weight was greater in men than in women at the same body weight (Fig.1a–c) and increased with the increase of BMI and BSA (Fig. S2). The external parameters considered were age, 150 300 450 600 Heart weight (g) 20 30 40 50 60 70 80 90 Age (ys) Men Women 150 300 450 600 [18-20[ [20-30[ [30-40[ [40-50[ [50-60[ [60-70[ [70-80[ [80-90[ [18-20[ [20-30[ [30-40[ [40-50[ [50-60[ [60-70[ [70-80[ [80-90[ Women Heart weight (g) Men
Fig. 2 Distribution of heart weight (g) in women and men according to age (years)
Table 1 Summary variables and the results of univariate regression analyses of heart weight versus age, body height, body weight, BMI and BSA
Mean (SD) Beta 95 % CI p value R2(Adj)
Age [years] 39.2 (14.6) 0.59 0.07–1.12 0.026 0.01 Height [cm] 169.2 (9.56) 3.42 2.72–4.12 <0.001 0.24 Weight [kg] 71.8 (15.67) 2.93 2.58–3.29 <0.001 0.48 BMI [m/kg2] 25.0 (4.89) 6.78 5.42–8.14 <0.001 0.25 BSA [m2] 1.85 (0.24) 199.54 176.86–222.21 <0.001 0.51 Sex F: 118 (41 %) 67.26 53.71–80.80 <0.001 0.25 M: 170 (59 %)
height, body weight, BMI and BSA. The distribution of heart weight in women and men according to age is shown in Fig.2. The mean, standard deviation, beta coefficients, p values and R2values of the univariate linear regressions are shown in Tables1and2.
Heart weight and its correlation to body weight, BMI and BSA
Heart weight was statistically correlated with all of the param-eters studied (age, sex, weight, length, BMI and BSA). The highest R2value (0.51) was observed for BSA, followed by body weight (0.48), indicating that BSA was the best predictor of heart weight. Predicted normal heart weight as a function of body weight, BSA and BMI is shown in Tables3and4and TableS1.
In TableS2, the results obtained by Kitzman and by de la Grandmaison and those obtained in our study are presented on an indicative basis and not with the aim to validate them or to compare statistically.
Support
A small calculator has been designed to estimate the heart weight based on the findings presented in this paper. The calculator is available at http://calc.chuv.ch/Heartweight. It was developed in PHP/HTML5 in order to work on the latest web browsers and most smartphones and tablets.
Discussion
Heart weight reference values are considered to be valid for a limited period of time, and they should be updated regularly [4]. Unfortunately, clinical autopsy rates are decreasing in most countries, especially for the non-hospital population. Autopsies performed on the hospital population show a wide variety of pathological changes, predominantly cardiac in nature, which excludes them from being used for reference values. Forensic autopsies can provide reference information as long as they are performed according to international guidelines. The autopsy protocol should include macroscopic and histological examination of all organs. This study pro-vides enough information to update the reference values for Table 2 Results of bivariate regression analysis of the heart weight on the body weight, the BMI and the BSA when adjusting for gender
Beta 95 % CI p value R2(Adj) Weight [kg] 2.51 2.17–2.85 <0.0001 0.57 BMI [m/kg2] 6.97 5.87–8.06 <0.0001 0.51 BSA [m2] 171.1 147.80–194.41 <0.0001 0.56
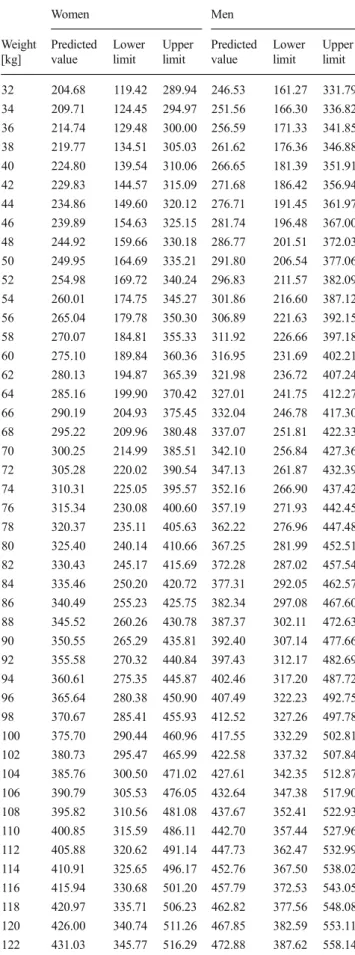
Table 3 Predicted normal heart weight as a function of body weight
Women Men Weight [kg] Predicted value Lower limit Upper limit Predicted value Lower limit Upper limit 32 204.68 119.42 289.94 246.53 161.27 331.79 34 209.71 124.45 294.97 251.56 166.30 336.82 36 214.74 129.48 300.00 256.59 171.33 341.85 38 219.77 134.51 305.03 261.62 176.36 346.88 40 224.80 139.54 310.06 266.65 181.39 351.91 42 229.83 144.57 315.09 271.68 186.42 356.94 44 234.86 149.60 320.12 276.71 191.45 361.97 46 239.89 154.63 325.15 281.74 196.48 367.00 48 244.92 159.66 330.18 286.77 201.51 372.03 50 249.95 164.69 335.21 291.80 206.54 377.06 52 254.98 169.72 340.24 296.83 211.57 382.09 54 260.01 174.75 345.27 301.86 216.60 387.12 56 265.04 179.78 350.30 306.89 221.63 392.15 58 270.07 184.81 355.33 311.92 226.66 397.18 60 275.10 189.84 360.36 316.95 231.69 402.21 62 280.13 194.87 365.39 321.98 236.72 407.24 64 285.16 199.90 370.42 327.01 241.75 412.27 66 290.19 204.93 375.45 332.04 246.78 417.30 68 295.22 209.96 380.48 337.07 251.81 422.33 70 300.25 214.99 385.51 342.10 256.84 427.36 72 305.28 220.02 390.54 347.13 261.87 432.39 74 310.31 225.05 395.57 352.16 266.90 437.42 76 315.34 230.08 400.60 357.19 271.93 442.45 78 320.37 235.11 405.63 362.22 276.96 447.48 80 325.40 240.14 410.66 367.25 281.99 452.51 82 330.43 245.17 415.69 372.28 287.02 457.54 84 335.46 250.20 420.72 377.31 292.05 462.57 86 340.49 255.23 425.75 382.34 297.08 467.60 88 345.52 260.26 430.78 387.37 302.11 472.63 90 350.55 265.29 435.81 392.40 307.14 477.66 92 355.58 270.32 440.84 397.43 312.17 482.69 94 360.61 275.35 445.87 402.46 317.20 487.72 96 365.64 280.38 450.90 407.49 322.23 492.75 98 370.67 285.41 455.93 412.52 327.26 497.78 100 375.70 290.44 460.96 417.55 332.29 502.81 102 380.73 295.47 465.99 422.58 337.32 507.84 104 385.76 300.50 471.02 427.61 342.35 512.87 106 390.79 305.53 476.05 432.64 347.38 517.90 108 395.82 310.56 481.08 437.67 352.41 522.93 110 400.85 315.59 486.11 442.70 357.44 527.96 112 405.88 320.62 491.14 447.73 362.47 532.99 114 410.91 325.65 496.17 452.76 367.50 538.02 116 415.94 330.68 501.20 457.79 372.53 543.05 118 420.97 335.71 506.23 462.82 377.56 548.08 120 426.00 340.74 511.26 467.85 382.59 553.11 122 431.03 345.77 516.29 472.88 387.62 558.14
the normal heart weight ranges, at least for the area of western Switzerland.
Numerous studies on heart weight have been published [1–8,10–15,17,24–27]. The most important and/or recent studies are summarized in TableS3. The various methodolo-gies used render comparison of the studies very difficult. They were performed on different populations and were often re-stricted by age or sex. There are important differences in the exclusion criteria used as well. For example, in some studies intoxication cases were included [6,12], while in other studies
positive toxicology was an exclusion criterion [4, 11]; the results of toxicological analyses, if performed, were not re-ported after clinical autopsies [3,10,15,17].
The predictive parameter for heart weight has changed over time. In the older studies, body weight and body height were considered as the best predictive parameters [2,10,15,16]. Later, BMI was shown to be also representative [3, 4,27]. Lorin de la Grandmaison considered BMI to be the best predictive factor for heart weight with an R2value of 0.77 for men and 0.61 for women, while in this study the R2value for BMI was only 0.25. In this study the most predictive factor for heart weight was BSA, which is in accordance with the results of Seo et al. and Gaitskell et al. [9,17]. Calculation of BSA in the autopsy room using Boyd’s formula is not a routine practice and can be laborious. We have, there-fore, developed an application to provide technical sup-port in order to facilitate the calculation of BSA and the predicted heart weight. The developed application is available free of charge for web browsers and most smartphones and tablets.
We believe that it is necessary to establish and update reference values for local populations.
Table 3 (continued) Women Men Weight [kg] Predicted value Lower limit Upper limit Predicted value Lower limit Upper limit 124 436.06 350.80 521.32 477.91 392.65 563.17 126 441.09 355.83 526.35 482.94 397.68 568.20 128 446.12 360.86 531.38 487.97 402.71 573.23 130 451.15 365.89 536.41 493.00 407.74 578.26
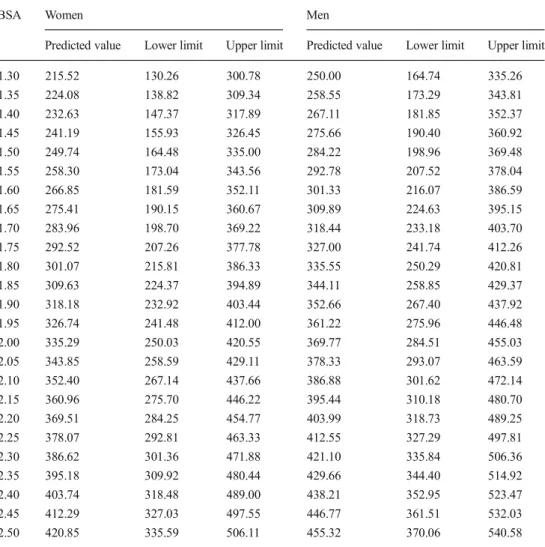
Table 4 Predicted normal heart
weight as a function of BSA BSA Women Men
Predicted value Lower limit Upper limit Predicted value Lower limit Upper limit
1.30 215.52 130.26 300.78 250.00 164.74 335.26 1.35 224.08 138.82 309.34 258.55 173.29 343.81 1.40 232.63 147.37 317.89 267.11 181.85 352.37 1.45 241.19 155.93 326.45 275.66 190.40 360.92 1.50 249.74 164.48 335.00 284.22 198.96 369.48 1.55 258.30 173.04 343.56 292.78 207.52 378.04 1.60 266.85 181.59 352.11 301.33 216.07 386.59 1.65 275.41 190.15 360.67 309.89 224.63 395.15 1.70 283.96 198.70 369.22 318.44 233.18 403.70 1.75 292.52 207.26 377.78 327.00 241.74 412.26 1.80 301.07 215.81 386.33 335.55 250.29 420.81 1.85 309.63 224.37 394.89 344.11 258.85 429.37 1.90 318.18 232.92 403.44 352.66 267.40 437.92 1.95 326.74 241.48 412.00 361.22 275.96 446.48 2.00 335.29 250.03 420.55 369.77 284.51 455.03 2.05 343.85 258.59 429.11 378.33 293.07 463.59 2.10 352.40 267.14 437.66 386.88 301.62 472.14 2.15 360.96 275.70 446.22 395.44 310.18 480.70 2.20 369.51 284.25 454.77 403.99 318.73 489.25 2.25 378.07 292.81 463.33 412.55 327.29 497.81 2.30 386.62 301.36 471.88 421.10 335.84 506.36 2.35 395.18 309.92 480.44 429.66 344.40 514.92 2.40 403.74 318.48 489.00 438.21 352.95 523.47 2.45 412.29 327.03 497.55 446.77 361.51 532.03 2.50 420.85 335.59 506.11 455.32 370.06 540.58
Acknowledgments We gratefully acknowledge Christian Lehmann, project manager in informatics, and his team for the realization of the heart weight calculator and Allison Felley Jacquemont for editing the manuscript.
References
1. Arnold HD (1899) Weight of the "normal" heart in adults. J Boston Soc Med Sci 3(6):174–184
2. Dadgar SK, Tyagi SP, Singh RP, Hameed S (1979) Factors influencing the normal heart weight—a study of 140 hearts. Jpn Circ J 43(2):77–82 3. da Cunha DF, de Carvalho da Cunha SF, dos Reis MA, de Paula Antunes Teixeira V (2002) Heart weight and heart weight/body weight coefficient in malnourished adults. Arq Bras Cardiol 78(4):385–387 4. de la Grandmaison GL, Clairand I, Durigon M (2001) Organ weight in
684 adult autopsies: new tables for a Caucasoid population. Forensic Sci Int 119(2):149–154. doi:10.1016/s0379-0738(00)00401-1
5. Gray H, Mahan E (1943) Prediction of heart weight in man. Am J Phys Anthropol 1(3):271–287. doi:10.1002/ajpa.1330010311
6. Hanzlick R, Rydzewski D (1990) Heart weights of white men 20 to 39 years of age. An analysis of 218 autopsy cases. Am J Forensic Med Pathol 11(3):202–204
7. Hayes JA, Lovell HG (1966) Heart weight of Jamaicans: autopsy study of normal cases and cases of hypertension and chronic lung disease. Am Heart Assoc 33:450–454
8. He Q, Heshka S, Albu J, Boxt L, Krasnow N, Elia M, Gallagher D (2009) Smaller organ mass with greater age, except for heart. J Appl Physiol 106(6):1780–1784. doi:10.1152/japplphysiol.90454.2008
9. Seo JS, Won KJ, Kim DJ, Sohn DS, Yang KM, Cho SH, Park JD, Lee KH, Kim HD (2000) Relationship between normal heart size and body indices in Korean. J Korean Med Sci 15:641–646
10. Kitzman DW, Scholz DG, Hagen PT, Ilstrup DM, Edwards WD (1988) Age-related changes in normal human hearts during the first 10 decades of life. Part II (Maturity): a quantitative anatomic study of 765 specimens from subjects 20 to 99 years old. Mayo Clin Proc 63(2):137–146
11. Molina DK, DiMaio VJ (2012) Normal organ weights in men: part I—the heart. Am J Forensic Med Pathol 33(4):362–367. doi:10.1097/ PAF.0b013e31823d298b
12. Ogiu N, Nakamura Y, Ijiri I, Hiraiwa K, Ogiu T (1997) A statistical analysis of the internal organ weights of normal Japanese people. Health Phys 72(3):368–383
13. Reiner L, Mazzoleni A, Rodriguez FL, Freudenthal RR (1959) The weight of the human heart. I. Normal cases. AMA Arch Pathol 68(1): 58–73
14. Smith HL (1928) The relation of the weight of the heart to the weight of the heart to age. Am Heart J 4(1):79–93. doi: 10.1016/s0002-8703(29)90099-5
15. Zeek PM (1942) Heart weight. I. The weight of the normal human heart. Arch Pathol 34:820–832
16. Smith HL (1928) The relation of the weight of the heart to the weight of the body and of the weight of the heart to age. Am Heart J 4(1):79– 93. doi:10.1016/s0002-8703(29)90099-5
17. Gaitskell K, Perera R, Soilleux EJ (2011) Derivation of new reference tables for human heart weights in light of increasing body mass index. J Clin Pathol 64(4):358–362. doi:10.1136/jcp.2010.084574
18. Lucas SB (2011) Derivation of new reference tables for human heart weights in light of increasing body mass index. J Clin Pathol 64(4): 279–280. doi:10.1136/jcp.2010.085902
19. Brinkmann B (1999) Harmonisation of medico-legal autopsy rules. Int J Legal Med 113(1):1–14
20. Reiner L, Mazzoleni A, Rodriguez FL (1955) Statistical analysis of the epicardial fat weight in human hearts. AMA Arch Pathol 60(4): 369–373
21. Boyd E (1935) The growth of the surface area of the human body. University of Minnesota. The Institute of Child Welfare, Monograph Series, No. x. London: Oxford University Press
22. Virtanen A, Kairisto V, Irjala K, Rajamäki A, Uusipaikka E (1998) Regression-based reference limits and their reliability: example on hemoglobin during the first year of life. Clin Chem 44(2):327–335 23. StataCorp (2011) Stata statistical software: release 12. StataCorp LP,
College Station
24. Garby L, Lammert O, Kock KF, Thobo-Carlsen B (1993) Weights of brain, heart, liver, kidneys, and spleen in healthy and apparently healthy adult Danish subjects. Am J Hum Biol 5(3):291–296. doi:
10.1002/ajhb.1310050307
25. Hitosugi M, Takatsu A, Kinugasa Y, Takao H (1999) Estimation of normal heart weight in Japanese subjects: development of a simpli-fied normal heart weight scale. Leg Med 1(2):80–85. doi:10.1016/ s1344-6223(99)80017-0
26. Kim Y-S, Kim D-I, Cho SY, Kim MH, Yang KM, Lee HY, Han S-H (2009) Statistical analysis for organ weights in Korean adult autop-sies. Korean J Anat 42(4):219–224
27. Sheikhazadi A, Sadr SS, Ghadyani MH, Taheri SK, Manouchehri AA, Nazparvar B, Mehrpour O, Ghorbani M (2010) Study of the normal internal organ weights in Tehran’s population. J Forensic Legal Med 17(2):78–83. doi:10.1016/j.jflm.2009.07.012