HAL Id: hal-03245479
https://hal.archives-ouvertes.fr/hal-03245479
Submitted on 1 Jun 2021HAL is a multi-disciplinary open access archive for the deposit and dissemination of sci-entific research documents, whether they are pub-lished or not. The documents may come from teaching and research institutions in France or abroad, or from public or private research centers.
L’archive ouverte pluridisciplinaire HAL, est destinée au dépôt et à la diffusion de documents scientifiques de niveau recherche, publiés ou non, émanant des établissements d’enseignement et de recherche français ou étrangers, des laboratoires publics ou privés.
Nano-particle size-dependant charging and
electro-deposition in Dielectric Barrier Discharges at
Atmospheric Pressure for thin SiO x film deposition
N Jidenko, C Jimenez, F Massines, J-P Borra
To cite this version:
N Jidenko, C Jimenez, F Massines, J-P Borra. Nano-particle size-dependant charging and electro-deposition in Dielectric Barrier Discharges at Atmospheric Pressure for thin SiO x film electro-deposition. Journal of Physics D: Applied Physics, IOP Publishing, 2007, 40 (14), pp.4155-4163. �10.1088/0022-3727/40/14/009�. �hal-03245479�
Nano-particle size-dependant charging and electro-deposition
in Dielectric Barrier Discharges at Atmospheric Pressure for
thin SiO
xfilm deposition
N JIDENKO (1), C JIMENEZ (2), F MASSINES (2) and J-P BORRA (1)
(1)
Equipe Décharges Electriques et Environnement du Laboratoire de Physique des Gaz et des Plasmas (UMR 8578 CNRS – Univ Paris-SudOrsay, F-91405)
Supelec, Plateau Moulon, F-91192 Gif Sur Yvette, France
(2)
Laboratoire de Génie Electrique de Toulouse (CNRS – Univ. Paul Sabatier) Université Paul Sabatier, 118 route de Narbonne, 31060 Toulouse, France e-mail: nicolas.jidenko@pgp.u-psud.fr
Abstract.
This paper focuses on charging and electro-deposition of nano-particles produced in a mixture of Silane and nitrous oxide diluted in N2, by Dielectric Barrier Discharge (DBD)at atmospheric pressure for SiOx film deposition. Townsend Discharge (TD) and Filamentary
Discharge (FD) are compared with and without SiH4. Without SiH4, particles are produced by
filament-surface interaction. Both filament-surface and plasma-Silane interactions lead to bimodal particle size distributions from nucleation and agglomeration. With SiH4, particle
formation and growth imply the same mechanisms in TD and FD. Faster dynamics in FD are related to higher local volume energy density than in TD. From scanning electron microscope images of the film and measurements downstream of the DBD reactor, the diameter of the particle produced is below 50 nm. An analytical model of electro-collection in ac electric field is used to investigate nano-particle charging. To account for the selective electro-deposition leading to particles smaller than 50 nm being included in the layer and to the particle size distribution measured downstream of the DBD, the same size-dependent charging and electro-deposition of particle are involved, with different charging dynamics in TD and FD.
1.
IntroductionSiO2 thin films can be used for microelectronic applications, barrier layers and hard or anti-reflective
coatings. Mixtures of Silane (SiH4) and nitrous oxide are used for thin SiOx films deposition in low
pressure plasmas [1] and at atmospheric pressure using Dielectric Barrier Discharge (DBD) [2-3]. At low pressure, nano/micro-particle formation is observed and has been studied in most of the reactive plasmas used for industrial applications [4-6]. When SiH4 is used in DBD at atmospheric pressure, the
layer also includes nano-particles [2], but their formation and charging occur in quite different conditions in terms of spatial and temporal evolutions of reactive and charged species densities than at low pressure.
Nano-particles in plasmas at atmospheric pressure are formed by gas-to-particle conversion (i.e. nucleation of condensable species). The condensable species are produced by (i) vaporization at the interface of Filamentary Discharges (FD) with surfaces in carefully conditioned gas [7-9] as well as (ii) by gas-phase reactions between a gaseous precursor and reactive species produced in the discharge [2, 10-12]. These processes will be referred to as physical nucleation and reactive nucleation respectively.
In spark generators, the interaction of a spark filament on a surface with a high energy per filament (from few mJ up to few J) leads to large particle diameter and high concentration (above 100 nm and 107 cm-3 respectively) [8]. Indeed high particle concentration leads to particle growth by Brownian agglomeration so that the initial concentration of nucleated nano-particles and agglomeration time lead to the final particle diameter of the unimodal self preserving size distribution [12-15]. Despite smaller energy per filament in DBD (~ µJ) than in spark, shorter duration (~ nanosecond) and smaller surface (~ 10-5 cm2) imply high surface power density (~ 1012 W.m-2), thus fluence threshold for vaporisation (0.1 J.cm-2) is reached enabling the nucleation of the hot vapour around these filamentary discharges. Particles are also formed by filament-surface interaction in DBD but lead to smaller particles than with
spark and at concentrations below 107 cm-3, as excepted from the smaller vapour fluxes than with more energetic spark [12].
Particle charging by FD has been demonstrated in plane to plane DBD in air, by the collection on the dielectric surface of initially neutral particles between 20 and 70 nm injected in the DBD reactor [16]. Ions remaining in the gap a few microseconds after the filament lead to diffusion charging of the particles. The excess of positive ions in the discharge gap, due to the higher mobility of electrons, leads to positive net charge of the nano-particles. For such an ultra fine aerosol, the final number of charges per particle depends on particle size and on the charging conditions including Ni· product, with Ni, the ion density, and , the transit time of the particle in the ion cloud [13]. The mechanism of field charging, for which the ions drift along the electric field lines ending on the particle, is negligible compared to diffusion charging if the particles size is below 100 nm.
At Atmospheric Pressure, in plane-to-plane DBD in nitrogen, the two discharge regimes are: Filamentary Discharge (FD) and Townsend Discharge (TD) [17]. In FD, thin and brief streamer-like filaments (duration: a few 10’s of ns, diameter a few 10’s of μm) are homogeneously distributed over the dielectric surface [18]. In TD, streamer formation is not observed, but a larger homogeneous discharge occurs with respect to the more confined FD. Both regimes are used to create silicon-based films at atmospheric pressure from diluted Silane (SiH4 with nitrous oxide in nitrogen), leading to
Chemical Vapour Deposition (CVD) of condensable species and radicals, as well as SiOx particles [2,
3].
Electrical characterization of the different plasma regimes, related to applied voltage, frequency and Silane concentration is first depicted in this paper. Then, physical nucleation of particles produced by filament-surface interaction in an N2/O2 mixture without a Silane precursor is presented. The dynamics
of particle formation and growth are then depicted from the size distribution of the particles measured downstream of the DBD.. Finally, with a Silane precursor, the reactive nucleation and the particle deposition are analysed through SEM images of the layer and particle number-size distributions measured downstream of the DBD for both discharge regimes (TD and FD) according to local and mean volume energy densities of the discharges. As diffusion and thermophoresis are negligible, one can assume that particle deposition is only due to electro-collection. So an analytical model of charged particle trajectory is presented and validated in controlled conditions with monodispersed singly charged particles injected in the discharge. The efficiency of electro-collection is computed from the model for different conditions of diffusion charging to account for the particle size distributions. Special attention is paid to charging of the particles to account for the fact that deposited nano-particles found both in the film as well as in suspension are smaller than 50 nm.
2.
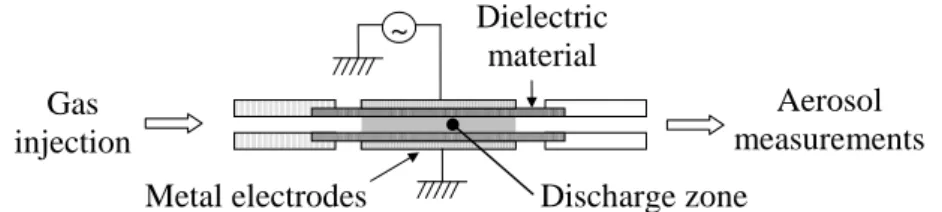
Experimental setupTwo parallel plates of alumina (thickness 0.5 mm), separated by 1 mm, were polarized by 3 cm long and 2 cm wide brass electrodes supplied by a 1-5 kHz sinusoidal power supply (cf. figure 1). Current and voltage were measured with an oscilloscope and treated as described in [19].
Figure 1: Experimental setup
The gas flow rate between the plates was adjusted between 2 and 4 L/min by mass flow controllers, leading to transit time and gas velocity in the reactor between 9, 18 ms and 1.6, 3.3 m.s-1 respectively. The experimental setup is detailed in [2].
The aerosol particle concentrations downstream of the DBD reactor were measured using a Condensation Particle Counter (CPC). The CPC counts particles from 0.005 to 3 µm using the principle of light scattering after growth by heterogeneous condensation of butanol. The size distributions of the particles were obtained by counting with the CPC after two size-selective devices (a diffusion battery and a Scanning Mobility Particle Sizer -SMPS-). The diffusion battery separates aerosol particles into ten stages from 0.002 to 0.2 µm. Each stage consists of a grid collecting a
Dielectric material Metal electrodes Gas injection Aerosol measurements Discharge zone ~
fraction of the particles by diffusion. At 0.9 L.min-1, the SMPS classifies particles with an electrostatic classifier from 8 to 350 nm into 128 stages. Before classification particles are neutralized by a radioactive source (Kr 85) leading to a Boltzmann charge distribution of the particles centred at zero (at 10 and 50 nm more than 99 % and 60 % of the particles are neutral, respectively).
3.
Experimental results in plane-plane AC DBD at atmospheric pressure3.1
Electrical characterisationDepending on the voltage frequency, applied voltage and Silane concentration, one can generate either FD or TD. TD in N2 requires seed electrons provided by secondary emissions due to metastable impact
and quenching on the dielectric surface [20].
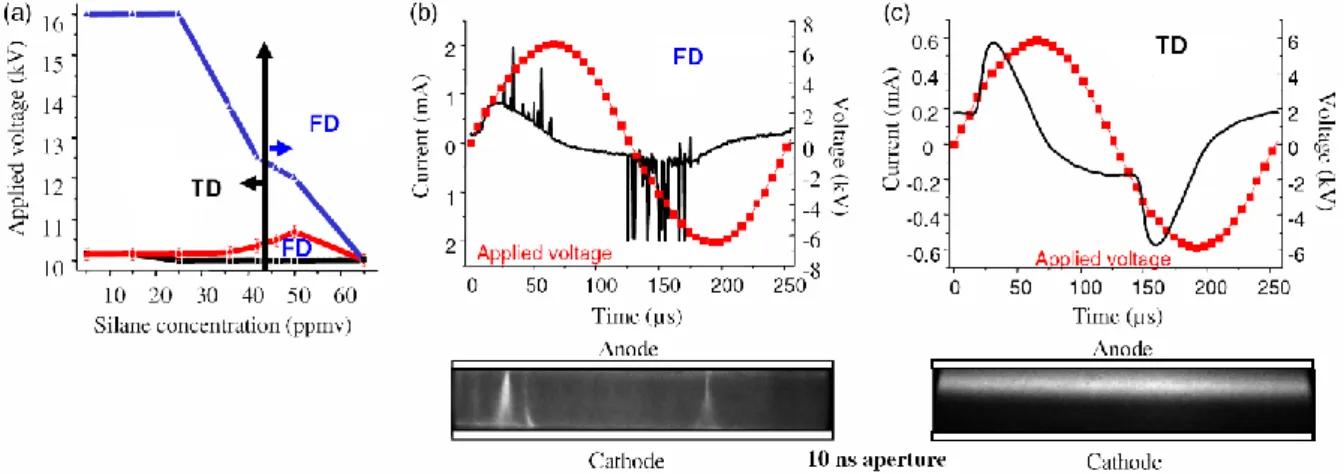
Figure 2 (a) shows the operating voltage and Silane concentration required for TD or FD at 4 kHz. TD occurs for a given voltage range depending on the Silane concentration, SiH4 being involved in the
quenching of metastables required for Penning ionization. Conversely, for a given Silane concentration, TD only exists at intermediate voltages. At higher voltage, electric field and ionization rate, Meek’s criterion is fulfilled and FD develop, as shown in figure 2 (b). At lower voltage, FD arise from insufficient secondary electron emissions from the cathode due to the small metastable flux. The two FD regimes will be referred to as the low and high power FD.
Figure 2 : Electrical characterization of plane-plane AC DBD at atmospheric pressure at 4 kHz.
TD produces lower densities of electrons, ions and metastables, which are more homogeneously distributed through the gap than in FD where these species are concentrated in transient and local streamer-like FD [12]. This enables comparison of the formation, charging and electro-deposition of nucleated particles involved in thin film deposition in both cases.
3.2
Physical nucleation by FD-surface interaction in nitrogenThe dynamics of formation by nucleation and growth by agglomeration of particles formed by filament-surface interaction in N2 without Silane precursor (already detailed in [12]) is used to depict
the mechanisms associated with production and transport of nano-particles. Townsend discharge (TD)
No aerosol is detected except when volatile organic compounds (from a silicon paste used for sealing) produce condensable species by plasma-gas interactions in the bulk gas leading to nucleated ultra-fine particles (dp<10 nm). Aerosol formation stops with desorption of the silicon paste solvent.
Filamentary discharge (FD)
In pure nitrogen as well as in N2/O2 mixtures (with only a few percent of oxygen), particles are
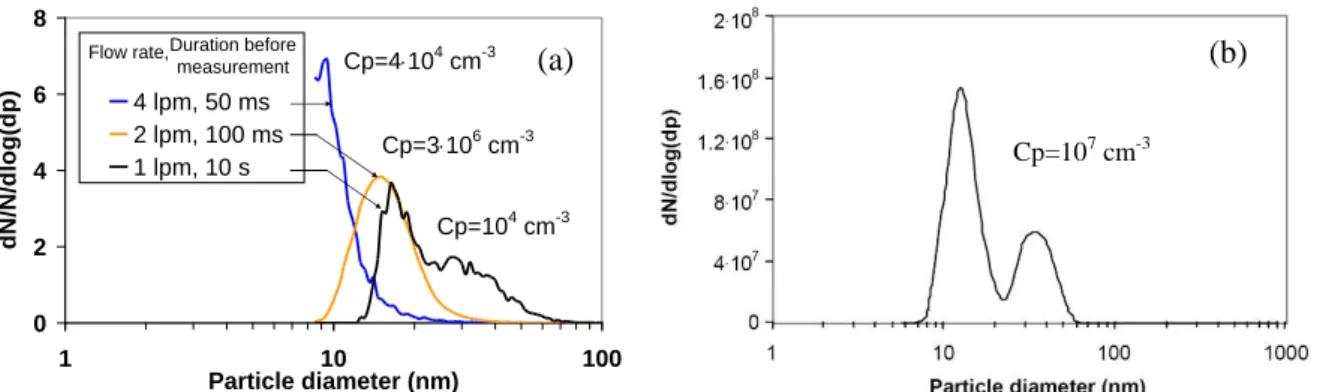
counted downstream of the plane-to-plane AC DBD reactor whatever the voltage amplitude and frequency are. Number-size distributions in pure N2 for different gas flow rate (the 10 s duration at 1
lpm is due to an additional volume in the outlet gas line) and in N2/O2 mixtures (99.5 % N2, 0.25 %
O2) are shown in Figure 3 (a) and (b) respectively. It should be emphasized that gas composition and
Figure 3: Size distribution of the particles produced by FD in dielectric barrier discharge measured (a) with SMPS in pure N2, Vpp=20 kV, P= 4 W, F=1 kHz, for different gas flow rates
and (b) with the diffusion battery in N2/O2 mixture, QN2=3 L.min -1
, Qair=0.4 L.min -1
, Vpp=18.4 kV, F=1.5 kHz and P=4.5 W
In Figure 3 (a), with decreasing gas flow rate, the number-size distributions of the particles evolve from monodisperse ultra-fine (< 20 nm) to bimodal size distribution. Ultra fine particles are produced by nucleation of vapour arising from the cathode plane (cf. section 1.). Once the particles are formed, they grow by Brownian agglomeration. From Figure 3 (b) and Figure 3 (a) for 1 L.min-1, the particle size distributions are bimodal and similar for different tools, validating the measurements. The larger size of particles measured with the SMPS than with the diffusion battery arises from the 10 s and 100 µs duration before measurement respectively.
Growth dynamics
The size distribution measured after a few hundred milliseconds is bimodal as expected for nucleated aerosol (e.g. with spark discharge [8], flame [21], or DBD [12]). Indeed, the initial unimodal size distribution evolves to transitory bimodal size distributions and finally turns into unimodal self preserving particle size distribution related to particle agglomeration [12, 15]. The self preserving size distributions are not reached in this case due to moderate particle concentration that would require longer growth times. The dynamics of particle growth depends on particle concentration, particle size and gas temperature.
The resulting transitory size distribution depends on radial distributions of condensable species and primary nano-particles around the source, related to characteristic times of cloud expansion, nucleation, condensation and agglomeration [12]. The transitory size distributions are composed of two modes.
The first mode, from a few to tens of nanometres, is related to nucleation and fast agglomeration of primary nucleated nano-particles in the production zone close to the vapour source.
As decreasing gas flow rate in Figure 3 (a) induces both (i) the increase of primary particle concentration and (ii) the increasing duration between DBD reactor and SMPS measurement favouring agglomeration, the second mode is related to Brownian agglomeration of particles from the first mode. Brownian agglomeration of particles from the first mode requires particle concentration above 108 cm-3 to be noticeable within the 100 ms transit time from the entrance of the reactor to the CPC [13]. The related total particle concentrations measured downstream of the DBD depend on gas flow rate, particle size and particle production rate (nucleation frequency). Except for 4 L.min-1, where the particle below 8 nm are not detected leading to an under-estimation of the total particle concentration, the mass flux downstream of the DBD is constant, showing that particles only grow by agglomeration during the post production transit (the 3106 and 104 cm-3 concentration measured at 1 and 2 L.min-1 are related to a mass detected per minute of 10 ng). In pure N2 and N2/O2 mixtures, the absence of
particles larger than 60 nm shows that particles do not have the time (≤ 100 ms) to grow above 60 nm due to moderate particle concentration.
Finally, such ultra-fine aerosol (<60 nm) can only arise from nucleation and pure agglomeration. The aim of the following section is to show that the same processes occur on the particles produced by reactive nucleation when a Silane precursor is injected in the discharge.
0 2 4 6 8 1 10 100 Particle diameter (nm) dN /N/dlog(d p) 4 lpm, 50 ms 2 lpm, 100 ms 1 lpm, 10 s
Flow rate,Duration before
measurement Cp=4104 cm-3
Cp=3106 cm-3 Cp=104 cm-3
(a) (b)
3.3
Reactive nucleation from plasma-Silane interaction for thin film depositionThis section deals with SiOx layer formation focuses on the mechanism of particle charging and
electro-deposition. When a few ppmv of SiH4 are injected with N2 and few 100 ppmv of N2O in the
plasma reactor, a SiOx layer is formed on the dielectric materials. Chemical pathways from Silane to
SiOx have been identified and modelled in low pressure rf-plasmas [10] and are similar at atmospheric
pressure [2].
With SiH4, aerosol concentration downstream of the DBD (~10 8
cm-3) is higher than for physical nucleation alone, proving that a portion of the particles detected arises from reactive nucleation. The 100 ms duration between DBD reactor and particle measurement is short enough to keep the size distribution unchanged according to dynamics growth, the size distributions are related to the mechanisms occurring in the DBD reactor. A special attention is paid to charging of the nano-particles to account for the fact that deposited nano-particles included in the film as well as suspended are smaller than 50 nm. The efficiency of collection is computed from the model of electro-collection for different diffusion charging conditions to highlight an eventual additional mechanism involved in the charging of particles and/or size dependant charging condition seen by particles.
Mechanisms of SiOx layer formation
Figure 4 shows relative Silane density, particle concentration and typical layer formed along the reactor in a TD.
Figure 4: SiOx film formation in N2/SiH4/N2O side and upper SEM image by TD
The SiOx film at the surface is formed, near the inlet of the reactor by a radical flux, followed by a
combined deposition of radicals and particles and ending with particles only near the reactor outlet [2]. The Silicon mass balance shows that aerosol downstream of the DBD reactor contains only 0.1 % (from 1 up to 20 ng.min-1) of the incoming Silicon, so that most of the precursor is deposited in the film.
The radical flux leads to a dense SiOx layer formed by Chemical Vapour Deposition (CVD). The
combined deposition of radical and particle leads to adherent coatings of agglomerated nano-SiOx
particles with a cauliflower structure (as in low pressure plasmas [22]); radicals enable strong covalent bonds between nano-particles in the film and between the film and the substrate. Lastly, nucleated nano-particles formed in the gas are deposited on the surface. This final unadherent film probably arises from the deep decrease in the radical concentration limiting surface radical and cohesion of agglomerated nano-particles.
Nano-particle diameter included in the film is smaller than 50 nm. This confirms that particles are formed by reactive nucleation, from reactant injection up to a few centimetres, when no more reactant is available after a transit of a few milliseconds, according to local volume energy density, input power, SiH4 concentration and gas flow rate, as detailed below.
Layer profile according to local and mean volume energy densities
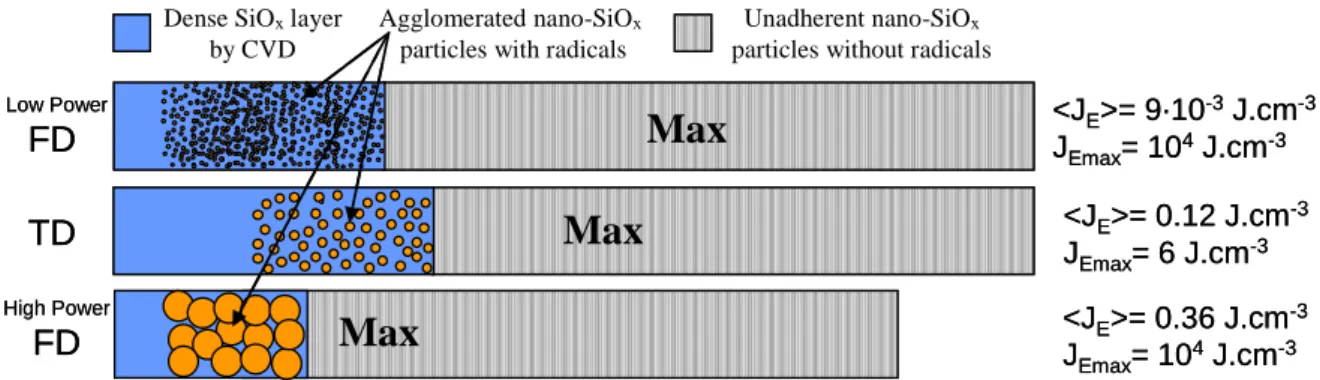
Figure 5 shows the typical profiles of the layer versus the position along the direction of the gas flow in both FD and TD for a given SiH4 concentration. The structures of the layers formed at the surface
Relative Silane density Nucleated particle concentration
Sides view Upper
view
Dense SiOxlayer
by CVD
Unadherent nano-SiOx
particles without radicals Gas
Agglomerated nano-SiOx
particles with radicals SiOxfilm substrate Radicals SiHxOy Radicals and Particles Only Particles 3.4 ms 10 ms 0.1 % of incoming Si ~ 1 % of deposited particles x 300 nm
Relative Silane density Nucleated particle concentration
Sides view Upper
view
Dense SiOxlayer
by CVD
Unadherent nano-SiOx
particles without radicals Gas
Agglomerated nano-SiOx
particles with radicals SiOxfilm substrate Radicals SiHxOy Radicals and Particles Only Particles 3.4 ms 10 ms 0.1 % of incoming Si ~ 1 % of deposited particles x 300 nm t0
are similar whatever the discharge regime is (dense SiOx layer, agglomerated nano-SiOx and
unadherent nano-SiOx). The term Max in the figure 5 represents the position of the maximal thickness
of the layer. The mean energy density is computed from the ratio of the input power, P and the gas flow rate, Q; <JE>=P/Q). The local volume energy density is computed either from the ratio of the
energy per filament, E and the volume of the filament, V (JEmax=E/V) for FD or from the ratio of the
maximum energy yield and the volume of the discharge zone for TD.
Figure 5: Typical upper views of a coating along the direction of the gas flow in TD and low and high energy FD
The radical flux stops when no more SiH4 is available. At first approximation, it coincides with the
end of the dense SiOx layer (i.e. the beginning of the unadherent nano-SiOx particles) and is related to
both local and mean volume energy density. Indeed, the CVD ends faster in FD than TD, due to faster reactions expected from the higher local volume energy density in FD leading to higher active species densities in FD than in TD. Moreover, CVD stops faster in high power FD than in the low power FD, which is related to a faster consumption of the reactants induced by higher mean volume energy density due to more numerous filaments per unit time and surface. It should be emphasized that the characteristics of the filaments evolve along the reactor according to the structure of the layer.
The mean formation time of the particles ( 3.8 ms), the size of agglomerated nano-SiOx and the
maximal thickness of the film depend on the mean volume energy density [2]. The local volume energy density defines the minimal formation time of the particles (about 0.7 ms for DF and 2.3 ms for DT).
Despite similar structures, the agglomerated nano-SiOx particles are formed closer to the precursor
injection in FD than in TD, implying a faster formation and growth of nucleated nano-particles with FD, as required to account for the faster electro-deposition. Indeed, faster particle formation in FD than in TD is due to higher local volume energy density leading to higher reactive species concentration implying faster formation kinetics of condensable species resulting in higher nucleation frequency. Higher local primary nano-particle concentration in FD than TD leads to higher agglomeration rate and faster particle growth. Moreover, the extra-source of nano-particle from FD-surface interaction triggers the nucleation of condensable SiOx particles increasing the nucleation
frequency.
In the case of high power FD, for high mean volume energy density (for instance JE=0.36 J.cm -3
in Figure 5), there are no more nano-particles produced by reactive nucleation at the end of the reactor, as all the SiOx has already been deposited. Only particles produced by physical nucleation are detected
downstream of the DBD as already described in section 3.2. The mean volume energy density threshold depends on SiH4 concentration. Then, to measure the size of nano-particles produced by
reactive nucleation, the mean volume energy density is adjusted below the threshold.
Mechanisms of charging and analytical model of electro-collection
The charging of nano-particles can occur via one or two steps: (i) during the formation by eventual ion-induced nucleation and (ii) after the production during the transit in the DBD. In this part, only the post-production charging by ion diffusion is considered; eventual additional photo-charging will then be discussed (cf. paragraph entitled particle charging related to size distribution).
Due to the lack of experimental and theoretical data in highlyheterogeneous ion densities in space and time, classical diffusion charging laws, validated in quasi-homogeneous ion densities, are used to investigate particle charging and electro-collection of nucleated nano-particles with an analytical
<JE>= 9·10-3J.cm-3 JEmax= 104J.cm-3
Max
Max
Max
Low PowerFD
TD
High PowerFD
<JE>= 0.12 J.cm-3 JEmax= 6 J.cm-3 <JE>= 0.36 J.cm-3 JEmax= 104J.cm-3 Dense SiOxlayerby CVD
Agglomerated nano-SiOx
particles with radicals
Unadherent nano-SiOx
particles without radicals
<JE>= 9·10-3J.cm-3 JEmax= 104J.cm-3
Max
Max
Max
Low PowerFD
TD
High PowerFD
<JE>= 0.12 J.cm-3 JEmax= 6 J.cm-3 <JE>= 0.36 J.cm-3 JEmax= 104J.cm-3 Dense SiOxlayerby CVD
Agglomerated nano-SiOx
particles with radicals
Unadherent nano-SiOx
model of electro-collection developed previously [16]. The mean charging condition (product of ion density and transit time in the ion cloud) is estimated using various assumptions. Then, the particle charge is calculated from theoretical laws for each particle diameter. Finally, the efficiency of electro-collection is computed from the model to account for the size selective deposition mechanism in agreement with the size of the particles smaller than 50 nm both included in the layer and measured downstream of the DBD.
The model of charged particle trajectory in an AC electrical field without discharge only accounts for electrical and viscous drag forces, assuming a parabolic gas velocity profile. Moreover, as the working frequency is below 5 kHz, the increase of gas and surface temperatures is only a few Kelvin; thermophoresis force can thus be neglected. Besides, diffusion losses are negligible within the few ms transit time in the DBD reactor, whatever the particle size is.
The electro-collection of initially monodispersed and singly-charged particles (20, 30, 50 and 70 nm) has been investigated in air. In a laminar flow regime, the collected fraction of the particles depends on the amplitude of motion of the particle which is related to the particle electrical mobility, the peak-to-peak applied voltage (Vpp) and the frequency (F) of the applied voltage. Indeed, resolving
Newton’s second law of motion with electrical and viscous drag forces, the amplitude of the particle motion, zp can be approximated, for particles smaller than 100 nm and frequency below 60 kHz by:
F E µ zp p . 2 .
(1)Where E is the amplitude of the electrical field in the gap, F is the frequency of the applied voltage and µp is the particle mobility.
p p p p d d Cu e n . . 3 ) ( . .
(2)Where np is the number of charges, e is the charge of an electron, Cu is the Cunningham correction
factor, is the air viscosity and dp the particle diameter.
For residence time longer than a voltage period, the collection efficiency of charged particles is independent of the gas velocity. Total collection in the DBD occurs only for particles with electrical mobilities higher than the critical mobility (µc) whatever their positions in the gap are. µc can be
written as, pp r c
V
d
F
d
e
2
.
.
2.
.
2
1
, (3)where d is the distance between the dielectrics (i.e. the gap width), e is the dielectric plate thickness and r is the relative dielectric constant of alumina. To account for the proportionality between the
amplitude of the electrical field and the applied voltage leading to equation (2) it has to be mentioned that surface polarization by FD does not modify the collection efficiency as demonstrated for 20 nm singly charged nano-particles (cf. Figure 6).Thus the amplitude of homogeneous electric field in the gas or Laplace field is used to describe electro-collection. For the experimental conditions in this work (F=4 kHz, d=1 mm and 11<Vpp<18 kV), the critical mobility is about 2.10-6 V.m-1.s-1.
The collection efficiency is po-Cp)/Cpo where Cpo is the initial output concentration
without applied voltage and Cp is the output concentration. The amplitude of the particle movement zp
defined in equation (1) defines the two collection volumes of the particles above the dielectrics; collection efficiency is calculated by integration of the particle flux in those volumes [16].
2 33
)
2
(
4
6
3
d
d
z
d
z
d
p p
if zp < d/2 (4) 1
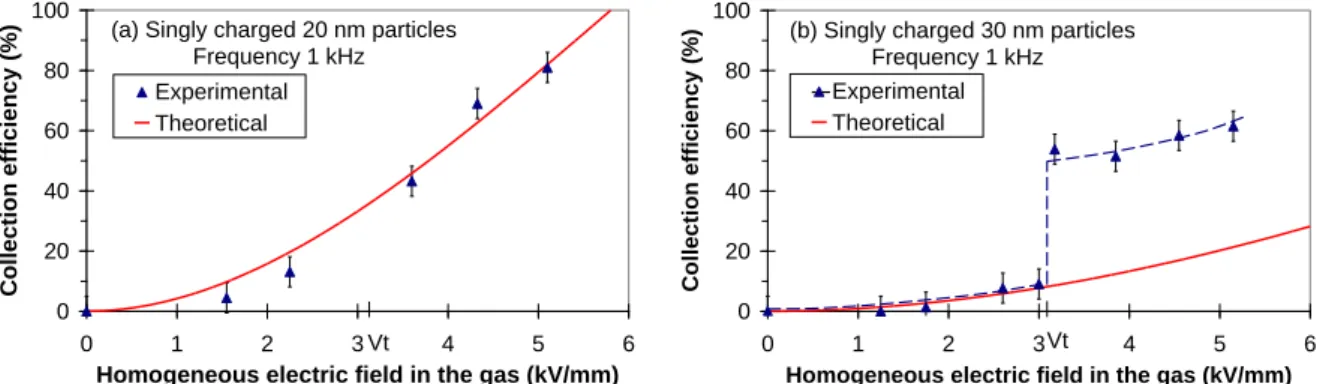
if zp ≥ d/2Figure 6 shows theoretical and measured collection efficiencies of initially singly charged particles of 20 and 30 nm diameters injected in the gap versus the homogeneous electric field at 1 kHz.
Figure 6: Collection efficiencies versus electric field in 1 kHz DBD for singly charged particles of (a) 20 nm and (b) 30 nm diameters, Vt is the discharge voltage threshold
As collection efficiencies of singly charged particles injected in the gap are consistent with the model for the singly-charged 20 nm particles, charging during the transit can be neglected, as expected from low charging efficiency for this particle size (cf. Figure 8). Moreover transient field modifications by surface polarization at the feet of FD can be neglected to assume a sinusoidal homogeneous field for ac electro-collection [16].
For 30 nm and bigger singly-charged particles, the model is also relevant. Higher electro-collection efficiencies than those calculated for singly charged particle are caused by additional charging during the transit in the DBD reactor. The initially singly charged 30 nm particles reach a mean charge of 1.8, as described in the paragraph entitled charging conditions.
P article size distribution downstream of the DBD for both FD and TD
With 2.4 ppmv of SiH4 and 190 ppmv of N2O in N2, for a gas flow rate of 2.4 L/min, an attempt has
been made to detect particles in suspension after the deposition reactor using either FD or TD.
At 4 kHz, the discharge regime depends on the peak-to-peak applied voltage (cf. Figure 2). For V1=11.9 kV, the discharge is considered as TD like as it is an homogeneous TD discharge with only 1
micro-discharge every three half periods. For V2=15.5kV, there are approximately 20
micro-discharges per half period per cm2, superimposed on a TD. The discharge obtained for V2 is therefore
a mix between TD and FD. The power dissipated in the discharge for V1 and V2 are respectively 1.3 W
and 10 W and the mean volume energy densities are 0.032 and 0.25 J.cm-3, below the threshold required to prevent from total collection of the SiOx nano-particles in the deposit reactor, as described
above (cf. Figure 5).
The total concentration of particles is approximately 108 cm-3 for V1 and V2. This is one order of
magnitude higher than the maximum value found without SiH4 (Figure 2), so that at least 90 % of the
detected particle arise from nucleation of condensable SiOx species.
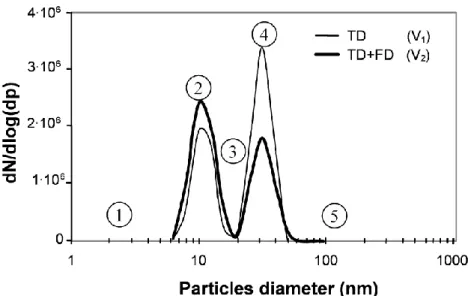
The number-size distributions of the particles for V1 and V2 are shown in Figure 7. As already
observed on MEB images of the film [2], these measurements confirm that both TD and FD induce gas-to-particle conversion (nucleation) when SiH4 is used to produce thin SiO2 films for both
discharge regimes, contrary to pure physical nucleation only reported for filament surface interaction. Numbers from 1 to 5 will be used to depict the particle size distributions with respect to growth dynamics and electro-collection.
0 20 40 60 80 100 0 1 2 3 4 5 6
Homogeneous electric field in the gas (kV/mm)
Colle cti on effi ci en cy (%) Experimental Theoretical
(a) Singly charged 20 nm particles Frequency 1 kHz Vt 0 20 40 60 80 100 0 1 2 3 4 5 6
Homogeneous electric field in the gas (kV/mm)
Co ll ection effi ciency ( %) Experimental Theoretical
(b) Singly charged 30 nm particles Frequency 1 kHz
Figure 7: Size distributions of particles produced by DBD in N2/SiH4/N2O mixture, frequency of
4 kHz, voltage amplitude of a) V1=11.8 kV leading to a TD b) V2=15.5 kV leading to a mix of FD
and TD.
As for pure physical nucleation with filament-surface interaction, reactive nucleation leads to bimodal size distributions for both discharge regimes. It can be reasonably assumed that nucleation and particle growth dynamics by Brownian agglomeration account for the bimodal size distribution whatever the origin of the condensable species is, from the brief and localized cathode spot on the surface at the base of the discharge filament or from gas-phase reactions with a Silane precursor in FD or in TD as described in section 3.2.
Moreover, to account for the fact that no particle above 50 nm are included in the layer and for the particle size distribution (99 % of particles smaller than 50 nm), the same size-dependent particle charging is involved in both regimes; even if production rate, growth and charging dynamics are faster in FD as described above for production and growth and detailed in the paragraph below for charging. Indeed, as the charging of particles depends on their size, the electrostatic collection (implying an efficient charging during formation and growth) probably plays a major role in this size selective deposition mechanism as discussed below.
Charging conditions
The competition between particle extraction and collection is depicted here for different sizes using the electro-collection model, depending on the particle charge. The charging conditions used for the diffusion charging theories are Ni. products of 109 and 107 s.cm-3 to be compared to the standard 107 s.cm-3 in corona charger (107<Ni<109 cm-3 and 0.01<<1 s).
The Ni. products are estimated by the time-integration of the ion density along the 10 ms particle trajectory considering a linear trajectory. For FD, the maximum ion density in a filamentary discharge channel is about 1016 ions per cm-3 and some ions remain in the gas for a few µs due to dielectric surface polarization with a spatial extension of a few hundred µm [23]. Assuming 20 filaments per half period per cm2 homogeneously distributed on the surface, the particle moves across about 10 ion clouds with an average ion density of 1011-13 per cm-3 in each cloud, and spend only 0.1 ms in each of those clouds (0.1 % of its transit time), leading to a mean Ni. product between 107 and 109 s.cm-3.
Besides, the range of Ni. products is validated by partial charging laws related to the fraction of neutral particles. It concerns the smallest particle below a few tens of nm. The neutral fraction, fn can
be estimated from:
. . .
4 exp d2c Ni fn p i , (5)where
c
iis the mean thermal ion velocity (m.s-1) [24].From Figure 7, particle of 10 nm are detected and, according to the electro-collection model, charged 10 nm particles are collected, thus a portion of the 10 nm particles is neutral. According to relation (5), the mean Ni. product is thus below 109 s.cm-3.
For TD, the maximum ion density in the gap is lower (about 1011 cm-3) but more homogeneously distributed in time and space and for a longer duration than within the filament (about 80 µs in each half period of 150 µs). The spatial distribution of successive positive ions clouds, with a brief transient electron density at the field inversion leads to particles charged in both polarities with a higher probability for positive charge. The mean Ni. products are lower than for FD about 106-7 s.cm-3. Figure 8 shows the number of charges per particle required to reach the critical mobility at 4 kHz for an amplitude of the Laplace field of 7∙106 V.m-1 at an applied voltage of 15.5 kV (solid line), as well as the charge number acquired by diffusion charging according to Fuchs’s theory [25] (dotted lines) versus particle diameter.
Figure 8: Number of charges per particle required for total collection and acquired by diffusion charging
The number of charges required for total collection (solid line) related to electrical mobility of 2.10-6 V.m-1.s-1 (cf. critical mobility from the model of electro-collection) corresponds to singly-charged particles of 10 nm diameter. Thus, if formed, initially singly charged clusters are collected. As expected, the number of charges per particle required for total collection increases with particle diameter (14 charges for a 40 nm particle).
Particle charging related to size distribution
From Figure 8, the computed numbers of charges per particle acquired by diffusion charging in both charging conditions are far below the required value for total collection, which is in agreement with the fact that particles are detected downstream of the DBD.
The mean charge calculated for particle below 20 nm is less than one due to partial charging. A portion of the particles smaller than 20 nm is neutral and exits the DBD reactor.
Moreover, above 10 nm, the discrepancy between the charge numbers, required to reach the critical mobility and acquired by diffusion charging increases with particle diameter so that smaller particles are better collected than larger ones.
The first and the second modes (cf. Figure 7) are thus the consequences of both the growth and charge dynamics and the electro-collection (partial charging and decreasing electro-collection with particle size respectively) as detailed below.
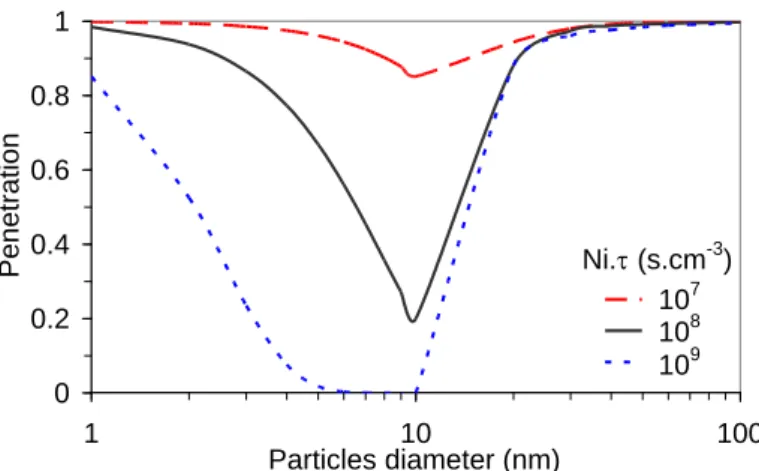
Figure 9 shows the penetration of a particle, P (P=1-Cp/Cpo) calculated from equation (4) versus
particle diameter for different mean Ni. products taking into account the mean charge per particle and the charged fraction presented above. The particle penetration would correspond to particle size distribution downstream of the DBD if an aerosol containing an iso-concentration of all particle size was injected in the DBD and charged only by diffusion, without taking into account particle growth dynamics. These calculations can be used to depict the size distributions presented in Figure 7.
1 10 100 0 20 40 60 80 100 Particle diameter (nm) Nu mbe r of ch arge per particle
acquired by diffusion charging Ni.=109 s.cm-3
required for total collection Ni.=107 s.cm-3
Figure 9: Calculated electro-collection efficiency according to particle charging with 107<Ni.∙1012 s.cm-3
The high penetrations are related to partial charging for ultra fine particles and to low electrical mobilities for larger particles. Maximum collection is reached for 10 nm particles. If the calculated penetrations are compared with the measured particle size distributions, the shapes of the curves are similar in the intermediate particle size. The minimum penetration (10 nm) is different from the minimum of the size distributions around 20 nm, different assumptions to deal with this shift are discussed below. Only the particle growth dynamics can account for the boundaries below 10 nm and above 30 nm.
To sum up, the particle size distributions of the particles (cf. Figure 7 and numbers from 1 to 5) are related to both particle growth and charge dynamics and electro-collection:
There are few particles under 6 nm (1) due to fast agglomeration consuming primary nano-particles and to eventual initial electro-collection of the high electrical mobility nano-particles formed by ion-induced nucleation.
The first mode around 10 nm (2) is related to nucleation of condensable SiOx species and partial
charging; some of these particles are not charged and thus not collected.
Few particles are detected around 20 nm (3), which corresponds to particles growth dynamics and high particle electro-collection efficiencies.
The second mode around 30 nm (4) is related to Brownian agglomeration of particles from the first mode. All the particles are charged but weaker electrical motilities of particles leads to weaker electro-collection than for smaller particles.
There are no particles larger than 50 nm (5), due to moderate particle concentration and a transit time shorter than characteristic agglomeration time for the 20-50 nm particles preventing growth by Brownian agglomeration.
To account for the discrepancy between the results of the electro-collection model and particle size measurements electric field, particle charge and particle transit time could be involved. The calculated electric field is valid, as the model has been validated by injection in the discharge of particle in well-controlled conditions. In the model, the particles are supposed to get charged only by diffusion with a linear trajectory. Three additional effects should be taken into account to deal with particle charging.
Energetic photons emitted by the excited molecules may lead to particle charging by photo-emission increasing mean charge per particle and probably modifying the charge-diameter relation.
Particles can be trapped in potential wells between space charges left by the FD increasing the transit time and the probability of electro-collection.
Al last, the effect of particle trajectory on charging should be considered. Indeed, particle charging rate and subsequent kinematics influence the ion density seen by a particle according to its size, probably leading to a different charge-diameter relation than the ones established in quasi-stationary ion density profile.
0 0.2 0.4 0.6 0.8 1 1 10 100 Particles diameter (nm) Pen etration 107 108 109 Ni. (s.cm-3)
4. Conclusions
Without a precursor, particles are only detected downstream of the DBD when filament-surface interactions occur. With a Silane precursor, plasma-volume interaction leads to the formation of nano-particles in both Filamentary Discharge (FD) and Townsend Discharge (TD).
Both filament-surface interaction in N2 and plasma-volume interaction with Silane lead to bimodal
particle number size distributions corresponding to nucleation and agglomeration modes. The dynamics of particle formation by nucleation and of size evolution by agglomeration are similar whatever the origin of the condensable species is (from the brief and localized cathode spot on the surface at the base of the discharge filament or from gas-phase reactions with a Silane precursor in FD or in TD).
With respect to thin SiOx film growth mechanisms, when a Silane precursor is used, these
measurements prove that nano-particle production and electro-deposition are involved in the film formation. To account for the particles below 50 nm being included in the layer (confirmed by characterization of particles downstream of this deposition reactor), a similar selective size-dependent particle charging and electro-collection mechanism is involved in both TD and FD, even if the charging conditions are very different due to different charge dynamics coupled to particle trajectory. Despite similar structures, the layer is formed closer to the precursor injection in FD than in TD, implying faster formation, growth and charging of particles in FD compared to TD. Indeed, the higher local volume energy density in FD than in TD leads to higher local concentrations of both active species involved in chemical reactions to form nano-particles, and of ions involved in particle charging.
These mechanisms may also arise when a different gaseous organo-silicon precursor is used such as tetraethoxysilane (TEOS) or tetramethylsilane (TMS). Nano-particles of defined structure and size could be used to reach specific properties of the film as far as electro-deposition is controlled versus the dynamics of formation and growth and the charging conditions related to applied voltage and frequency.
The charge per particle reached in plane-to-plane FD is higher than in quasi-stationary ions density profiles of DC corona. Transient charging conditions i.e. in varying electrical field and charge densities seems favourable, additional charging mechanisms and charging conditions leading to the higher charge require further investigations.
Acknowledgements
The authors thank Dr. Alexandre Chirokov and Dr. Emmanuel Marode for helpful discussions about ion densities in the channel of filamentary discharge.
References
[1] Smith D L, Alimonda A S 1993 Chemistry of SiO2 plasma deposition J. Electrochem. Soc. 140 No
5 pp. 1496-1503
[2] Martin S et al. 2004 Atmospheric pressure PE-CVD of silicon based coatings using a glow dielectric barrier discharge, Surf. Coat. Technol. 177-178, pp. 693-698
[3] Alexandrov S E, Hitchman M L 2005 Chemical Vapor Deposition Enhanced by Atmospheric Pressure Non-thermal Non-equilibrium Plasmas Chemical Vapor Deposition 11 No 11-12 pp. 457-468
[4] Bhandarkar U V et al. 2000 Modelling of silicon hydride clustering in a low-pressure silane plasma J. Phys. D: Appl. Phys. 33 2731–2746.
[5] Bouchoule A 1999 Dusty Plasmas: Physics, Chemistry and Technological Impacts in Plasma Processing ed A Bouchoule (Chichester: Wiley)
[6] Hollenstein Ch 2000 The physics and chemistry of dusty plasmas Plasma Phys. Control. Fusion 42 R93–R104.
[7] Nolan P J and Kuffel E 1957 Metal point discharge nuclei and the production of multiply charged ions from condensation nuclei, Geofis.Pura Appl. 36 pp. 201–210
[8] Horvath H and Gangl M 2003 A low-voltage spark generator for production of carbon particles,
Journal of Aerosol Science 34 pp. 1581–1588
[9] Borra JP et al.1998 Electrical discharge regimes and aerosol production in point-to-plane dc high-pressure cold plasmas: Aerosol production by electrical discharges J. Aerosol Sci. 29 (5-6) pp. 661-674
[10] Gupta N., et al. 2003 Numerical simulation of primary cluster formation in Silane plasmas J. Phys.
D: Appl. Phys. 36 pp. 837–841
[11] Ichitsubo H et al. 1996 Behavior of Ultrafine Particles generated from organic vapors by corona ionizers Particle and Particle Systems Characterization 13 No 1 pp 2-54
[12] Borra J P 2006 Nucleation and aerosol processing in atmospheric pressure electrical discharges: powders production, coatings and filtration J. Phys. D: Appl. Phys. 39 R19–R54
[13] Hinds W 1999 Aerosol technology (Wiley-Interscience, New York)
[14] Bunz H D and Lugi R 1991 Numerical studies of aerosols in smog chambers J. Aerosol Sci. 22 pp. 441–65
[15] Dekkers P J and Friedlander S K 2002 The Self-Preserving Size Distribution Theory I. Effects of the Knudsen Number on Aerosol Agglomerate Growth Journal of Colloid and Interface Science 248, pp. 295–305
[16] Jidenko N and Borra JP 2005 Kinematics of charged nanometric particles in silent discharges J.
Phys. D: Appl. Phys. 38 pp. 617-620
[17] Massines F et al. 2003 Physics and chemistry of a glow dielectric barrier discharge at atmospheric pressure: diagnostics and modelling, Surface and Coating Technology 174-175C, pp. 8-14
[18] Kozlov K V et al. 2005 Investigation of the filamentary and diffuse mode of barrier discharges in N2/O2 mixtures at atmospheric pressure by cross-correlation spectroscopy J. Phys. D: Appl. Phys. 38
pp. 518–529
[19] Petit M et al. 2002 Electrical characterization of gas discharges using a numerical treatment. Application to dielectric barrier discharges Review of scientific instruments 73 (7) pp. 2705-2712 [20] Nasser E 1971 Fundamentals of gaseous ionization and plasma electronics (New York: Wiley-Interscience)
[21] Xiong Y and Pratsinis SE 1993 Formation of Agglomerate Particles by Coagulation and Sintering
J. Aerosol Sci. 24 pp. 283–301
[22] Haaland P D et al.1994 On form and flow in dusty plasmas Plasma Sources Sci. Technol. 3 pp. 381-387
[23] Chirokov A et al. S 2004 Analysis of two-dimensional microdischarge distribution in dielectric-barrier discharges Plasma Sources Sci. Technol. 13 pp. 623-635
[24] Pui D Y H et al. 1988 Unipolar diffusion charging of ultrafine aerosols J. Aerosol Sci. Technol. 8 pp. 173–187
[25] Fuchs N A 1963 On the stationary charge distribution on aerosol particles in a bipolar ionic atmosphere Geofisica Pura e Applicata 56 1 pp. 185-193.