HAL Id: hal-00845894
https://hal.archives-ouvertes.fr/hal-00845894
Preprint submitted on 18 Jul 2013
HAL is a multi-disciplinary open access
archive for the deposit and dissemination of
sci-entific research documents, whether they are
pub-lished or not. The documents may come from
teaching and research institutions in France or
abroad, or from public or private research centers.
L’archive ouverte pluridisciplinaire HAL, est
destinée au dépôt et à la diffusion de documents
scientifiques de niveau recherche, publiés ou non,
émanant des établissements d’enseignement et de
recherche français ou étrangers, des laboratoires
publics ou privés.
Morphology and dynamics
Germán Varas, Jean-Christophe Géminard, Valérie Vidal
To cite this version:
Germán Varas, Jean-Christophe Géminard, Valérie Vidal. Air invasion in a granular layer immersed
in a fluid: Morphology and dynamics. 2013. �hal-00845894�
(will be inserted by the editor)
Air invasion in a granular layer immersed in a fluid:
Morphology and dynamics
Germ´an Varas · Jean-Christophe G´eminard · Val´erie Vidal
Received: date / Accepted: date
Abstract We investigate the morphology and
dynam-ics of the region invaded by air injected at the bottom of an immersed granular bed. Previous experimental re-sults point out the formation of a fluidized zone with a parabolic shape which does not depend, in the sta-tionary regime, on the injection flow-rate. By tilting the experiment, we can tune the effective gravity in the sys-tem. We show that it does not affect significantly the morphology either. A numerical study made it possible to access the typical height and width of the structure, which are governed by the relative effects of gravity and capillarity. After a brief review on this subject, we propose first, new experimental observations on the air invasion regimes and on the morphology of the fluidized zone, in particular its growth dynamics; then, we com-plement the previous numerical study by considering the influence of the bottom boundary condition. In par-ticular, we quantify the morphology of the invaded re-gion when the gas is injected in the bulk, thus when air is likely to propagate downwards. These results are of practical importance in the prediction of the
morphol-G.V. acknowledges a grant by CONICYT (Comisi´on Na-cional de Investigaci´on Cient´ıfica y Tecnol´ogica, Gobierno de Chile) and financial support from FONDECYT Project No.11121300.
G. Varas
Instituto de F´ısica, Pontificia Universidad Cat´olica de Val-para´ıso, Avenida Brasil 2950, ValVal-para´ıso, Chile.
Previously at Laboratoire de Physique, Universit´e de Lyon, Ecole Normale Sup´erieure - CNRS, 46 All´ee d’Italie, 69364 Lyon Cedex 07, France.
J.-C. G´eminard · V. Vidal
Laboratoire de Physique, Universit´e de Lyon, Ecole Normale Sup´erieure - CNRS, 46 All´ee d’Italie, 69364 Lyon Cedex 07, France. E-mail: [email protected]
ogy of gas invasion in soils, from CO2sequestration to
pollutant propagation.
Keywords Granular flow · Fluidization · Patterns
PACS 83.80.Fg · 47.57.Gc · 47.85.Dh
1 Introduction
Gas invasion in an immersed granular layer is a wide-spread phenomenon of striking importance in many con-texts, from oil industry [1,2] to soil decontamination, where air injection in the subsurface and its subsequent rising by buoyancy removes or chemically degrades the contaminants [3]. In natural processes, piercement struc-tures display many examples of such phenomenon [4]. A highly pressurized fluid (liquid or gas) rises from a given source at depth through sediments or crustal rocks, leading to partial fluidization or liquefaction of the granular matrix. The shape of the fluidized zone, in-ferred from geophysical measurements, widens upwards, and may form a crater at the surface. These structures are encountered worldwide and at different scales, from kilometers (kimberlite pipes [5], mud volcanoes [6]) to hundreds or tens of meters (hydrothermal vents [7], sub-marine pockmarcks [8]).
Previous experimental works have been proposed to model this phenomenon in the laboratory. Two-phase flow experiments (gas/grains or liquid/grains) pointed out the existence of three different regimes when the gas or liquid injection flow-rate increases [1,9–11]: at low flow-rates, the system acts as a rigid porous medium and the fluid (gas or liquid) percolates through the granular matrix without any significant grain motion; at intermediate flow rates, the medium starts deform-ing, with the onset of small-scale instabilities and
pip-ing; at large flow-rate, explosion at the surface and flu-idization of the medium is reported (hydraulic failure). Many numerical models have been developed, most-ly in 2D, to investigate such mechanisms. They include different growth processes such as the Eden cluster model [12], ballistic models [13,14], dendritic growth or the Diffusion-Limited Agregation (DLA) [15]. These mod-els extensively studied the invasion process without ex-ternal forces (e.g. [16–18]) or, in the last twenty years, the destabilization induced, for example, by the pres-ence of gravity in the system [19–21].
Investigating three-phase flow systems (i.e. the in-jection of a fluid A in a granular medium immersed in a fluid B), is even more complex, in particular when it in-volves the grains displacement and the dynamics of the propagation front. Experiments of air injection in a sus-pension confined in a horizontal Hele-Shaw cell, where the grain density matches the host fluid, revealed a wide range of morphologies, from the classical Saffman-Taylor instability to fingering in a fixed porous medium [22]. A recent study by Sandnes et al. [23] proposed a unified phase-diagram of the different morphologies of air invasion when injecting air into an immersed loose granular medium confined in a horizontal Hele-Shaw cell. The introduction of inter-particule friction and sedimentation revealed three pertinent parameters: the granular filling fraction, system stiffness (related to the volume of the air reservoir) and air injection rate. Reports of several invasion morphologies, from stick-slip bubbles to fingering or fracturing, were explained in the frame of the transition between a frictional and viscous regime.
In a recent work, we investigated experimentally [24] and numerically [25] the morphology of the region in-vaded by the gas when air is injected punctually at the bottom of an immersed granular bed in a vertical cell. The influence of the effective gravity in the system can be tuned by tilting the experimental cell or by varying the numerical parameters [25]. From experimental ob-servations we reported two different invasion regimes: percolation and fracturing of the medium. Here, we re-port a new regime of stable channels, in particular when the effective gravity in the system is low. At long times, a fluidized zone forms and its morphology in stationary state was investigated [24,25]. We complement these re-sults by the study of the transient regime and growth dynamics of the fluidized region. Finally, the previous numerical study [25] was inspired by experimental re-sults obtained in a vertical Hele-Shaw cell where the gas was injected locally at the base of the immersed granular material. Thus, in the numerical calculation, we did not permit the gas to propagate downwards be-low the injection point. In many situations, however,
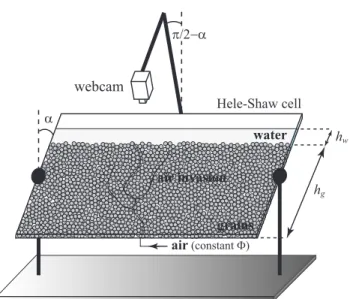
α π/2−α webcam water grains air Hele-Shaw cell hg hw (constant Φ) air invasion
Fig. 1 Experimental setup. Air is injected at constant flow-rate Φ at the bottom of a granular layer immersed in water (see text). The effective gravity in the system is tuned by tilting the cell between α = 0 (vertical) and α = π/2 (hori-zontal).
the propagation of air in a porous medium, biaised by gravity, is not limited by a solid bottom wall and the gas can explore freely all directions. In particular, we mention the example of liquid injection in the ground for enhanced oil recovery [26], or the recent topic of CO2 storage which aims at reducing greenhouse effect
and global warming by injecting carbon dioxide sev-eral hundred meters below in the subsurface [27,28]. In this latter case, it is important to estimate the mor-phology of the region invaded by the gas below the in-jection point [29]. Any large-scale CO2 release could,
indeed, perturbate the carbon-cycle and is likely to in-duce global climate changes [30]. Here, we complement the previous numerical results [25] by quantifying the morphology of the invaded region when the gas is in-jected in the bulk, thus when air is likely to propagate downwards. We analyze how the boundary condition at the bottom alters the final morphology of the invasion zone. In particular, we determine the depth reached by the gaseous phase below the injection point.
2 Experimental observations 2.1 Experimental setup
The experimental setup consists of a Hele-Shaw cell (width 40 cm, height 30 cm, gap 2 mm) filled with grains immersed in water (Fig. 1). Air is injected at the bottom of the cell at constant flow-rate Φ (from 0.17 to 4.3 mL/s) by a mass-flow controller (Bronkhorst, Mass-Stream Series D-5111). The grains are spherical glass
150
250
350
450
0
40
80
Number of particles
(a)
(b)
grain size (µm)
500 µm20
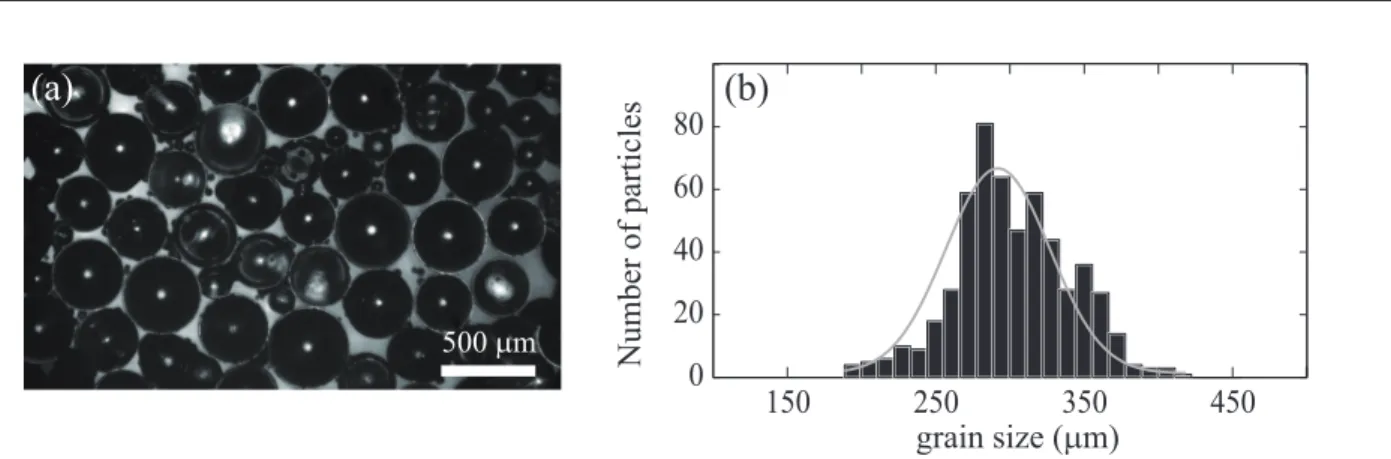
60
Fig. 2 Particle size distribution of the glass beads used in our experiments. (a) Image of the glass beads. (b) Size distribution for the batch d =250–425 µm. The grain size distribution is fitted by a gaussian, giving the average grain size and polydispersity (here, d = 293 ± 50 µm).
beads (USF Matrasur, sodosilicate glass), previously sieved to control their size. Unless specified, the grains diameter d is in the range 250-425 µm. The grain aver-age diameter and size distribution are inferred from di-rect imaging of several samples (about 1000 grains, see Fig. 2). The height of the granular bed is hg = 22 cm,
and the water layer above the initial flat free surface of the grains is hw= 2 cm. Images of the air invasion are
recorded with a webcam (Logitech, QuickCam S7500, 640 × 480 px2), either in real-time (20 images/s) or in
time-lapse (1 image every 15 minutes) to quantify the growth of the fluidized zone. The light source consists of a transparency flat viewer (Just NormLicht, Clas-sic Line) positioned behind the cell. The effective grav-ity in the system can be tuned by tilting the cell with an angle α, geff = g cos α, going from vertical (α = 0,
geff = g, the acceleration due to Earth gravity) to
hori-zontal (α = π/2, geff = 0). For sake of clarity, the angle
α is given in degrees in the following, from α = 0◦
(ver-tical cell) to α = 90◦(horizontal cell).
The initial condition is prepared as follows. First, we pour the grains up to the height hg. We then fill the
entire cell with water, up to the top boundary, and close the upper aperture. Hence we flip the cell bottom-up, which forces most of the small bubbles which may be trapped in the system to separate from the surrounding grains and rise to the surface. While the grains are not fully deposited (very loose packing) and still sediment, we flip the cell back to its original position. All the small bubbles initially trapped in the bulk are therefore ex-tracted from the system. We let the grains deposit gen-tly, then fix precisely the water, hw, and grain height,
hg. This latter is gently levelled with a small paddle.
This prococol ensures a reproducible initial condition (loose packing). Note however that the global packing
is controlled but not the local packing, which will lead to different observed invasion patterns (see section 2.2).
2.2 Air invasion at short times
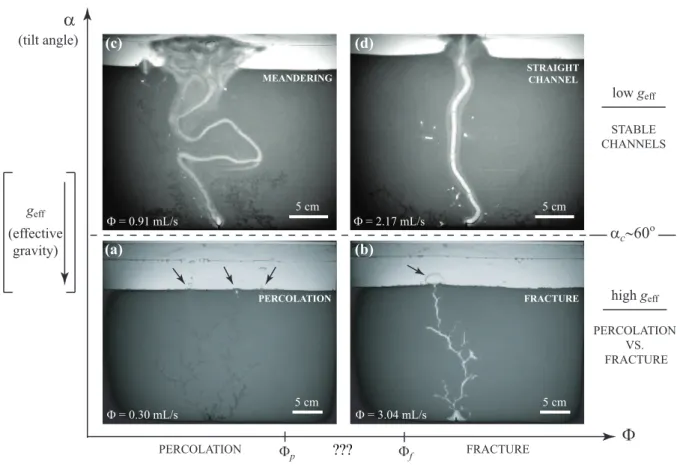
The air invasion at short times displays different pat-terns depending on the injected flow-rate Φ and on the tilt angle α. Figure 3 presents a tentative phase diagram in the Φ–α plane. For high effective gravity (low tilt angle), two patterns are reported. At low flow-rate, the air invades the system without significantly moving the grains (percolation). We observe several branches in the medium and, consequently, simultaneous gas emission loci at the surface. At high flow-rate, the air fractures the system and propagates in the bulk by pushing the grains aside. We still observe branches, but much less numerous than in the percolation process. In this case, the upper branch always reaches first the layer surface, and only a single gas emission point can be observed at a time. After the gas emission, the pressure drops in the fracture and this latter closes. The pressure at the injection point subsequently increases again, until a new fracture is opened in the system.
The transition between the percolation and fracture regime is not sharp. Over a wide range of intermediate flow-rate, it is impossible to predict the air invasion pattern in the system. Indeed, the dynamics depends not only on the flow-rate, but also on the local hetero-geneities (due to polydispersity and compaction), which are not known and not reproducible from one experi-ment to another.
We report the existence of a threshold angle (αc ≃
60◦) above which the air opens a channel through the
granular medium, and the effective gravity is not able to close it anymore. We then observe the formation of channels (Figs. 3c,d) which remain stable over long
Φ
α
αc∼60ο 5 cm 5 cm Φ = 0.91 mL/s (c) (d) Φ = 2.17 mL/s low geff (a) 5 cm 5 cm Φ = 0.30 mL/s Φ = 3.04 mL/s (b) PERCOLATION VS. FRACTURE ??? PERCOLATION (tilt angle) (effective gravity) Φp Φf FRACTURE STABLE CHANNELS geff high geff PERCOLATION FRACTURE MEANDERING STRAIGHT CHANNELFig. 3 Tentative phase diagram in the Φ–α (Φ–geff) plane. (a,b) For high effective gravity (α < 60◦, geff > g/2), the air invades the granular layer at short times with different dynamics. (a) At low flow-rate (Φ < Φp), we always observe percolation. (b) at high flow-rate (Φ > Φf), the air systematically fractures the system. Note that for intermediate flow-rates (Φp< Φ < Φf), it is impossible to predict the initial air invasion morphology (percolation or fracture, see text). Black arrows indicate the gas emission at the surface, at simultaneous locii for percolation while at a single point for fracture. (c,d) For low effective gravity (α ≥ 60◦, geff < g/2), we observe the formation of stable channels. These structures display different morphologies depending on the injection flow-rate, from (c) meandering at low flow-rate to (d) straight channels at high flow rates. At long times, the channels eject the grains from the initial layer and it is not possible to define a fluidized zone anymore.
times (typically, hours). These channels display differ-ent geometries, from tortuous channels at low flow-rate (Fig. 3c) to straight channels at high flow-rate (Fig. 3d). It is interesting to note that these latter patterns were not reported in [23], maybe due to the fact that the flow-rates used in our experiments are much higher than the ones used by these authors. At long times, in the chan-nelling regime the air ejects the grains out of the initial layer, and the central part of the cell contains no grains anymore - only air rising through a water layer. There-fore, this regime has not been studied further, and the following sections only concern the regimes for which α < αc.
2.3 Steady state: morphology of the fluidized zone The repetitive air rises through the system lead to the formation of a fluidized zone. After a time long enough - typically, from one hour up to 20 hours depending
on the imposed flow rate - the fluidized zone reaches a stationary shape. It has been shown in a previous work [24] that, for a vertical Hele-Shaw cell, this shape is parabolic and independent of the injected flow-rate, i.e. of the initial invasion pattern (percolation or fracture). To quantify the morphology of the fluidized zone as a function of the injected flow-rate Φ and the angle α, we considered, for each set of parameters, the steady state for which the contour of the fluidized region does not evolve significantly anymore. For each angle, the total duration of an experiment (at given Φ) is fixed so that the total volume of air injected in the system is the same. The experiment can thus last from several hours to tens of hours, depending on the injection rate. One image every 15 minutes is recorded.
The contour of the fluidized zone is determined as follows. For a given experiment, we compute the differ-ence between successive images, then stack the result-ing sequence (Fig. 4a). The contrast obtained by this
x (cm) z (cm) -15 -10 -5 0 5 10 15 25 20 15 10 5 0 -20 20 30 0 10 20 30 40 50 60 70 0 1 2 3 4 5 6 7 8 9 10 0 0.5 1 1.5 2 2.5 0 2 4 6 8
(a)
(b)
D (cm) α (deg) D (cm) Φ (mL/s)Fig. 4 (a) Example of the final invasion image obtained by superimposing the images sequence [Φ = 0.91 mL/s]. In white are regions where the grains did not move in the layer, while darker gray indicates regions where the grains moved a lot. The contour of the fluidized zone (black lines) is obtained by automatic detection. The detection is limited to z ≤ 16 cm to avoid the deformations due to the free surface. (b) Diffusion coefficient D as a function of the tilt angle α. The points and error bars for a given angle are obtained from the mean and standard deviation of D vs. Φ (e.g. D = 4.5 ± 0.7 cm for α = 0◦, inset). For α > 60◦(gray zone), it is not possible to define a fluidized zone anymore (see text).
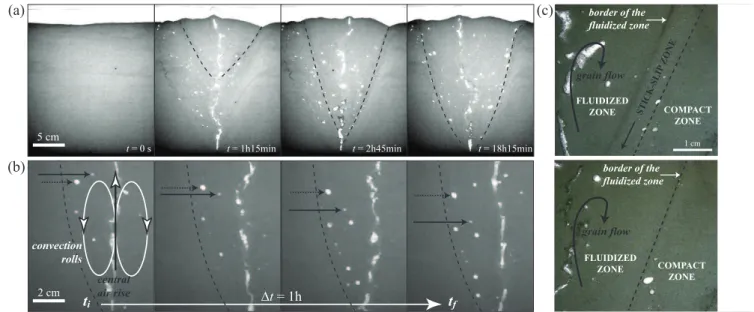
t = 0 s t = 1h15min t = 2h45min t = 18h15min
5 cm 2 cm (a) (b) ti ∆t = 1h tf FLUIDIZED ZONE COMPACT ZONE grain flow border of the fluidized zone grain flow FLUIDIZED ZONE STICK-S LIP ZO NE border of the fluidized zone COMPACT ZONE 1 cm (c) central air rise convection rolls
Fig. 5 (a) The growth of the fluidized zone (dashed lines) starts from the granular bed surface and propagates downwards. (b) Zoom on the fluidized zone (for clarity, its left contour only is represented by the dashed line). The air rising through the grain layer (central arrow) generates two convection rolls (in white). The downward flow velocity decreases close to the fluid zone outer border. The horizontal black arrows follow the position of two bubbles trapped in the fluidized zone for about 1 hour [Φ = 0.91 mL/s, α = 0◦]. (c) Top: The stick-slip zone (SSZ), located between the core of the fluidized zone and the outer compact zone, is characterized by discrete events (see text). Bottom: This zone disappears in stationary regime, when the fluidized zone reaches its final geometry [Φ = 2.17 mL/s].
method is good enough to detect automatically the con-tour of the fluidized region (black line, Fig. 4a). This contour indicates the region at the center where the grains have moved. To avoid any effect of the free sur-face, we limit the detection until about 2-3 cm below the grain surface. As already shown in previous work [24], the fluidized zone exhibits a parabolic shape, x =√Dz, and can be interpreted in terms of a diffusive process,
where D (here, a length) is the analog of a diffusion coefficient, by considering that the vertical axis z plays a role analog of time in a classical diffusion process.
No significant variation of D as a function of Φ is reported, despite the very different patterns of air in-vasion at short times for small (percolation) and large (fracture) Φ (Fig. 4b, inset). For each α, we report in Fig. 4b the mean and standard deviation obtained from
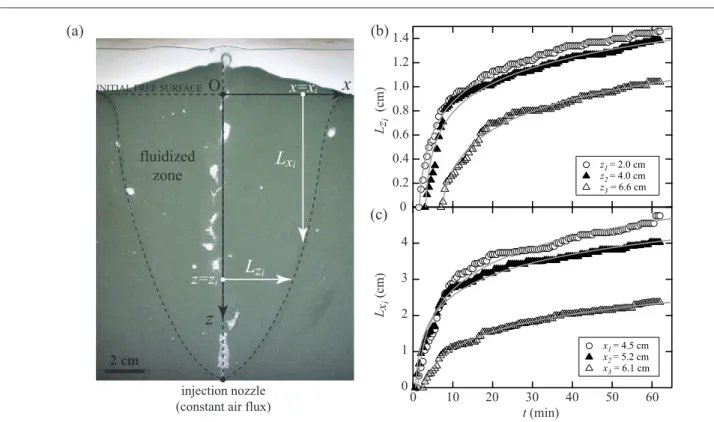
Lz i (cm ) Lx i (cm ) (b) (c) z1 = 2.0 cm z2 = 4.0 cm z3 = 6.6 cm 0 0.2 0.4 0.6 0.8 1.0 1.2 1.4 x1 = 4.5 cm x2 = 5.2 cm x3 = 6.1 cm 0 1 2 3 4 0 10 20 30 40 50 60 t (min) 2 cm (a) fluidized zone
x
z
L
xi x=xiLz
i z=ziO
INITIAL FREE SURFACEinjection nozzle (constant air flux)
Fig. 6 Temporal evolution of the contour of the fluidized zone in the transient state. (a) Example of a fluidized zone in the transient state. Its contour (dashed line) has not reached yet its final position. We consider the evolution of this contour along the horizontal [Lzi], for a fixed vertical position zi, and along the vertical [Lxi], for a fixed xi. The origin of (x − z) axis is
taken at point O. (b) Temporal evolution of Lzi for different vertical positions (z1, z2, z3) below the free surface; (c) Temporal
evolution of Lxi for different horizontal positions (x1, x2, x3) [gray lines: logarithmic fit].
measurements at different injected flow-rates. By tilting the experimental cell, i.e. decreasing the effective grav-ity in the system, we observe a slight decrease of D, which then increases back to a roughly constant value D ∼ 4 cm. This non-trivial evolution cannot be ex-plained by a simple analytical [24] or numerical [25] model based on a rigid grain matrix and considering the different paths explored by the air in the system. Indeed these simple models, which provide an inter-pretation to the parabolic shape of the fluidized zone, predict a continuous increase of D as a function of α (see [24], Fig. 7 or [25], Fig. 8). The grains displace-ment and dynamics, which are not taken into account in these simplified models, play a fundamental role in the fluidized zone formation.
2.4 Transient regime: growth dynamics
We observe that the fluidized zone starts forming from the granular bed surface, where the grains are not con-strained and can rearrange easily. It then progressively widens and grows downwards (Fig. 5a). This downward growth of the fluidized region has been recently pointed out in similar experiments by Kong et al. [31]. Inter-estingly, this geometry and evolution are reminiscent of
the draw bodies observed in the mining industry, which are formed by drawing out fragments from an extrac-tion point at the base of the ore bed [32]. Note that the borders of the fluidized zone are well-defined due to the density contrast between the central fluidized zone (loose packing) and the compact outer zone. The bubbles which get trapped during the experiment in the fluidized zone act as tracers and can be followed in time (Fig. 5b). We thus report that, on both sides of the central air rise, two convection rolls are gener-ated, which entrain the grains upwards close to the cen-ter, and downwards close to the fluidized zone border (Fig. 5b, arrows).
To quantify the growth dynamics of the fluidized zone, we report in Figure 6 the temporal evolution of the distance Lzi [resp. Lxi] between the central axis of
air rising (resp. the free surface) and the outer border of the fluidized zone at time t, for a given height zi(resp. a
given distance xifrom the central axis, see Fig. 6a). The
horizontal position of the front, Lzi, increases rapidly
at short times (t < 10 min) then slows down (Fig. 6b). The data can be fitted by a logarithmic law (gray lines, Fig. 6b). The front propagation along the vertical, Lxi,
the scale on the y-axis) and can also be fitted by a logarithm (gray lines, Fig. 6c).
Finally, it is interesting to note that, in the tran-sient regime, we observe a well-defined region between the fully fluidized zone (grains always in motion) and the compact outer zone. In this transition zone, phe-nomena similar to the well-known stick-slip mechanism occur: the grains move downwards by successive slides (black arrow, Fig. 5c, top). This dynamics can be in-terpreted as a consequence of the shear induced on the fluidized zone border by the downward grain-flow as-sociated with the convection roll in this region. The stick-slip zone (SSZ) evolves in time: its width decreases while the fluidized zone increases, until it disappears completely in the steady regime (Fig. 5c, bottom).
2.5 Conclusion on the experimental part
This section summarized the experimental results, up to date, on the morphology and dynamics of air in-vasion in an immersed granular bed. In the presented configuration, the air invasion is limited by the solid bottom boundary conditions, and the gas cannot prop-agate downwards.
In the following section, we complement the numer-ical results we obtained in our previous works by in-troducing the case of a free bottom boundary condi-tion. In particular, we compare the morphology (width, height, shape) of the invasion zone. These results con-cern the case of a rigid grain matrix, with air percolat-ing through the system.
3 Numerical model 3.1 Description
The procedure to determine the morphology of the in-vasion zone is the same as described in [25]. In a simple approach, we consider that the gas is opening a path in a square matrix of fixed grains. In the above exper-iment, the fluidized zone is created by the successive air bubbles rising through the system. In the numerical model, by analogy, this zone corresponds to the region explored by the successive air paths through the sys-tem. The final morphology of both processes is compa-rable, in the sense that the multiple events of air rising through the system generate either the fluidized zone (experiments) or the region explored by the air (nu-merical model). Although this modeling does not take into account the grains motion in the so-called fluidized zone, it points out the relevant parameters to describe
its morphology, as already shown in previous works [24, 25].
In the model, each saddle point between two vertices (void space between the grains) is associated with a dif-ferent threshold in the capillary overpressure that the gas must overcome to cross from a given vertex to an adjacent one. The threshold distribution thus accounts for the heterogeneity of the system at the grain scale. The typical overpressure is of the order of ∆P ∼ γ/r where γ stands for the gas-liquid surface energy and r = d/2 for the typical radius of the grains. We de-note σP the width of the distribution of the capillary
overpressures in the system.
While air is injected, a new vertex is invaded by the gas when, anywhere along the path, the difference be-tween the (homogeneous) pressure in the gas and the local pressure in the surrounding liquid overcomes the local threshold in the capillary overpressure. Consider-ing that, due to hydrostatics, the pressure in the liquid depends on the depth, one understands that the path grows mainly in a region of typical height h ∼ σP/ρg at
its top. Note that the growth mechanism allows the for-mation of the side-branches as long as h is larger than the typical size of the grains r = d/2. In this context, the parameter
χ ≡ 2σρgdP , (1)
such as h = χr, appears as a natural dimensionless control parameter of the system (see [24] for the full mathematical introduction of the parameter χ). It can be rewritten
χ ∼ ρgd2wγ2 (2)
by denoting w the typical variation of the pore size (typically, a few %) and assuming that their size is ∼ d. Note that this parameter slighly differs from the classi-cal Bond number used to characterize the flow regimes of fluid invasion in saturated porous media under the influence of gravity, B0 = ∆ρgδ2/γ, where ∆ρ is the
difference in density between the resident and invad-ing fluids, and δ the characteristic pore size. The Bond number, indeed, does not account for the grain (or pore) polydispersity, which is included in the parameter χ.
For large values of χ the invaded region widens, thanks to the formation of side-branches, whereas small values of χ are associated with poorly branched, almost vertical paths. While the simplistic model proposed in [24], neglecting the formation of side branches, can be solved analytically, accounting for the formation of side branches brings forward the need for a numerical mod-elling.
To get statistical information on the geometry of the invaded region, we create a large number (2000) of
nu-−400 −200 0 200 400 -300 0 300 -300 0 300 600 −200 0 200 400 z z x x χ = ∞ χ = ∞ χ = 250 χ = 250 nz (z ) 0 20 40 60 0 100 200 0 20 40 nx (x ) 0 100 200 300 0 20 40 0 10 20 nz (z ) nx (x ) ∆z/2 = 62 ∆z/2 = 69 ∆x/2 = 76 ∆x/2 = 67 ∆z/2 = 206 ∆z/2 = 203 ∆x/2 = 56 ∆x/2 = 55 (a) (c) (b) x , z x , z ∆z/2 ∆x/2 ∆x/2 ∆z/2
Fig. 7 (a) Numerical results obtained by superposition of 2000 air paths through the system with (left) and without (right) bottom wall [gray dot = injection point]. The global geometry is not significantly altered by the bottom boundary condition. (b,c) Global intensity profiles along the x-axis, nx(x), and z-axis, nz(z) from the images reported in (a) [solid lines, with bottom wall; dashed lines, without bottom wall]. The dots indicate the value at half height, taken as the typical size of the invasion zone along the x-axis (∆x) and the z-axis (∆z) (see text). For (b) χ = ∞ (no gravity) the difference in ∆x and ∆z between the two boundary conditions is of about 10% whereas for (c) χ = 250 the difference is of the order of 2%.
merical paths for given values of the control parameters. To do so, the pressure thresholds are chosen according to a Gaussian distribution of width σP, the value of χ
is fixed and a number N of individual steps is consid-ered. As N stands for the number of voids between the grains invaded by the gas, N accounts for the amount of gas injected in the system. Indeed, denoting vp the
typical volume associated with the void space between the grains, the total gaseous volume in the system is V ≡ Nvp.
3.2 Influence of the bottom boundary condition First, we compare the morphologies of the invaded re-gions when air is injected at the bottom edge of a gran-ular bed (the gas cannot propagate below the injection point) or in the bulk (the gas can propagate downwards from the injection point). Typical results are reported in Fig. 7. At first sight, the boundary condition does not much change the morphology of the invaded re-gion. However, as already reported in [25], the presence of a rigid bottom wall makes impossible, for instance, a perfectly isotropic invasion of the medium when grav-ity effects are suppressed (χ = ∞, Fig. 7a, top left) whereas the expected isotropy is recovered when the
gas is injected in the bulk (Fig. 7a, top right). A quan-titative characterization of the geometry is obtained by measuring the typical width ∆x and height ∆z of the invaded region. To do so, from the superposition of the 2000 paths (Fig. 7a), we determine the global inten-sity profile along the x-axis, nx(x) (Fig. 7b, bottom),
by stacking all the horizontal profiles over the whole height of the system. We consider the typical size ∆x of the invasion pattern along the x-axis to be the width at half the peak value [25]. In the same way, we con-sider the global intensity profile along the z-axis, nz(z)
(Fig. 7b, top), by stacking all the vertical profiles over the whole width of the system. We observe that from the inlet, the profile is almost flat and suddenly de-creases above a given altitude. In order to compare the two boundary conditions, we define ∆z, the typical size of the invasion pattern along the z-axis, as the altitude, above the injection inlet, of the point corresponding to half the plateau value. The region below the inlet will be discussed later.
The comparison of ∆z and ∆x for both boundary conditions reveals a difference of about 10% for χ = ∞ (no gravity) and of about 2% for χ = 250 (Fig. 7b and c). As expected, for large χ (e.g. small gravity effects) the bottom wall plays a significant role by restricting the air path to the upwards direction. For smaller values
−300 0 0 200 400 600 0 10 50 100 500 1000 2000 3000 4000 6000 8000 10000 0 2 4 6 8 10 0 50 100 150 N 0 2 4 6 8 10 0 100 200 300 400 N
x
z
∆ x ∆ z x103 x103 101 102 103 104 100 101 102 N ∆ x 1/2 (a) (b) (c) 100 101 102 103 χ 101 100 10-1 β 104 α 100 101 102χ103 10 10 10-1 10-2 4 0 -1/2 Nl
f
Fig. 9 (a) Shape of the invaded region for different volumes N [superposition of 2000 paths for each value of N , χ = 500]. The white dot indicates the injection point, and lfdenotes the distance over which the air invades the medium downwards (see text). Note that the invasion for small volumes is almost circular, while it elongates in the vertical direction when N increases. (b) The typical height ∆z of the invaded region is a linear function of the injected volume N , ∆z = αN . Inset: Coefficient α as a function of χ. (c) The typical width ∆x of the invaded region grows as the square root of the injected volume N , ∆x =√βN (inset, up left). (Inset, down right) Coefficient β as a function of χ.
10−2 10−1 100 101 102 103 100 101 102
ρ
=
∆
z
/
∆x
1/2= with bottom wall = without bottom wall
χ /√N
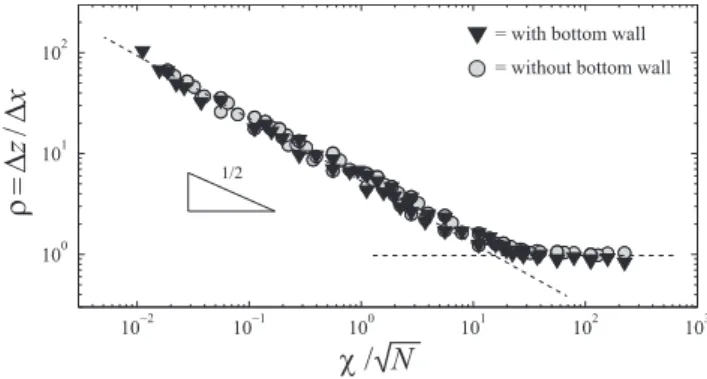
Fig. 8 Aspect ratio ρ = ∆z/∆x of the invasion pattern vs. χ/√N for the two types of bottom boundary conditions, with (black triangles) and without (gray circles) bottom wall. We observe a good collapse of the data in the whole range of parameters. For χ/√N ≤ 10, we find ρ ∝ 1/√χ.
of χ (e.g. larger gravity effects), the structure is more elongated along the vertical, and the role played by the bottom boundary condition is minimized. It is interest-ing to note that even in the case where the bottom wall apparently plays a significant role, the typical size of the invasion pattern in both the horizontal and vertical directions, as defined by our statistical analysis, is not significantly altered.
Figure 8 displays the aspect ratio ̺ = ∆z/∆x of the invasion pattern as a function of χ/√N for the two bot-tom boundary conditions. We observe that both sets of data collapse over almost all the range of χ/√N (We remind here that the typical size of the structure scales like √N ). The bottom boundary condition therefore does not alter significantly the global geometry of the
invasion zone. We find the following scaling law, com-mon to both conditions for χ/√N ≤ 10:
̺ ∝ 1/√χ . (3)
For larger χ/√N , ̺ tends toward an asymptotic value which slightly depends on the bottom boundary condi-tions (̺ = 1 or 0.8 for a free or solid bottom boundary, respectively).
3.3 Growth dynamics
To quantify the growth dynamics of the structure, we display the morphology of the invasion pattern as a function of N , i.e. of the injected volume (Fig. 9). Re-sults obtained with the bottom wall can be found in [25], we only report here the results associated with the injec-tion in an infinite medium (without bottom wall). The typical height of the invasion zone varies linearly with the injected volume, ∆z = αN (Fig. 9b), while its width
scales as the square root of the volume, ∆x = √βN
(Fig. 9c). The variation of coefficients α and β as a function of the dimensionless parameter χ is shown in Fig. 9b and 9c, respectively. For χ < 103, we observe
that α ∝ χ−1/2, while β only displays a slow increase
over the whole range of χ. Note that for smaller gravity effects in the system (χ > 103), the invasion pattern
is almost isotropic and ∆z is no longer linear in the injected volume. The isotropy being recovered, ∆z ex-hibits the same diffusive growth as ∆x and increases like√N .
100 101 102 103 104 0 50 100 150 200 (a) 10−1 100 101 102 103 (b) +1 0 2000 4000 6000 8000 0 0.5 1 1.5 2 2.5 3x 10 4 (c) χ lf / d lf / d 100 101 102 103 β / α 10-1 (lf / d) 2 N χ
PARABOLIC SHAPE ISOTROPIC
χc ~ 500
Fig. 10 (a) Distance lf of downward gas penetration, nor-malized to the grain size d, as a function of χ. Fitting curves, sigmoids, are given as eye leads. The results show a transi-tion at χc ≃ 500. For χ < χc, the volume does not play a role in the downward invasion while for χ > χc, lf/d increases when N increases [for white, light gray, dark gray and black symbols, N = 2000, 4000, 6000 and 8000, respectively]. (b) For χ ≪ χc, lf/d depends linearly on β/α as lf/d = 1.3β/α (solid gray line). (c) (lf/d)2 as a function of N . Lines are guides for the eye [χ = 100, 500, 1.67 × 10³
, 104 ].
3.4 Downward extent of air invasion
Finally, we focus on the morphology of the invasion pat-tern in the vicinity of the injection point. In practical situations, when injecting gas inside a granular matrix (e.g., soils), it is crucial to know the depth reached by the gas below the inlet. To do so, we determine from the invasion pattern the invasion contour. This latter is computed by considering arbitrarily a threshold of the occupation fraction, here f = 1%. In other words, the contour corresponds to vertices in the matrix which are occupied by 2000f points, resulting from the superpo-sition of the 2000 paths in the system. We then extract the distance lfbetween the injection point and the
bot-tommost point of the invasion contour (Fig. 9a). For a given injected volume, lf/d increases as a
func-tion of χ (Fig. 10a) with an inflexion point at about χc = 500. This transition point, of the same order
of magnitude as the one found for the parameter α (Fig. 9), corresponds to the transition between a roughly parabolic shape and a more circular invasion pattern. Note that for large χ, lf/d tends towards a plateau
value, corresponding to the distance reached by an iso-tropic invasion of the gas in the system. For χ ≪ χc,
lf/d does not depend on the injected volume. We find
that lf/d is proportional to the ratio β/α (Fig. 10b)
which makes it possible to predict, from the lateral and
upward extent, the penetration length of the gas below the injection point – not easily accessible in the field. A linear fit gives the empirical relationship lf/d ≃ 1.3β/α.
For χ > χc, lf/d depends on the injected volume. This
dependence is reported in figure 10c, which displays the variations of (lf/d)2 as a function of N . For large
χ (typically, above 10χc) we find lf/d ∝
√
N , as ex-pected for the invasion in an isotropic medium). As χ decreases, the symetry is broken in the system and we observe a departure from the linear tendency displayed in Figure 10c (black dots). Note finally that when χ becomes very small (high effective gravity in the system for example), lftends towards a small value of the order
of a few grain size, which does not increase significantly when N increases.
4 Conclusions
This work presented a brief review on the experimen-tal and numerical study of air invasion in an immersed granular medium. We reported additional experimen-tal results concerning the morphology and the tran-sient growth of the fluidized zone. It was shown that the shape is independent of the air injection flow-rate over a wide range of values, and only slightly depends on the tilt angle (effective gravity in the system). Above a crit-ical value of this angle (α > 60◦), the air opens a stable
channel which ejects the grains from the granular layer, and a fluidized zone cannot be defined anymore. In the transient regime, we pointed out a logarithmic growth of the fluidized zone borders, in both the horizontal and vertical directions. Air rises at the center, while two convection rolls continuously rearrange the grains in the central region. A transition zone between the always-moving core (very loose packing) and the still outer region (compact) displays discrete sliding events (stick-slip zone, or SSZ). The SSZ width decreases with time, until it disappears in the stationary regime, when the fluidized zone has reached its final geometry.
We also reported a complementary numerical study of the geometry and growth dynamics of the region invaded by the gas injected in the bulk. The numeri-cal model considers a rigid porous medium, and does not allow any grain motion. The analog of the fluidized zone corresponds to the region explored by the suc-cessive air paths through the system. This approach, although simplistic, makes it possible to extract the relevant parameters to describe the morphology of the region explored by the air. Contrary to our previous study, the gas is allowed to propagate downwards. The study provides important pieces of information on the depth reached by the injected gas. Depending on a sin-gle parameter χ which compares the gravity to the
capillaty effects, the gas mainly propagates upwards or invades the material almost isotropically. It is found that the downward distance reached by the gas is given by the ratio of two parameters α and β which describe the dynamics of the invasion pattern. In field situations, these parameters as well as the dimensionless number χ can be measured independently, and therefore provide a precise estimate of the depth reached by the gas. The proposed scaling is of practical importance as it makes possible to forecast, for instance, the potential region altered by the rupture of underground gas reservoirs.
References
1. M¨orz, T., Karlik, E.A, Kreiter, S., Kopf, A.: An experi-mental setup for fluid venting in unconsolidated sediments: New insights to fluid mechanics and structures, Sediment. Geol. 196, 251–267 (2007).
2. Naudts, L., Greinert, J., Artemov, Y., Beaubien, S.E., Borowski, C., De Batist, M.: Anomalous sea-floor backscat-ter patbackscat-terns in methane venting areas, Dnepr paleo-delta, NW Black Sea, Mar. Geol. 251, 253–267 (2008).
3. Semer, R., Adams, J.A., Reddy, K.R.: An experimental investigation of air flow patterns in saturated soils during air sparging: Geotech. Geol. Eng. 16, 59–75 (1998). 4. Nermoen, A., Galland, O., Jettestuen, E., Fristad, K.,
Podladchikov, Y., Svensen, H., Malthe-Sørenssen, A.: Ex-perimental and analytic modeling of piercement structures, J. Geophys. Res. 115, B10202 (2010).
5. Walters, A.L., Phillips, J., Brown, R.J., Field, M., Ger-non, T., Stripp G., Sparks R.S.J.: The role of fluidisation in the formation of volcaniclastic kimberlite: Grain size observations and experimental investigation, J. Volcanol. Geotherm. Res. 155, 119–137 (2006).
6. Planke, S., Svensen, H., Hovland, M., Banks, D.A., Jamtveit, B.: Mud and fluid migration in active mud vol-canoes in Azerbaijan, Geo. Mar. Lett. 23, 258–268 (2003). 7. Svensen, H., Jamtveit, B., Planke, S., Chevallier, L.: Struc-ture and evolution of hydrothermal vent complexes in the Karoo basin, South Africa, J. Geol. Soc. 163, 671–682 (2006).
8. Hovland, M., Talbot, M., Qvale, H., Olaussen, S., Aasberg, L.: Methane-related carbonate cements in pockmarks of the North Sea, J. Sediment. Petrol. 88, 881–892 (1987). 9. Wilhelm, T., Wilma´nski, K.: On the onset of flow
insta-bilities in granular media due to porosity inhomogeneities, Int. J. Multiphase Flow 28, 1929–1944 (2002).
10. Rigord, P., Guarino, A., Vidal, V., G´eminard, J.-C.: Lo-calized instability of a granular layer submitted to an as-cending liquid flow, Gran. Matt. 7, 191–197 (2005). 11. Zoueshtiagh, F., Merlen, A.: Effects of a vertically
flow-ing water jet underneath a granular bed, Phys. Rev. E 75, 056313 (2007).
12. Eden, M.: A two-dimensional growth process, 4th Berke-ley Symposium, Univ. California Press, 223–239 (1961). 13. Vold, M.J.: Computer simulation of floc formation in a
colloidal suspension, J. Colloid Sci. 18, 684–695 (1963). 14. Sutherland, D.N.: Comment on Vold’s simulation of floc
formation, J. Colloid Interf. Sci. 22, 300–302 (1966). 15. Witten Jr, T.A., Sander L.M.: Diffusion-Limited
Aggre-gation, a kinetic critical phenomenon, Phys. Rev. Lett. 47, 1400–1403 (1981).
16. Meakin, P.: The Vold-Sutherland and Eden models of cluster formation, J. Colloid Interf. Sci. 96, 415–424 (1983). 17. Mart´ın, H., Vannimenus, J., Nadal, J.P.: From invasion to Eden growth: A family of models for cluster growth in a random environment, Phys. Rev. A 30, 3205–3213 (1984). 18. Chaouche, M., Rakotomalala, N., Salin, D., Xu, B., Yort-sos, Y.C.: Invasion percolation in a hydrostatic or perme-ability gradient: Experiments and simulations, Phys. Rev. E 49, 4133–4139 (1994).
19. Birovljev, A., Furuberg, L., Feder, J., Jøssang, T., M˚aløy, K.J., Aharony, A.: Gravity invasion percolation in two di-mensions: Experiments and simulation, Phys. Rev. Lett. 67, 584–587 (1991).
20. Meakin, P., Feder, J., Frette, V., Jøssang, T.: Invasion percolation in a destabilizing gradient, Phys. Rev. A 46, 3357–3368 (1992).
21. Bo, Z., Loggia, D., Xiaorong, L., Vasseur, G., Ping, H.: Numerical studies of gravity destabilized percolation in 2D porous media, Eur. Phys. J. B. 50, 631–637 (2006). 22. Chevalier, C., Lindner, A., Leroux, M., Cl´ement, E.:
Mor-phodynamics during air injection into a confined granular suspension, J. Non-Newton. Fluid Mech. 158, 63–72 (2009). 23. Sandnes, B., Flekkøy, E.G., Knudsen, H.A., M˚aløy, K.J., See, H.: Patterns and flow in frictional fluid dynamics, Na-ture Commun. 2, 288–296 (2011).
24. Varas, G., Vidal, V., G´eminard, J.-C.: Venting dynamics of an immersed granular layer, Phys. Rev. E 83, 011302 (2011).
25. Varas, G., Vidal, V., G´eminard, J.-C.: Morphology of air invasion in an immersed granular layer, Phys. Rev. E 83, 061302 (2011).
26. Lake, W.L.: Enhanced Oil Recovery, Prentice Hall (1989). 27. Eccles, J.K., Pratson, L., Newell, R.G., Jackson, R.B.: Physical and economic potential of geological CO2 stor-age in saline aquifers, Environ. Sci. Technol. 43, 1962–1969 (2009).
28. Romanov, V.N., Ackman, T.E., Soong, Y., Kleinman, R.L.: CO2storage in shallow underground and surface coal mines: challenges and opportunities, Environ. Sci. Technol. 43, 561–564 (2009).
29. Kang, Q., Tsimpanogiannis, I.N., Zhang, D., Lichtner, P.C.: Numerical modeling of pore-scale phenomena dur-ing CO2 sequestration in oceanic sediments, Fuel Process. Technol. 86, 1647–1665 (2005).
30. Svensen, H., Planke, S., Malthe-Sørenssen, A., Jamtveit, B., Myklebust, R., Eldem, T.R., Rey, S.: Release of methane from a volcanic basin as a mechanism for initial Eocene global warming, Nature 429, 542–545 (2004).
31. Kong, X.-Z., Kinzelbach, W., Stauffer, F.: Morphody-namics during air injection into water-saturated mov-able spherical granulates, Chem. Eng. Sci. 65, 4652–46660 (2010).
32. Melo, F., Vivanco, F., Fuentes, C., Apablaza, V.: On drawbody shapes: From BergmarkRoos to kinematic mod-els, Int. J. Rock Mech. Mining Sci. 44, 77–86 (2007).
![Fig. 7 (a) Numerical results obtained by superposition of 2000 air paths through the system with (left) and without (right) bottom wall [gray dot = injection point]](https://thumb-eu.123doks.com/thumbv2/123doknet/14650535.737224/9.892.104.751.120.502/numerical-results-obtained-superposition-paths-right-injection-point.webp)