Ciliate Micrograzer Dynamics of the New England Shelf
byEmily Fay Brownlee
B.A., Hood College, 2010Submitted in partial fulfillment of the requirements for the degree of Doctor of Philosophy
at the
MASSACHUSETTS INSTITUTE OF TECHNOLOGY and the
WOODS HOLE OCEANOGRAPHIC INSTITUTION June 2017
c 2017 Emily F. Brownlee. All rights reserved.
The author hereby grants to MIT and WHOI permission to reproduce and to distribute publicly paper and electronic copies of this thesis document in whole or in
part in any medium now known or hereafter created.
Signature of Author . . . . Joint Program in Oceanography / Applied Ocean Science and Engineering
Massachusetts Institute of Technology and Woods Hole Oceanographic Institution March 24, 2017
Certified by. . . . Dr. Heidi M. Sosik Senior Scientist, Woods Hole Oceanographic Institution Thesis Supervisor
Ciliate Micrograzer Dynamics of the New England Shelf by Emily Fay Brownlee
Submitted to the MIT/WHOI Joint Program in Oceanography/Applied Ocean Science and Engineering on March 24, 2017 in partial fulfillment of the requirements for the degree of Doctor of Philosophy in Biological Oceanography
Abstract
Protists play important roles in grazing and nutrient recycling, but quantifying these roles has been hindered by difficulties in collecting, culturing, and observing these often-delicate cells. During long-term deployments at the Martha’s Vineyard Coastal Observatory (MVCO) (Massachusetts, USA), Imaging FlowCytobot (IFCB) made it possible to study live cells in situ without the need to culture or preserve. IFCB records images of cells with chlorophyll fluorescence above a trigger threshold, so taxonomically resolved analysis of protists is lim-ited to mixotrophs and herbivores, which have eaten recently. To overcome this limitation, I coupled a broad-application ‘live cell’ fluorescent stain with a modified IFCB so that pro-tists which do not contain chlorophyll (such as consumers of unpigmented bacteria and other heterotrophs) can also be recorded. Staining IFCB (IFCB-S) revealed higher abundances of grazers than the original IFCB, as well as some cell types not previously detected. To analyze a 10-year time series of herbivorous ciliates at MVCO and address broad patterns of seasonality of major ciliate classes and their components, I employed a statistical model that estimates a seasonal density pattern and simultaneously accounts for and separates any annual-scale effects. I describe the seasonality of three functional groups: a phototrophic ciliate, a mixotroph, and a group of strict heterotrophs, and comment on potential drivers of these patterns. DNA sequencing has also contributed to the study of protist communities, providing new insight into diversity, predator-prey interactions, and discrepancies between morphologically defined species and genotype. To explore how well IFCB images can be used to detect seasonal community change of the class Spirotrichea, an important and numer-ous group, I used high-throughput sequencing (HTS), which does not discriminate between chlorophyll-containing cells and the rest of the community. I report on species and genera of ciliates for which morphotype and genotype displayed high congruency. In comparing how well temporal aspects of genotypes and morphotypes correspond, I found that HTS was critical to detect and identify certain ciliates occupying a niche associated with warmer temperatures. I further showed that when these types of analyses are combined with IFCB results, they can provide hypotheses about food preferences.
Acknowledgments
This research was supported in part by NSF (grants OCE-1130140, OCE-1434440), NASA (grants NNX11AF07G and NNX13AC98G), the Gordon and Betty Moore Foundation (grants 934 and 2649), the Woods Hole Oceanographic Institution’s Innovative Technology Program, student awards from the WHOI Ocean Ventures Fund and Hill Foundation Fund.
These last six and a half years have been full of scientific and self-discovery. I could not have pursued this adventure without a village of support. I’d like to thank all of these people. To my advisor, Heidi, your guidance, patience, and belief in me is something I will always cherish and never forget. Apart from being an amazing advisor in a academic way (opening my eyes to diverse questions, guiding my writing, etc.), you also helped me with many life obstacles and stimulated me during my difficult moments. I am forever grateful I had you as role model throughout these years and for that I am a better scientist.
To Rob, thank you for taking a student who didn’t even know how to use a drill under your wing. You taught me how to think about a problem and logically work out the steps to fix it. There was never an issue too large to handle and you were always there to tell me it was ok to spill water, as long as it was fresh.
To Becky, thank you for teaching me the ways of genetics and trusting me not to contami-nate the stocks. Our conversations about the data and working together to figure out new types of analyses were invaluable.
Matt, I am so grateful for the discussions we had about ciliates and the lessons on picking cells. Thank you for showing me what a live Laboea strobila looks like and helping to con-tribute invaluable data to my thesis about Mesodinium spp.
Susanne, thank you for your insights and comments about my data. Your thoughts have given a new perspective for publication and discussion.
Penny, thank you for your interesting comments and views. Your advice about observational ecology helped to boost my confidence and direct my thoughts.
To Alexi, once again, no problem was ever too large for you to tackle. You were always there for both logistical help and insightful discussion. I am so grateful for all of the amazing work you do on the instruments.
To past and current members of the Sosik Lab: Kristen, thank you for all of the ‘check-ins’ we had together. I would not have had such an enriching experience without your support, advice, and friendship. To Emily and Taylor, the lab cannot run without you as such I would not have been able to do my work without you. You both were there for great con-versation, help with data and instrumentation, and tons of support. Joe, without you, we simply could not use our own data with the ease we have now. I will always cherish what you have brought to this lab and my experience with data management.
To the captains and crews of the R/V Tioga and the various NOAA ships that hosted IFCB-14 and me, thank you for all of your hard work helping scientists reach their study sites with ease and making sure the science goes smoothly. Also to the MVCO Operations Team as our research endeavors at the tower would not be possible without you.
To my cohort, Katie, Harriet, Jeanette, Esther, Nicholas, Oscar, and Ellie, we started as a large class and finished together as a large class. From working on P-sets to dressing up on Halloween, our experiences have shaped my journey in more ways than I can describe. To those in WHOI security and those working on the WHOI dock, in particular Norman and Linda, thank you for always having a smiling face during those late nights and long weekends on the dock. I always looked forward to coming in because I knew you would be there.
To the staff of Coffee O, thank you providing me with caffeine and fueling my work. Members of APO, especially Julia, Meg, and Lea. We students cannot get through this program without the advice and support you provide.
To IFCB-14, its been a long ride my friend, keep enjoying your days at the dock and don’t be too hard on Emily and Taylor. I look forward to hearing more about your adventures at sea. To Rachel, your listening and advice were particularly valuable during some of the toughest times.
To my friends back home, in particular my Wifeys, Sammy, Alanna, Britt, and Ho-Ching. You guys keep me grounded and feeling loved. No matter how far apart, our friendship will always keep us together. Zach, thank you for the visits and the calls. You are my oldest friend and were always a listening ear when I needed it.
To Tony, my super awesome brother-in-law. You have been such a great source of humor, support, and family.
Dad and Melanie, your advice, kind words, and never-ending love are the kinds of things a grad student needs to do what they do. Dad, you taught me how to be a decent person, voice my thoughts, and appreciate the natural world. I will be forever thanking you for all that you have done and continue to do. I would not be here without you.
with some of the greatest conversations about science, about life, and about how to properly clean things like a test tube or a kitchen sink. From a young age, you immersed me in the magic of science and I could not have done this without you.
Sarah, you are the best sister one could ask for. From sending me flowers around deadlines, listening to every idea in my head no matter how crazy, to making sure I never felt down, I could not have imagined tackling such a journey without you. We may be far apart, but you never let it feel that way. You have moved mountains to make sure that I got through this adventure and I can only dream to one day do as half as much as you have done for me. To my animals, Maddie, Jaffe, and Banjo, you kept me grounded and your cuddles were more than I could have ever asked for.
And last but not least, my husband, Mark, we started this journey together on a ferry to the Vineyard. You asked me what I wanted in life and I said ‘a Ph.D.’. You never let me forget that no matter how tough it got. You kept me fed, drove me to my instrument on the dock at midnight during a blizzard, and filled my life with art. It has been a long journey, but you never faltered and never stopped being there when I needed it. You have been the best companion, the best friend, and the best husband. You walked out on a limb with me six and a half years ago and for that I will be forever grateful.
Contents
1 Introduction 17
1.0.1 Evolution of methods to observe ciliates . . . 18
1.0.2 Time series . . . 21
1.0.3 Modern advancements in ciliate methods . . . 22
2 Microzooplankton community structure investigated with imaging flow cytometry and automated live-cell staining 25 2.1 Abstract . . . 25
2.2 Introduction . . . 26
2.3 Materials and Methods . . . 28
2.3.1 Instrument design . . . 28
2.3.2 Staining validation . . . 29
2.3.3 IFCB-S stain protocol . . . 29
2.3.4 Stain comparison . . . 29
2.3.5 Comparison with conventional microscopy . . . 30
2.3.6 Comparison of detection between IFCB and IFCB-S . . . 30
2.3.7 Automated classification of a time series . . . 31
2.4 Results . . . 32
2.4.7 Automated classification . . . 35
2.5 Discussion . . . 36
3 Seasonal dynamics of herbivorous ciliates from a 10-year time series 57 3.1 Introduction . . . 57
3.2 Materials and Methods . . . 60
3.2.1 Observations and study site . . . 60
3.2.2 Manual image classification . . . 62
3.2.3 Automated image classification . . . 62
3.2.4 Data analysis . . . 64
3.2.5 Time series model . . . 64
3.3 Results . . . 67
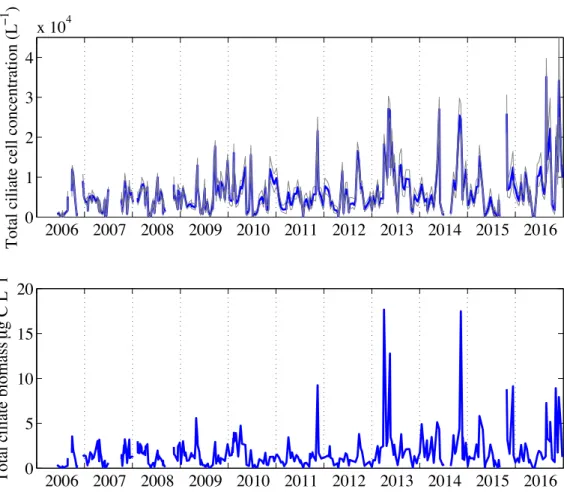
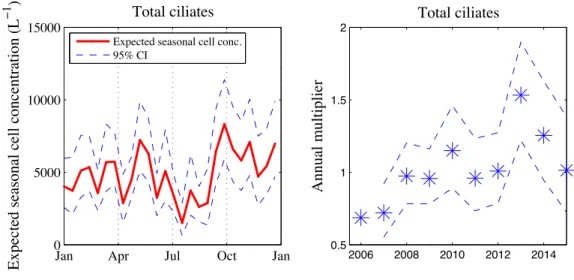
3.3.1 Total ciliate concentration and biomass . . . 67
3.3.2 Ciliate class seasonality . . . 67
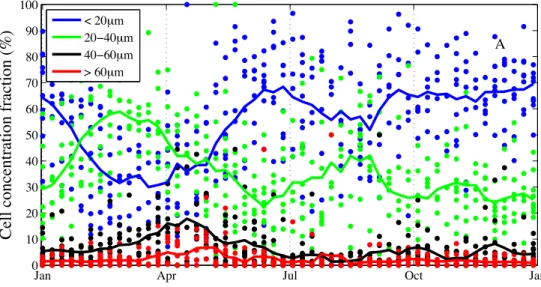
3.3.3 Ciliate size classes . . . 68
3.3.4 Dominant known oligotrich: Laboea strobila . . . 68
3.3.5 Dominant known choreotrichs: tintinnids . . . 69
3.3.6 Dominant haptorid: Mesodinium spp. . . 70
3.3.7 Environmental and prey conditions . . . 71
3.4 Discussion . . . 71
3.4.1 Herbivorous ciliate structure . . . 71
3.4.2 Laboea strobila . . . 73
3.4.3 Tintinnid . . . 75
3.4.4 Mesodinium spp. . . 76
3.4.5 Conclusions . . . 79
4 Seasonality in ciliate communities characterized by morphotype and geno-type 113 4.1 Introduction . . . 113
4.2 Materials and Methods . . . 115
4.2.1 Sample collection . . . 115
4.2.4 DNA amplification . . . 117
4.2.5 Data preparation . . . 118
4.2.6 Multivariate analyses . . . 118
4.2.7 Mesodinium spp. amplification and sequencing . . . 120
4.3 Results . . . 120
4.3.1 Spirotrich composition . . . 120
4.3.2 Spirotrich relationship with temperature . . . 121
4.3.3 Genotype and morphotype comparisons . . . 123
4.3.4 Mesodinium spp. subclades . . . 124
4.4 Discussion . . . 125
4.4.1 Beta diversity between temperature regimes . . . 126
4.4.2 Genotype and morphotype comparisons . . . 127
4.4.3 Mesodinium spp. genetic and morphological variations . . . 130
4.4.4 Conclusions . . . 131
5 Conclusions and future directions 151 5.1 Thesis summary . . . 151
5.2 Conclusions and future directions . . . 155
A Appendix 157 A.1 Appendix for Chapter 3 . . . 158
List of Figures
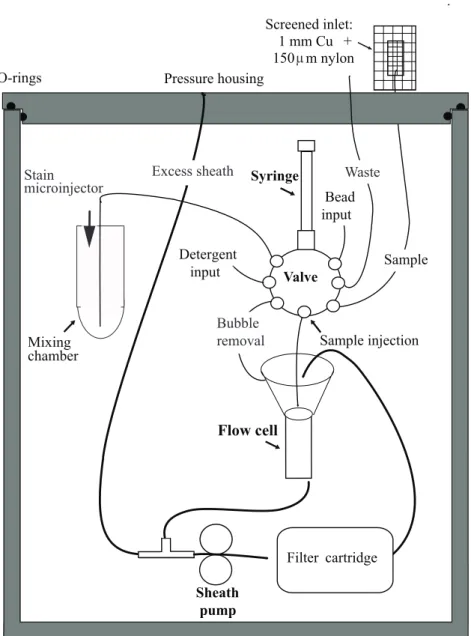
2-1 Schema of fluidics for IFCB-S . . . 44
2-2 Schema of optical layouts for IFCB-S . . . 45
2-3 Example images of ciliates with IFCB . . . 46
2-4 Example images of heterotrophic dinoflagellates with IFCB . . . 47
2-5 FDA staining validation . . . 48
2-6 Comparison between FDA and LTG . . . 49
2-7 Stain protocol testing . . . 50
2-8 Seasonal comparisons between manual microscopy and IFCB-S . . . 51
2-9 OKEX cruise comparison between staining and non-staining on IFCB-S . . . 52
2-10 Tintinnid abundances observed on OKEX cruise between IFCB-S and a stan-dard IFCB . . . 53
2-11 Indicators for optimal threshold use in automated classification for Laboea strobila . . . 54
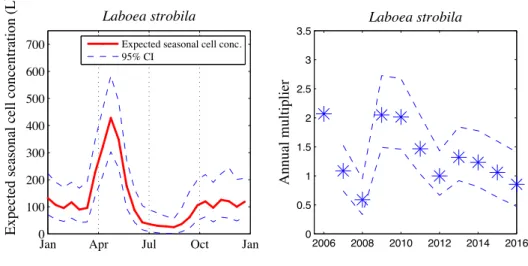
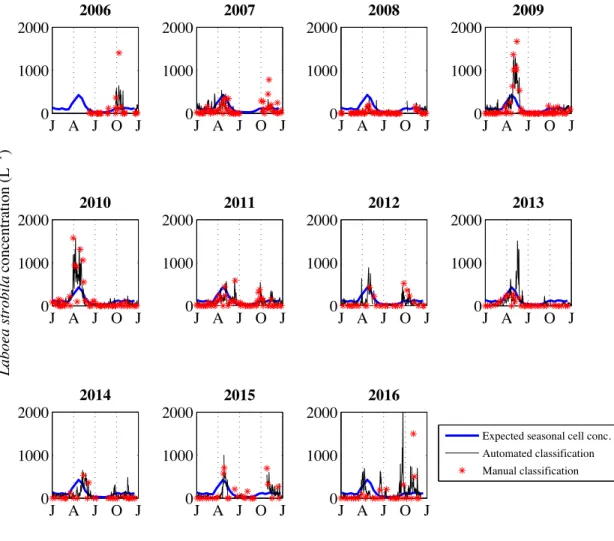
2-12 Comparison between automated and manual classification for Laboea strobila 55 2-13 Multiyear records of Laboea strobila concentrations . . . 56
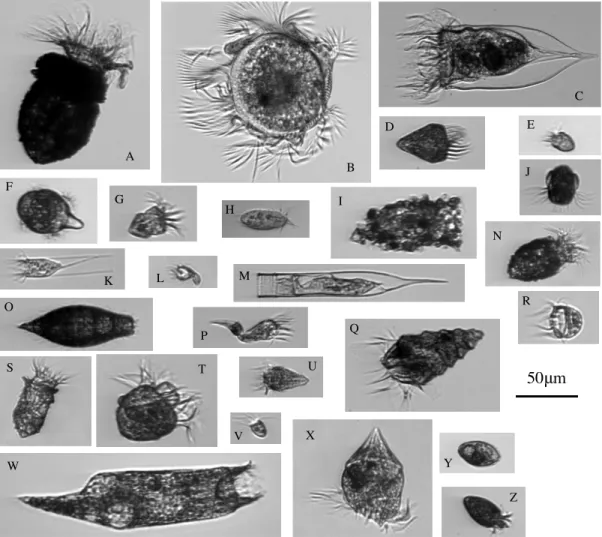
3-1 Example images of all ciliate categories . . . 82
3-2 Total ciliate abundance and biomass . . . 83
3-9 Comparison between automated and manual classification for Laboea strobila 90
3-10 Laboea strobila expected seasonal cell concentration and annual multipliers . . 91
3-11 Laboea strobila concentration by year . . . 92
3-12 Comparison between automated and manual classification for total Tintinnids 93 3-13 Total tintinnid expected seasonal cell concentration and annual multipliers . . 94
3-14 Total tintinnid concentration by year . . . 95
3-15 Tintinnid group expected seasonal cell concentration . . . 96
3-16 Multiyear records of tintinnid group concentrations . . . 97
3-17 Comparison between automated and manual classification for Mesodinium spp. 98 3-18 Mesodinium spp. expected seasonal cell concentration and annual multipliers 99 3-19 Total Mesodinium spp. concentration by year . . . 100
3-20 Time series of Mesodinium spp. cell sizes . . . 101
3-21 Mesodinium spp. size class expected seasonal cell concentration and annual multipliers . . . 102
3-22 Mesodinium spp. daily size mode versus temperature . . . 103
3-23 Mean seasonal pattern of temperature and daily solar radiation . . . 104
3-24 Plankton group expected seasonal cell concentrations . . . 105
3-25 Springtime Laboea strobila and 2-10 µm eukaryote cell concentrations . . . 107
3-26 Relationship between total tintinnid concentration and picophytoplankton concentration . . . 108
3-27 Relationship between total tintinnid concentration and 2-10 µm eukaryotic phytoplankton concentration . . . 109
3-28 Proportion of large Mesodinium spp. (>20µm) in response to nitrate and nitrite concentrations (µM) . . . 110
3-29 Proportion of large Mesodinium spp. (>20µm) in response to the temperature cycle . . . 111
3-30 Mean seasonal pattern of water temperature and Mesodinium spp. size class contribution to total abundance. . . 112
4-1 Example images of Spirotrich ciliates . . . 134
4-2 Tintinnopsis size class example images . . . 135
4-4 NMDS of ciliate OTUs based on Bray-Curtis similarity matrices . . . 137
4-5 NMDS of ciliate cell concentrations based on Bray-Curtis similarity matrices . 138 4-6 Total NOTU of tintinnid genera observed by both HTS and image-based mor-phology . . . 139
4-7 Time series comparing CIFCB and NOTU of tintinnid genera . . . 140
4-8 Time series of NOTUfor tintinnid genera not resolved in IFCB sampling . . . 141
4-9 Time series comparing NOTUand CIFCB for the genus Eutintinnus . . . 142
4-10 Time series comparing CIFCBand NOTUof commonly defined species detected by both HTS and image-based morphology . . . 143
4-11 Time series comparing CIFCBand NOTUof Tintinnopsis species detected from HTS and Tintinnopsis size classes from image-based morphology . . . 144
4-12 Mesodinium spp. subclade relationship to size and water temperature . . . . 145
A-1 Indicators for optimal threshold use in automated image classification for total tintinnids . . . 159
A-2 Indicators for optimal threshold use in automated image classification for Mesodinium spp. . . 160
A-3 Two-week resolved Laboea strobila anomalies by year . . . 162
A-4 Two-week resolved total tintinnid anomalies by year . . . 163
A-5 Two-week resolved Mesodinium spp. anomalies by year . . . 164
A-6 Weekly resolved temperature anomalies by year . . . 165
A-7 Zoomed in NMDS of ciliate cell concentrations based on Bray-Curtis similarity matrices . . . 167
List of Tables
3.1 Biomass and abundance ranges and average temperature for ciliate groups . . 106
4.1 List of ciliates identified from IFCB images in the subclasses Oligotrichia and Choreotrichia . . . 146
4.2 ANOSIM results for HTS and image-based morphology . . . 147
4.3 SIMPER results for HTS . . . 148
Chapter 1
Introduction
In marine ecosystems, the flow of energy is a complex and integral part of aquatic life. The classic marine food chain describes the flow of carbon as a linear system, transferring directly from smaller to larger organisms through consumption. In contrast, the microbial loop represents a more circuitous path, in which dissolved organic matter (DOM) is a major energy source moving through multiple trophic levels. DOM, which originates from a large pool of organisms from many trophic levels is consumed by heterotrophic bacteria. This DOM is transformed into bacterial biomass, then consumed by heterotrophic protists, which then continue contributing to the original pool of DOM. The heterotrophic protists also participate in the traditional marine food web when zooplankton graze upon them.
A major component of both pathways are ciliate micrograzers. Belonging to the micro-zooplankton, ciliates are protists between 20 and 200 µm in size with organelles called cilia, used for feeding, small scale locomotion, attachment, and sensory processes. This important group of protists are common in both freshwater and marine ecosystems. When ciliates first made their way onto the aquatic research stage, taxonomy was most emphasized, and their ecological importance was not heavily studied. Eventually, when Pomeroy (1974) and Azam et al. (1983) challenged the typical view of the marine food web and described the
Ciliates exhibit a wide variety of functionalities ranging from strict heterotrophs to es-sentially phototrophs with an array in between. This complexity is extended because various functional types can occur within the same size class and confound the use of size as proxy for function. On one end of the spectrum, strictly heterotrophic ciliates receive their nutrition solely through phagotrophy on a wide variety of prey: autotrophs, bacteria, and even other ciliates (Dolan, 1991a). Heterotrophy can also be combined with photosynthetic capabilities when food conditions are poor, a functional mode called mixotrophy. These ciliates ingest algal cells and retain functional chloroplasts for photosynthesis (Stoecker et al., 1987, 1988, 1989a). The mixotrophic middle ground represents a flexible means for acquiring energy in which many ciliates exhibit. This has major implications for food webs as mixotrophs contribute to both secondary and primary production. Mixotrophs can represent a com-petitive advantage over heterotrophs in oligotrophic environments. This functional group may also be responsible for decreasing the number of trophic transfers in planktonic food chains especially if they are large-celled taxa (i.e. Laboea strobila) (Blackbourn et al., 1973; McManus & Fuhrman, 1986). On the opposite end of the spectrum, the ciliate, Mesodinium spp. is essentially a phototroph that only acquires its energy through photosynthesis by sequestering chloroplasts and retaining transcriptively active nuclei from cryptophyte prey (Gustafson et al., 2000; Johnson et al., 2007). In high enough numbers, Mesodinium spp. can cause red tides and be a dominant source of chlorophyll (McAlice, 1968; White et al., 1977; Lindholm, 1978; Smith & Barber, 1979). Understanding these functional groups is important for study of the traditional food web and microbial loop.
1.0.1 Evolution of methods to observe ciliates
The historical perspective on ciliate studies provides insight into the evolution of modern techniques. Dolan et al. (2012) provides an excellent history of ciliate studies with particular emphasis on tintinnids, and references pertaining to ciliate history up until the late 20th century can be found therein. In the 18th and early 19th centuries, taxonomy of ciliates was most heavily explored, but once ciliates were maintained in culture, initial observations of life history and feeding were advanced (Faure-Fremiet 1908 provided the first detailed report of a tintinnid in culture). Culturing, though, is notoriously difficult as ciliates have complex needs and often prove challenging to isolate and maintain (Gifford, 1985).
a previously unexplored new environment for planktonic ciliates. Though their importance at the base of the food chain was suggested, it was not until the late 20th century that focus turned toward ecological studies and the role ciliates play in marine food webs. Issues arose, however, because net sampling typically used to study zooplankton missed the micro-zooplankton community (Banse, 1962). Eventually field studies along the California coast, with size-fractionated sampling, provided quantitative evidence of the importance of micro-zooplankton to total plankton biomass (Beers & Stewart, 1967, 1969), though even these observations suffer from limitations. While-size fractionated counts can provide insight into the contributions of size classes to overall biomass, they can underestimate the importance of microzooplankton to the grazing community (especially aloricate ciliates). For example, Smetacek (1981) observed that tintinnids only dominated when samples were concentrated with 20 µm gauze, indicating that aloricated ciliates were slipping through the mesh.
Since the 1960’s, preferred sampling changed to analyzing whole water samples, but still the conventional approaches of staining and preservation added more complexities to quantifying ciliates. While Lugol’s iodine is useful for long-term preservation and counting and allowed researchers to estimate the numerical contribution of ciliates, it can distort and damage cells. This may lead to underestimation of abundance and biomass and interfere with taxonomic identification (Stoecker et al., 1994). Lugol’s iodine can also make it difficult to detect chlorophyll fluorescence, thus not allowing for identification of herbivorous or mixotrophic ciliates separate from carnivorous or bacterivorous ones. Even glutaraldehyde and formalin, which allow for the identification of chlorophyll fluorescence, caused shrinkage and swelling of ciliate cells (Wiackowski et al., 1994).
Once the importance of ciliates in the microbial loop was established, intricate studies on grazing and growth were more heavily emphasized than those quantifying and identifying ciliates. Advanced methods were developed to provide perspective on protistan grazing rates and trophic interactions through observations of natural populations, tracer techniques, and
also used to estimate ingestion by phagotrophic ciliates (Bernard & Rassoulzadegan, 1990; Dolan & Coats, 1991). This method only works if there can be an accurate assessment of average number of prey consumed by each predator (i.e., no loss of vacuole contents through preservation) (Sieracki et al., 1987) and if the rate of prey digestion can be determined experimentally (Sherr et al., 1988; Bernard & Rassoulzadegan, 1990; Dolan & Coats, 1991). Though they present certain limitations, these in situ experiments provided much insight into the potential effects microzooplankton grazing can have on the phytoplankton and bacterial communities.
Radioisotope labeling of potential prey allowed for sensitive detection of significant graz-ing by microzooplankton (Lessard & Swift, 1985). Uptake of tracers specific to different prey could be measured in predator communities. Though this is a powerful technique for studying differential grazing, limitations in the form of tracer cycling throughout the predator and prey communities complicates interpretations (Caron et al., 1993). With the use of fluorescently labeled prey (FLP), Sherr & Sherr (1987) proved previous studies were underestimating the rates of bacterivory by pelagic ciliates by 10-100 times. The advan-tages of using the FLP technique were widespread and allowed for visual confirmation of phagotrophic activity by a wide variety of microzooplankton types (Sanders et al., 1989), confirmation of size-dependency of prey selection (Gonzalez et al., 1990), and evidence of mixotrophy (Porter, 1988).
One of the most important techniques for studying community impacts of grazing is dilution studies (Landry & Hassett, 1982). This technique allowed researchers to measure growth and mortality rates of photoautotrophic populations through a series of incubated diluted seawater samples. While these dilution studies remain an important approach, bottle effects and other growth uncertainties associated with dilution can occur as the studies are not in situ (Dolan et al., 2000; Calbet & Landry, 2004; Calbet et al., 2011; Calbet & Saiz, 2013). Inherent problems also arise with studying cultures, as organisms may behave differently when not in situ. Landry (1994) suggested ‘hybrid’ techniques, which combine many of these historical methods, are needed to overcome some of the inherent limitations and to control for critical assumptions.
1.0.2 Time series
Ciliates, due to their fast generation times, can be tightly coupled with the dynamics of their prey and graze as quickly as their prey grow (hours to days) (Sherr & Sherr, 1994; Strom et al., 2007). Evans and Parslow (1985), used a nutrient-phytoplankton-zooplankton (NPZ) model to show that protist grazing (when coupled with phytoplankton growth) could be powerful enough to suppress the spring bloom. Similarly, Behrenfeld (2010) suggested interruptions in grazing pressure could initiate the North Atlantic spring bloom. Not only is grazing on phytoplankton important, but ciliates are also known to graze on smaller heterotrophs, such as nanoflagellates and bacteria. Ciliates can also exhibit mixotrophy and at times can contribute significant amounts to total primary production (Smith & Barber, 1979; Putt, 1990a; Stoecker & Michaels, 1991; Sanders, 1995). Their ability to be either heterotrophic or mixotrophic allows for an interesting system to be studied in response to environmental conditions as well as biological ones. As ciliates can fill different niches and contribute to both the classic food web and the microbial loop, the ability to study these organisms quantitatively in nature over time is imperative.
As the transfer of carbon may be affected by warming climates, the study of this key trophic level in changing environments is essential. Time series are powerful ways to un-derstand these effects. Time series, while increasing in number, have just recently been emphasized. They serve as an essential baseline to compare the effects of a changing cli-mate. But, for time series, there are typically tradeoffs between resolution and length of sampling.
Limited sampling resolution can present many challenges for studying plankton popula-tions because these communities have been observed to fluctuate rapidly. Pierce & Turner (1994) found high fluctuations in tintinnid abundance in Buzzards Bay, MA both spatially and temporally; communities could change an order of magnitude between stations (a few kilometers) and over 2-week periods. Ciliates, with their short generation times, are quick
where large fluctuations of abundance suggested that substantial patchiness is superimposed on seasonal signals. Furthermore, many time series have had to be pieced together with dif-ferent methodologies (Moe et al., 2008; Olli et al., 2013), which can introduce inconsistencies in the data synthesis and interpretation.
1.0.3 Modern advancements in ciliate methods
Recent advances in DNA-based assessments now make it possible to study which ciliates are present in the environment with taxonomic detail. With the introduction of high throughput sequencing, we can study ciliate genetic diversity and dynamics in natural communities. Ciliates are unique in that they exhibit nuclear dualism, containing a macronucleus and micronucleus. This allows for an abundance of nuclear material to be sequenced and studied. Ciliates are also one of the most diverse protist clades in aquatic ecoysystems (de Vargas et al., 2015; Hu et al., 2016), making them an important target for understanding community dynamics and ecosystem functioning. Recently, Gimmler et al. (2016), during the Tara Oceans voyage, documented large diversity of ciliates in the world’s oceans. Notably, more than half of the ciliate OTUs documented shared less than 90% sequence similarity to reference sequences, indicating a vast amount of unknown diversity. Similarly, Agatha (2011) suggested that more than 83-89% of the morphospecies of aloricate Oligotrichia (a dominant planktonic ciliate group) are unknown. It is therefore important to combine information about genetic and morphological diversity to investigate these uncertainties. This is further supported by Katz et al. (2005) who reported high levels of cryptic diversity in certain species, but low genetic diversity in other morphospecies (i.e., Laboea strobila).
Ciliates provide a unique opportunity for studying genetic versus morphological patterns, though to date this has only rarely been attempted and never done for extended (multi-year) time series. Tintinnids, in particular, because of their distinct, but diverse morphology, are a model group for these ‘hybrid’ studies (Santoferrara et al., 2012, 2016). Mesodinium spp., the autotrophic ciliate, presents cryptic diversity (Garcia-Cuetos et al., 2012a; Johnson et al., 2016) through a species complex of 8 different subclades, but contrastingly also presents various morphologies.
In addition to sequencing approaches, other recent advances make this an opportune time to undertake such studies.The Imaging FlowCytobot, developed at the Woods Hole
Oceano-in situ without the need to culture or preserve. It can also sample with high temporal resolution, as well as over a long period of time. The goal of my thesis is to observe cili-ate communities over time through automcili-ated imaging and molecular analyses to provide insights into seasonality and how various groups of ciliates respond to environmental and ecological conditions. To do this, I have focused on the ciliate communities of the New England shelf at the Martha’s Vineyard Coastal Observatory (MVCO).
In Chapter 2, I describe an updated Imaging FlowCytobot with automated staining capabilities (IFCB-S) that allows us to observe live ciliates, whether or not they exhibit chlorophyll fluorescence. I show applications of this instrument in various laboratory and field settings. In Chapter 3, I apply a statistical model to a ten-year time series (at a resolution of two weeks) of herbivorous ciliates at MVCO to investigate seasonality and multi-year trends. I focus on a subset of functional groups (an obligate mixotroph, a pho-totrophic ciliate, and a group of strict heterotrophs). In Chapter 4, I explore seasonality in taxonomic information from high throughput sequencing over three years and compare pat-terns between genotypes and morphotypes. In Chapter 5, I summarize my findings, provide hypotheses drawn from them, and comment on future studies.
Chapter 2
Microzooplankton community
structure investigated with imaging
flow cytometry and automated
live-cell staining
Emily F. Brownlee1,2, Robert J. Olson2, Heidi M. Sosik2
1MIT-WHOI Joint Program in Oceanography/Applied Ocean Science and Engineering,
Cambridge, MA 02142, USA
2Biology Department, Woods Hole Oceanographic Institution, Woods Hole, MA 02543, USA
Available online: Brownlee, E.F., R.J. Olson, H.M. Sosik. 2016. Microzooplankton com-munity structure investigated with imaging flow cytometry and automated live-cell staining. Marine Ecology Progress Series. 550:65-81. doi:10.3354/meps11687
live cells in situ without the need to culture or preserve. IFCB records images of cells with chlorophyll fluorescence above a trigger threshold, so to date taxonomically resolved analysis of protozoa has presumably been limited to mixotrophs and herbivores which have eaten recently. To overcome this limitation, we have coupled a broad-application ‘live cell’ fluorescent stain with a modified IFCB so that protozoa which do not contain chlorophyll (such as consumers of unpigmented bacteria and other heterotrophs) can also be recorded. Staining IFCB (IFCB-S) revealed higher abundances of grazers than the original IFCB, as well as some cell types not previously detected. Feeding habits of certain morphotypes could be inferred from their fluorescence properties: grazers with stain fluorescence but without chlorophyll cannot be mixotrophs, but could be either starving or feeding on heterotrophs. Comparisons between cell counts for IFCB-S and manual light microscopy of Lugol’s stained samples showed consistently similar or higher counts from IFCB-S. We show how automated classification through the extraction of image features and application of a machine-learning algorithm can be used to evaluate the large high-resolution data sets collected by IFCBs; the results reveal varying seasonal patterns in abundance among groups of protists.
2.2 Introduction
Heterotrophic protists are significant in marine ecosystems; they mediate top-down control of primary producers, as well as playing central roles in the microbial loop and food web (Heinbokel & Beers, 1979; Lessard & Swift, 1985; Jacobson, 1987; Verity, 1985; Stoecker & Capuzzo, 1990; Bjørnsen & Kuparinen, 1991; Hansen, 1991; Verity, 1991). These micro-zooplankton have not been studied as extensively as other plankton, however, because it is typically time-consuming and difficult to enumerate and identify them. Many are fragile and net collection can be harmful to their structure. Furthermore, their soft bodies make preservation difficult due to shrinkage and distortion or disintegration (Stoecker et al., 1994). Certain types of preservation can also lead to lysis and egestion of food vacuole contents Sieracki et al. (1987). Protozoa are challenging to culture due to their complex nutritional needs. Because of these difficulties, long-term, high-resolution data sets are rare. This limits our ability to characterize how their abundance and community structure respond to natu-ral variations such as seasonality and longer-term trends associated with environmental and climate change.
New technology that combines microscopy and flow cytometry promises to overcome some of these observational challenges by enabling high temporal resolution sampling for long periods of time. Imaging FlowCytobot (IFCB), which uses laser-induced fluorescence to trigger capture of images of individual plankton, is one such system (Olson & Sosik, 2007). While IFCB was originally designed to characterize phytoplankton, it can also be used to study herbivorous and mixotrophic protozoa in situ without the need to culture or preserve. Herbivorous protozoa ingest phytoplankton that can continue to fluoresce inside food vacuoles. Kleptoplastidic and mixotrophic protozoa are also fluorescent because they retain functional chloroplasts to supplement their nutrition.
Complete protozoan assemblages are traditionally counted and identified by epifluo-rescence microscopy of samples stained with protein or nucleic acid stains. These tradi-tional methods quantify not only herbivorous microzooplankton, but also those grazing on non-chlorophyll-containing cells. To observe the complete heterotroph community, imaging methods must employ triggering on a property common to all grazers. Such triggering can be provided by ‘live cell’ fluorescent stains such as LysoTrackerrGreen (LTG) (Molecular Probes) or fluorescein diacetate (FDA) (Sigma-Aldrich). FDA permeates the cell to fluo-resce in the presence of enzymatic activity. LTG accumulates within acidic food vacuoles so actively grazing protists can be distinguished. These stains accumulate within living cells to provide high signal-to-noise. Phototrophs can take up stain, but in cytometric analy-ses they can be differentiated from heterotrophs by their relatively high levels of red auto fluorescence from chlorophyll. Heterotrophs with chloroplasts in their food vacuoles may also express red autofluorescence, but typically at lower levels than autotrophs of similar size. Since IFCB is normally limited to detecting herbivorous or mixotrophic protozoa, the use of a stain to view a more complete community represents a powerful advance for this observational technique.
2.3 Materials and Methods
2.3.1 Instrument designWe modified a standard IFCB to carry out automated staining and incorporated optical components that enable it to detect either orange (as from phycoerythrin, PE) or green (stain) fluorescence, in addition to chlorophyll fluorescence. The optical and fluidic design for IFCB has been described in detail in Olson & Sosik (2007). A sample (typically 5 ml) is drawn into the instrument by a programmable syringe pump. The sample water is injected into the center of a particle-free sheath flow in the cone above a rectangular quartz flow cell. In the standard IFCB, seawater is drawn into a sample syringe and then injected directly into the cone through a needle; after the flow cell, particles are removed by passage through cartridge filters to regenerate sheath fluid. For IFCB-S, we added new fluidics control features utilizing IFCB’s distribution valve and new solenoid valves (100T2NC24-62-4E, Bio-Chem Valve) to allow for automated addition of stain, as well as for discarding sheath fluid during stained sample analysis (to prevent accumulation ofstain in the system). Staining is carried out in a mixing chamber (a 50 ml Falcon tube fitted with plumbing) connected to an extra port on the valve. First, a microinjector (120SP2420-4EE, Bio-Chem Valve) adds 20 µl of concentrated stain to the empty chamber. Then the seawater sample is pushed through the distribution valve into the mixing chamber, where it mixes with the stain and incubates (typically for 30 s) before being pulled back into the sample syringe and sent through the flow cell for analysis (Fig. 2-1).
Standard IFCB excites chlorophyll fluorescence with a 635 nm diode laser (details in Olson & Sosik 2007). As a particle passes through the focused laser, laser light is scattered and chlorophyll-containing cells emit red fluorescence (680 nm). One (or more) of these signals, usually chlorophyll fluorescence, is used to trigger a 1 µs pulse from a xenon flash lamp. The green component of the lamplight is isolated by a bandpass filter and used for the camera exposure. Dichroic mirrors separate the wavelengths used to detect chlorophyll fluorescence and side scattering (680 nm and 635 nm, respectively). In the modified optics for IFCB-S (Fig. 2-2), the 635 nm laser is replaced by a 508 nm diode laser (Power Technology, model PM20(510-50)G4, 20 mW) that can excite fluorescence from the stain (530 nm), as well as from chlorophyll (680 nm) and phycoerythrin (575 nm). A 488 nm laser can also be
570 nm shortpass filter is inserted before the photomultiplier tube that detects PE because 488 nm excitation causes Raman scattering from water at ⇠590 nm. We incorporated an automated optical filter slider making it possible to detect either orange (PE) fluorescence for unstained samples or green (stain) fluorescence for stained samples. To detect stain fluorescence, IFCB-S uses a ‘double dichroic’ (Omega Optical, 595 DMSP), which transmits light between 560 and 595 nm to the camera and reflects light below and above this band to the photomultiplier tubes. To detect PE fluorescence (when samples are not stained), IFCB-S uses a 555 DMSP, which transmits 530 to 570 nm and reflects longer wavelengths.
2.3.2 Staining validation
We used a cultured marine bacterivorous scuticociliate (Uronema marinum, isolated from Buzzards Bay, MA, in 1986; D. Caron pers. comm.) to evaluate initial IFCB-S performance. Cultures were maintained at 15 C on a 14:10 h light:dark cycle and transferred weekly into 40 ml sterile filtered seawater with 1 drop yeast extract and 2 rice grains. As a control, scuticociliate cells were imaged with IFCB-S triggering on scattering to ensure detection of all cells. To evaluate stain detection, cells were then analyzed with IFCB-S triggering only on stain fluorescence with and without stain added.
2.3.3 IFCB-S stain protocol
To select an appropriate stain concentration, various stock stain concentrations (0, 0.01, 0.05, 0.1, 1, 2 mg FDA ml 1 acetone) were tested on a scuticociliate culture analyzed with
IFCB-S triggering on stain fluorescence. As a control, an unstained sample (stock stain concentration of 0 mg FDA ml 1 acetone) was triggered on scattering. For each stock
concentration, we added 8 µl of stain to a 2 ml sample prior to analysis on IFCB-S. This resulted in final stain concentrations of 0, 0.04, 0.2, 0.4, 4, and 8 µg FDA ml 1. Once a
cytometer. Each day the scuticociliate culture was analyzed 3 ways; unstained and triggering on side scattering, stained with LTG and triggered on stain fluorescence, and stained with FDA and triggered on stain fluorescence. We withdrew 2 ml subsamples of the culture and added either 8 µl of FDA solution (1 mg ml 1 stock solution in acetone for a final
concentration of 4 µg ml 1) or 1.25 µl of LTG solution (1 mM stock diluted to 12 µM working
stock for a final stain concentration of 75 nM). For each run through the FACSCalibur, 120 µl was analyzed over 2 min.
2.3.5 Comparison with conventional microscopy
Seawater samples were collected from Woods Hole Harbor (Massachusetts, USA). Samples were kept at in situ temperature for approximately 6 h while aliquots were taken for analysis on IFCB-S in staining and non-staining modes (50 ml were analyzed in total by pooling results from ten 5 ml subsamples). For manual microscopic counts, 200 ml of the sample was fixed with 10 ml acid Lugol’s solution (final concentration 5%, modified from Throndsen (1978)). Acid Lugol’s-fixed samples (50 ml) were settled for 24 h in Utermohl chambers and cells were subsequently enumerated under a Zeiss Axiovert S100 inverted microscope at 40X magnification.
Microzooplankton counts from manual light microscopy were compared to those from IFCB-S in staining mode (triggering on chlorophyll and stain fluorescence) and IFCB-S in non-staining mode (triggering on chlorophyll and PE fluorescence). For these comparisons, ciliates were grouped into 4 taxonomic categories: tintinnids, Mesodinium spp., Laboea strobila, and ‘other ciliate taxa’. The heterotrophic dinoflagellates, Gyrodinium spp. and Protoperidinium spp. were also considered for comparison. Analyses were performed during all 4 seasons; winter, spring, summer, and fall (with the winter and fall sample lacking man-ual light microscopy). Poisson distribution statistics were used to calculate 95% confidence intervals for counts. The E-Test statistic described by Krishnamoorthy & Thomson (2004) was used to test for significant differences.
2.3.6 Comparison of detection between IFCB and IFCB-S
For field assessment, IFCB-S was used during the National Marine Fisheries Service Ecosys-tem Monitoring survey (ECOMON, EX-13-05) aboard the NOAA Ship ‘Okeanos Explorer’
southern New England waters northward through Georges Bank and the Gulf of Maine to Nova Scotia shelf waters. IFCB-S was used side-by-side with a standard IFCB for con-tinuous sampling of water from the ship’s underway system (3 m sample depth). The standard IFCB triggered on chlorophyll fluorescence, while IFCB-S was configured to alter-nate between staining (triggering on chlorophyll and/or stain fluorescence) and nonstaining (triggering on chlorophyll and/or PE fluorescence) modes.
2.3.7 Automated classification of a time series
Since 2006, standard IFCB has been deployed underwater (⇠4 m depth) at the offshore tower of the Martha’s Vineyard Coastal Observatory (MVCO), located 3 km south of Martha’s Vineyard, Massachusetts, USA. At MVCO, IFCB has provided near continuous long-term observations (2006 to present) of phytoplankton ranging from ⇠10 to 400 µm in length, as well as herbivorous and mixotrophic ciliates that exhibit chlorophyll fluorescence. Routine analysis of IFCB data includes image processing, feature extraction, and supervised auto-mated classification as described by Sosik & Olson (2007) except that instead of the original support vector machine, we used a random forest classification algorithm after Breiman (2001). We applied a classifier with 50 categories, including L. strobila, mixed tintinnids, and mixed other ciliates. For each unknown image, results from the classification algorithm (Tree-Bagger function in MATLAB, The Mathworks) provide an affiliation score for each category (scores sum to 1 across all categories). By selecting a score threshold above which classifications are accepted, it is possible to reduce the incidence of false positives, albeit typically at the expense of lower probability of detection for true positives.The efficacy of this approach is demonstrated here by comparing intermittent manual image identification with a high-resolution multi year time series of cell abundance from the automated classifier for the ciliate species L. strobila at MVCO. L. strobila was chosen as a target because it has distinct morphology, it is typically among the top 5 contributors to micrograzer biomass on
an average correction efficiency is applied by dividing the total by the regression slope for the chosen threshold.
2.4 Results
2.4.1 Imaging of protozoa
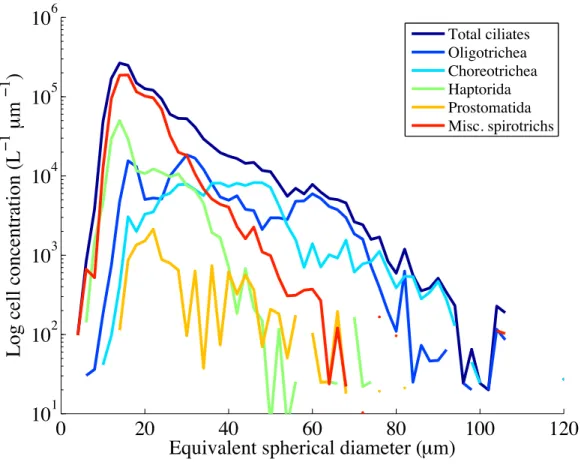
The level of taxonomic identification allowed by IFCB images varies, but some distinctive taxa, such as Laboea strobila, can be identified to the species level. At MVCO, the pre-dominant ciliates detected by the standard IFCB come from the Spirotrichea subclasses Oligotrichia and Choreotrichia (Fig. 2-3). The photosynthetic ciliate Mesodinium spp. is also readily detected due to its mixotrophic nature. More rare ciliate taxa include the haptorid Didinium spp. and the prostomatid Tiarina fusus.
Heterotrophic dinoflagellates are also detected if they are consuming phytoplankton (Fig. 2-4). These are predominantly gyrodinoid and gymnoid forms. Occasionally Protoperi-dinium spp. and AmphiProtoperi-dinium spp. are observed.
The instrument can capture images of cells or chains up to at least 400 µm, though sampling is limited to cells <150 µm in width.
All images from the MVCO data set can be viewed and accessed through the IFCB Data Dashboard (Sosik & Futrelle (2012); http://ifcb-data.whoi.edu/mvco). All annotated ciliate and dinoflagellate images (organized by year and taxonomic group) are available from the published WHOI-Plankton data set (Sosik et al., 2015). Heterotrophic dinoflagellates are also detected if they are consuming phytoplankton (Fig. 2-4).
2.4.2 Performance of IFCB-S
To evaluate the ability of IFCB-S to stain and detect ciliates lacking chlorophyll fluorescence, we used a bacterivorous scuticociliate culture. On a standard IFCB triggering on chlorophyll fluorescence, these ciliates do not trigger image capture, so initially we used a side-scattering trigger to detect all particles (Fig. 2-5A). In this case, both detrital particles and ciliates were imaged, with detrital particles dominating but ciliates readily detectable. When a non-stained cell culture was analyzed on IFCB-S configured to trigger on stain fluorescence, no scuticociliates were detected, as expected, since these cells do not exhibit detectable
stain fluorescence trigger (Fig. 2-5C). Triggering on stain fluorescence rather than scattering increases the time spent imaging ciliates as opposed to detritus (75% of the fluorescence-triggered images contained ciliates compared to only 41% of scattering-fluorescence-triggered images).
2.4.3 Comparison of stains
To compare the performance of LTG and FDA, scuticociliate cell counts were determined by conventional flow cytometry triggering on stain fluorescence. Detection efficiency was similar between the 2 stains (Fig. 2-6), allowing for further considerations to be used in selecting the optimal stain for use in IFCB-S. We selected further application of FDA due to its stability in solution for up to 6 mo at room temperature (pers. obs.), as well as its lower cost. Recommended storage for LTG is -5 to -30 C, which presents challenges for long-term in situ deployments.
2.4.4 Determining stain protocols
We found the average stain fluorescence levels of scuticociliates measured by IFCB-S in-creased until leveling off at a final stain concentration of 4 µg FDA ml 1 (Fig. 2-7A). The
unstained sample displayed low levels of stain fluorescence, representing instrument noise. We chose the final concentration of 4 µg FDA ml 1 for use in the IFCB-S system to
max-imize sensitivity without introducing excess stain that could contaminate the instrument’s fluidic system and require extra rinsing to remove.
The time course of cell stain fluorescence during the 20 min analysis of a 5 ml scutic-ociliate culture sample showed a slight increase of average stain fluorescence over the first 6 min of the sample and a slight decrease over the last 6 min (Fig. 2-7B). All cells stained, though, were above the detection level and whole cell counts per 30 s bin remained constant until a small increase in the last 2 min of the sample. That increase may partially be due to cells concentrating near the top of the syringe and being analyzed later in the time course.
2.4.5 Comparison of IFCB-S and manual microscopy
We evaluated performance of IFCB-S on environmental samples by comparison with the con-ventional mode of counting protozoa: settling and using manual microscopy to count cells in acid Lugol’s stained samples. We also compared IFCB-S counts with staining (chloro-phyll and stain fluorescence trigger) and without staining (chloro(chloro-phyll fluorescence trigger only). We specifically compared abundances for Mesodinium spp., L. strobila, mixed tintin-nids, Protoperidinium spp., and mixed gyrodinoid dinoflagellates. During a comparison of wintertime samples, no significant differences were found between ciliate morphotypes detected by IFCB-S with and without staining (Fig. 2-8A). In stained samples, however, more gyrodinoid dinoflagellates were detected, indicating these organisms are likely consum-ing heterotrophs and thus often missed by standard IFCB with a chlorophyll trigger (Fig. 2-8A). During a springtime comparison, IFCB-S detected approximately 25% more mixed ciliates than microscopic analysis (Fig. 2-8B). At that time, there were no significant differ-ences in abundances for other micrograzer morphotypes between the methods. There were also no differences in detection between staining and non-staining modes (Fig. 2-8B), con-sistent with most protists containing chlorophyll either in their guts or in retained plastids. A summertime sample allowed only for comparison in the ciliate mix and tintinnid groups as other types were not observed (Fig. 2-8C). For the detected ciliate types, both stained and unstained sample concentrations were significantly higher than manual microscopy. A fall comparison did not show any significant differences between staining and non-staining modes (Fig. 2-8D).
2.4.6 IFCB-S field application
IFCB-S was configured for automated underway sampling of surface waters during a cruise over the northeast US continental shelf (August 2013). We examined ciliate and gyrodinoid dinoflagellate abundance and compared morphotypes that did and did not ingest algae. Two populations of organisms were observed in the stained samples: one with high chlorophyll fluorescence and one with little to no chlorophyll fluorescence; both showed a range of stain fluorescence that roughly corresponded to cell size. Ciliates and dinoflagellates were present in both of these groups, so it was possible to detect a greater number of total grazers in stained samples. This was due to taxa present in the low red / high stain fluorescence
population (Fig. 2-9).
Observations of tintinnids during the cruise provided a notable example of the advan-tages of IFCB-S. We found 2 morphologically different groups of tintinnids in the stained samples: one with high chlorophyll fluorescence and one with little to no chlorophyll fluores-cence; as expected, both groups exhibited stain fluorescence. Only chlorophyll fluorescent tintinnids were detected by the standard IFCB, with maximum concentrations reaching ap-proximately 0.4 cells ml 1 (Fig. 2-10A). This population was captured by IFCB-S in similar
concentrations, but the second population with little chlorophyll fluorescence was detected only by this instrument, with resulting higher total tintinnid maximum abundances deter-mined by IFCB-S compared to IFCB (⇠1.1 cell ml 1) (Fig. 2-10B). The staining of samples
consistently allowed for detection of a group of tintinnids that otherwise would not have been observed.
2.4.7 Automated classification
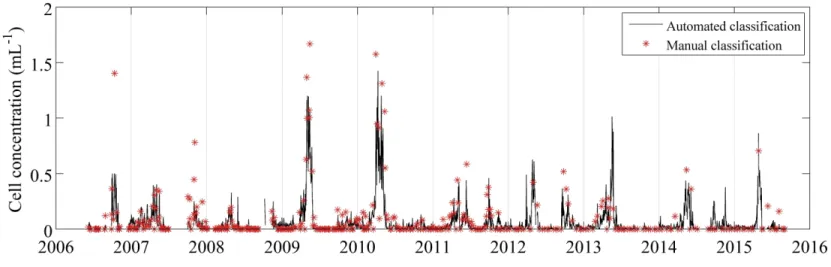
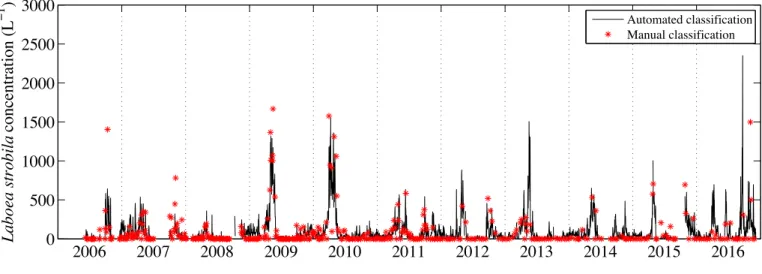
Automated classification is essential for analyzing the large data sets produced by IFCB and IFCB-S. We explored the automated approach for ciliates by comparing manual and automated identification of images for times series data from 2006 to 2015 for L. strobila. Regression analysis between manual and automated classification results (Fig. 2-11) sug-gested an optimal classifier score threshold of 0.7 (i.e. an image is classified as L. strobila only if the score associated with the class is >0.7): the R2 value was high, the y-intercept
was not significantly different from 0, and the slope was relatively close to 1. This 0.7 threshold produced an acceptable tradeoff between detection efficiency and occurrence of false positives. This tradeoff is reflected in the performance statistics of the classifier, which for the case of the random forest method we used can be determined from the unbiased internal error rates (out-of-bag estimates that do not require a separate test set; Breiman 2001). From this approach, our classifier has a probability of detection = 0.97 and precision
variability with both showing distinct seasonal patterns in L. strobila abundance (Fig. 2-12). At finer scales, there can be discrepancies between automated and manual identification. Some of these discrepancies may be caused by patchiness at MVCO interacting with sampling differences: in some cases, manual classification was only completed for a few hours within a given day, while the daily estimate for automated classification reflects sampling over the entire day. If different water masses were moving by the MVCO offshore tower throughout the day, high frequency variability in cell concentration might lead to mis-matches with the resulting daily average values. For event- to seasonal-scales, fully automated abundance estimates provide robust patterns, with blooms of L. strobila occurring during April-May in most years, and some evidence for fall blooms that are smaller and more variable.
2.5 Discussion
Protist micrograzers are key players in aquatic ecosystems yet they are difficult to study due to methodological challenges. The standard IFCB is a powerful tool for studying these organisms in situ. Because IFCB can be deployed long-term, it is effective for characterizing protozoan community structure with high temporal resolution. It can image a wide variety of grazers and provide insight into which organisms are present (e.g. Figs. 2-3 & 2-4), as well as their seasonal dynamics (Fig. 2-12). There are limitations, though, because the reliance on chlorophyll fluorescence for image triggering means standard IFCB is only able to quantify patterns of herbivores and mixotrophs. The addition of broad-application live cell staining is appropriate to take this observational technique forward to view a more complete community.
In typical cytometric analyses, there can be difficulty when discriminating a phototroph with concentrated stain from an herbivorous or mixotrophic protozoan because both can have high levels of chlorophyll fluorescence. Imaging technology allows us to differentiate the two from the images associated with each cell. On the other hand, some grazers may have undetectable levels of chlorophyll fluorescence or none at all (for instance, those grazing on heterotrophs) and the addition of stain is necessary for efficient detection. There are a number of possible fluorescent stains that can be used to label protists for flow cytometry. We considered several factors in selecting a stain for use with IFCB-S, including whether the stain fluorescence can be differentiated from chlorophyll and can remain stable at
am-bient temperatures (important for long-term in situ deployments). Most importantly, the wavelength of the laser must be able to induce fluorescence by the stain, but limit overlap of emitted wavelengths with scattered laser light. This criterion led us to focus on LTG and FDA as candidates. While suggested final FDA concentrations vary (Dorsey et al., 1989; Jochem, 1999; Onji et al., 2000; Peperzak & Brussaard, 2011), 0.06-500 µg FDA ml 1), we
recommend use of FDA for extended in situ staining application at a final concentration of 4 µg FDA ml 1. Though 30 s of staining is adequate to stain all cells (so appropriate for
most analyses), if maximum stain accumulation is desired, stained samples should be incu-bated for 2-6 min before analysis and sample analysis time should be limited to 10-15 min. FDA’s effectiveness is comparable to that of LTG (Fig. 2-6), while its ability to remain stable at ambient temperatures (Boyd et al. (2008) and pers. obs.) and its affordability make it preferable. Because LTG stains the acid vacuoles created during digestion (Rose et al., 2004), it might be useful to distinguish those protists that are actively grazing, but our observations showed general staining of all cells including pure autotrophs (likely be-cause chloroplasts can be acidic) and not in relation to levels of grazing. With controlled analysis of a bacterivorous scuticociliate culture, we have shown that automated staining can be used to readily detect and image grazers previously undetectable with IFCB (Fig. 2-5). While the degree of staining may be variable for different grazers, our results suggest that widespread detection of grazers without chlorophyll fluorescence is possible.
To test the effectiveness of protozoa detection by automated imaging in mixed assemblage natural samples, we compared results to those from manual light microscopy. For samples collected from Woods Hole Harbor in spring and summer, significantly higher abundances of mixed ciliates were detected with IFCB-S compared to manual microscopy (Fig. 2-8B,C). This suggests traditional counting methods involving preservation and settling may be so detrimental to the cells that they become undetectable. This is consistent with the conclusions of Stoecker et al. (1994) that no single method of fixation is ideal for all purposes,
biased towards certain morphotypes over others, as the range of microzooplankton detected with the IFCB-S did not differ from those observed with manual microscopy.
Comparisons between staining and non-staining modes with IFCB-S emphasize the value added by combining automated staining with imaging. During summertime sampling in Woods Hole Harbor, significantly higher counts of tintinnids and mixed other ciliates were observed in stained samples (Fig. 2-8C). These higher counts indicate that many ciliates exhibited no chlorophyll fluorescence (or too little to measure with IFCB-S), so staining was required to detect them. This comparison also provides insight into aspects of feeding strategy: the ciliates only detected after staining are presumably not mixotrophs and were either not actively grazing or were grazing on heterotrophs. Various types of tintinnids are known to graze on other heterotrophs (Sherr et al., 1989) so this result is not surprising for that group. Interestingly, we found no difference for mixed ciliates during the summer and, for a spring sample comparison, we found no significant differences between staining and non-staining modes of the IFCB-S for any category. This likely indicates chlorophyll-containing micrograzers dominated, presumably a combination of mixotrophs and organisms actively feeding on autotrophs. Also working in waters near Woods Hole, Stoecker et al. (1989b) similarly found that, during summer seasons, when there is low phytoplankton biomass, autotrophic and mixotrophic ciliates can contribute high amounts of production, becoming important food sources for higher trophic levels. During winter sampling, we found similar abundance for ciliates with and without staining, but a heterotrophic gyrodinoid dinoflagellate was much more abundant in stained samples (Fig. 2-8A). While taxon-specific differential feeding has been observed in both ciliates and dinoflagellates (Lessard & Swift, 1985; Verity, 1991), seasonal patterns of this have not been explored in detail. Our results suggest there could be taxon-specific differences in feeding strategies that vary with season. Preliminary field applications of IFCB-S during the summer ECOMON survey further demonstrate and support expanded capabilities to detect heterotrophic protists. We found the use of stain allowed for imaging of greater numbers of ciliates on the cruise by IFCB-S compared with a standard IFCB (Fig. 2-9). The additional cells detected by IFCB-IFCB-S exhibited high ratios of stain fluorescence to chlorophyll fluorescence, indicating these grazers were unlikely to have been ingesting phytoplankton. Some ciliate morphotypes were similar in abundance during staining and non-staining modes and exhibited a range of chlorophyll
fluorescence still have an autotrophic component of their diet, but with levels so low that they were only imaged when stained.
The use of stain also made it possible to detect additional ciliates during underway sampling on the cruise (Fig. 2-10). We found significantly higher numbers of the tintinnid Eutintinnus spp. than captured by the standard IFCB. Most of this population did not have chlorophyll fluorescence above the trigger threshold so they were not reliably counted without stain. At the same time, a different group of tintinnids with agglomerated lori-cas, Tintinnopsis spp., were observed with both the standard IFCB and IFCB-S at similar abundances due to their consistently high chlorophyll fluorescence.
Taken together, these comparisons not only support the efficacy of automated staining, they also provide insight into the diet of micrograzers. With observations such as these, we can start to hypothesize about the various diets and how they are distributed across taxa. If similar morphotypes exhibit a range of high and low chlorophyll fluorescence, we can infer that all feed on autotrophs, but that those with consistently low levels of chloro-phyll fluorescence relative to their size and stain fluorescence supplement their diets with heterotrophs. While we cannot discern whether a grazer is herbivorous or mixotrophic (both exhibiting chlorophyll fluorescence along with FDA fluorescence), we can take into account a priori knowledge based on morphotypes from our images to gain further insights into pos-sible feeding habits. For example, the primarily phototrophic dinoflagellate Gymnodinium sanguineum has been found to feed on oligotrich ciliates during times of nitrogen limita-tion (Bockstahler & Coats, 1993). Our analyses would observe varying levels of chlorophyll fluorescence indicative of either herbivory or mixotrophy, but previous knowledge suggests the mixotrophic nature of this protist. Morphotypes that consistently exhibit undetectable chlorophyll fluorescence are likely to be grazing predominantly on other heterotrophs. A sin-gle morphotype could be comprised of genetically distinct populations, possibly exhibiting different feeding strategies, in which case this would be reflected in a range of chlorophyll
grazer diet preferences.
These kinds of analyses also prompt questions about whether certain morphotypes ex-hibit different diets through time (perhaps depending on prey availability). For example, we detected similar gyrodinoid dinoflagellate morphotypes throughout the year in Woods Hole Harbor, but whether they were dominantly chlorophyll-containing or not differed with time (Fig. 2-8). This observation is consistent with certain feeding strategies being more favor-able than others at different times of the year, but more extensive observations are needed to determine if recurrent patterns occur seasonally. Heterotrophic dinoflagellates, such as Gyro-dinium spp., have been observed to feed on a wide range of prey types, from pure autotrophs to other heterotrophic organisms such as bacteria and small flagellates (Gaines & Elbrachter, 1987; Jacobson, 1987; Hansen, 1992; Saito et al., 2006; Jeong et al., 2008). Though dinoflag-ellates have been observed to be dominant grazers on diatoms (Sherr & Sherr, 2007), this may not always be the case in waters near Woods Hole. During the winter, when chain-forming diatoms dominate the autotroph biomass, most gyrodinoid dinoflagellates were not chlorophyll containing (Fig. 2-8A), indicating it may be more favorable for them to feed on smaller heterotrophs. Hansen (1992) noted that heterotrophic dinoflagellates may at times outcompete other grazers by being able to efficiently maintain metabolism at low prey con-centrations. One interpretation of our results is that these dinoflagellates are feeding less in the winter. During the spring and summer, when the gyrodinoid morphotype was pre-dominantly chlorophyll-containing, it may have been feeding on small autotrophs. Certain species of gyrodinoids, such as Gyrodinium dominans, have been found to respond quickly to increases in cryptophytes (Schmoker et al., 2011), which can be important at that time of year.
Interestingly, we observed a contrasting pattern for ciliates compared to the gyrodinoid dinoflagellates; ciliates appear to be predominantly herbivorous or mixotrophic during the winter when gyrodinoid dinoflagellates were not (Fig. 2-8A). This is perhaps surprising since the ability of the two to ingest autotrophs has been shown to be comparable (Neuer & Cowles, 1995). This difference could reflect ciliates having the potential to grow faster than their heterotrophic dinoflagellate competitors (Banse, 1982; Hansen, 1992; Strom & Morello, 1998). In winter the dinoflagellates may be occupying a different niche associated with sustaining low growth rate via consumption of small heterotrophs. Though these
of longer time periods to address questions of seasonality in a more quantitative manner. Addressing these types of questions with large image data sets that include this more complete community of micrograzers raises immediate data analysis challenges, and auto-mated image analysis and classification will be imperative. We can build from the approaches used for phytoplankton (Sosik & Olson, 2007) to develop automated classification for these new populations. While work remains to extend automated classification to a wide range of protist morphotypes, we have shown efficacy for selected ciliates. For Laboea strobila, in particular, we can detect recurrent blooms and seasonal patterns with automated classifica-tion, as verified by intermittent manual identification of images. Our analysis emphasizes a recurrent spring bloom (Fig. 2-12), which is consistent with seasonal trends previously doc-umented for L. strobila in the Gulf of Maine (Sanders, 1995). Modigh (2001) also observed a spring peak in the abundance of this species during a 3 yr study in the Mediterranean Sea. It remains to be determined what factors drive the similar spring increase between both New England and other temperate waters. Interestingly, our high-resolution time series has uncovered an additional more variable and smaller amplitude fall increase in L. strobila abundance (Fig. 2-13). Whether this is a feature in other systems is not known.
We have demonstrated that the expanded observational capabilities of IFCB-S make it possible to use live cell stains such as FDA to uncover a more complete micrograzer com-munity in natural waters. When coupled with automated image analysis and classification this allows us to explore the diversity, dynamics, and ecosystem roles of protistan grazers in new ways. Not only are we now able to detect populations grazing on heterotrophs (those with undetectable chlorophyll fluorescence), but also we can detect some taxa at higher abundances than observed with traditional manual light microscopy coupled with settling of preserved cells. Because IFCB-S requires little sample handling and no preservation, it likely has reduced loss of delicate cells.
seen in seasonal changes in whether certain morphotypes exhibit chlorophyll fluorescence from retained chloroplasts or undigested autotrophic prey.
Along with optical information from the images, we also derive morphological character-istics, which have previously been used to gain insight into predator-prey dynamics. Most notably, cell size has been used to understand these relationships (Hansen et al., 1994), and has proved to be quite useful. Previous studies have shown size distributions of ciliate micrograzers and their prey throughout the year can help infer trophic transfer efficiency (i.e. a prey biomass which is high compared to the biomass of the predator points to a low efficiency and vice versa, (Gaedke & Straile, 1994), as well as how and if this changes year to year. Banas (2011) exploited these types of allometric relationships between grazer and prey size in developing a size-spectral model that they used to study the predictability of phy-toplankton bloom timescales in relation to food-web complexity (i.e. selective or generalist grazers). Though using grazer cell size as a proxy for diversity and diet has been advanta-geous, certain problems can arise in making these kinds of conclusions. Some grazers must be lumped into functional groups before size-relationships can be exploited; for example, filter feeders prefer relatively smaller prey than raptorial-interception feeders of the same size. With IFCB-S, we can not only determine the size of an organism (from images), but also differentiate morphotype and general feeding habit to infer certain functional groups. This combination of information can allow us to rigorously evaluate how appropriate certain size-structured generalities are and potentially uncover new patterns or relationships that reflect both size and function.
After a recent review of published data on microzooplankton grazing, Schmoker et al. (2013) highlight the need for more time series and higher taxonomic resolution during graz-ing studies. Though long-term data sets of protist micrograzers are not common, a few studies have emphasized the power of studying systems over long periods of time. Modigh (2001) observed similar patterns of succession in ciliate taxa every year for 3 yr, possibly indicating reduced competition between taxa and a diversified grazing pressure. During a one-year study, Lawrence & Menden-Deuer (2012) found seasonal changes in grazing rates corresponded more to prey community composition than environmental conditions such as temperature. This reflected a seasonal mismatch of predators and prey, which seemed to arise from more complex ecological interactions rather than simply resulting from
physiolog-IFCB-S facilitates the much-needed longterm studies of microzooplankton communities in situ and with its high resolution images provides notable advantages for detailed exploration of diversity. Because the IFCB-S also samples phytoplankton communities, in future we ex-pect this observational technology to enable unprecedented exploration of predator-prey interactions and patterns through space and time.