HAL Id: hal-01902641
https://hal-univ-rennes1.archives-ouvertes.fr/hal-01902641
Submitted on 15 Jul 2019
HAL is a multi-disciplinary open access
archive for the deposit and dissemination of
sci-entific research documents, whether they are
pub-lished or not. The documents may come from
teaching and research institutions in France or
abroad, or from public or private research centers.
L’archive ouverte pluridisciplinaire HAL, est
destinée au dépôt et à la diffusion de documents
scientifiques de niveau recherche, publiés ou non,
émanant des établissements d’enseignement et de
recherche français ou étrangers, des laboratoires
publics ou privés.
Thibault Ledieu, Guillaume Bouzillé, Frantz Thiessard, Karine Berquet,
Pascal van Hille, Eric Renault, Elisabeth Polard, Marc Cuggia
To cite this version:
Thibault Ledieu, Guillaume Bouzillé, Frantz Thiessard, Karine Berquet, Pascal van Hille, et al..
Time-line representation of clinical data usability and added value for pharmacovigilance. BMC Medical
Informatics and Decision Making, BioMed Central, 2018, 18 (1), pp.86. �10.1186/s12911-018-0667-x�.
�hal-01902641�
S O F T W A R E
Open Access
Timeline representation of clinical
data: usability and added value for
pharmacovigilance
Thibault Ledieu
1,2*, Guillaume Bouzillé
1,2,3, Frantz Thiessard
4, Karine Berquet
5, Pascal Van Hille
1,2,3, Eric Renault
1,2,
Elisabeth Polard
5and Marc Cuggia
1,2,3Abstract
Background: Pharmacovigilance consists in monitoring and preventing the occurrence of adverse drug reactions (ADR). This activity requires the collection and analysis of data from the patient record or any other sources to find clues of a causality link between the drug and the ADR. This can be time-consuming because often patient data are heterogeneous and scattered in several files. To facilitate this task, we developed a timeline prototype to gather and classify patient data according to their chronology. Here, we evaluated its usability and quantified its contribution to routine pharmacovigilance using real ADR cases.
Methods: The timeline prototype was assessed using the biomedical data warehouse eHOP (from entrepôt de données biomédicales de l’HOPital) of the Rennes University Hospital Centre. First, the prototype usability was tested by six experts of the Regional Pharmacovigilance Centre of Rennes. Their experience was assessed with the MORAE software and a System and Usability Scale (SUS) questionnaire. Then, to quantify the timeline contribution to pharmacovigilance routine practice, three of them were asked to investigate possible ADR cases with the“Usual method” (analysis of electronic health record data with the DxCare software) or the“Timeline method”. The time to complete the task and the data quality in their reports (using the vigiGrade Completeness score) were recorded and compared between methods. Results: All participants completed their tasks. The usability could be considered almost excellent with an average SUS score of 82.5/100. The time to complete the assessment was comparable between methods (P = 0.38) as well as the average vigiGrade Completeness of the data collected with the two methods (P = 0.49).
Conclusions: The results showed a good general level of usability for the timeline prototype. Conversely, no difference in terms of the time spent on each ADR case and data quality was found compared with the usual method. However, this absence of difference between the timeline and the usual tools that have been in use for several years suggests a potential use in pharmacovigilance especially because the testers asked to continue using the timeline after the evaluation.
Keywords: Informatics, Information visualization, Pharmacovigilance, Usability testing
* Correspondence:[email protected]
1INSERM, U1099, F-35000 Rennes, France
2Université de Rennes 1, LTSI, F-35000 Rennes, France
Full list of author information is available at the end of the article
© The Author(s). 2018 Open Access This article is distributed under the terms of the Creative Commons Attribution 4.0 International License (http://creativecommons.org/licenses/by/4.0/), which permits unrestricted use, distribution, and reproduction in any medium, provided you give appropriate credit to the original author(s) and the source, provide a link to the Creative Commons license, and indicate if changes were made. The Creative Commons Public Domain Dedication waiver (http://creativecommons.org/publicdomain/zero/1.0/) applies to the data made available in this article, unless otherwise stated.
Ledieu et al. BMC Medical Informatics and Decision Making (2018) 18:86 https://doi.org/10.1186/s12911-018-0667-x
Background
Pharmacovigilance is defined by the World Health Organization (WHO) as“the science and activities relating to the detection, assessment, understanding and prevention of adverse effects and any other drug-related problem.” [1] Pharmacovigilance requires the retrospective collection of information from the patients’ medical records in order to find clues concerning drug accountability in the occur-rence of adverse drug reactions (ADR). This means find-ing relevant information in patient records that may be evidence of an ADR. Clinical data are heterogeneous in terms of structure (structured or textual data) and domain (e.g., clinical/laboratory results or prescription data). Searching and organizing such information require spe-cific expertise and is often a time-consuming task due to the lack of adapted tools for this purpose.
The re-use of clinical data from patients has been facili-tated by the emergence of querying interfaces for clinical data warehouses, such as i2b2 tools [2] or complete systems (database and interface), such as eHOP [3]. These systems allow querying and analysing heterogeneous clinical data, and have been successfully exploited for clinical research (e.g., feasibility studies, patients’ pre-screening and recruit-ment for clinical trials [4]) and epidemiological studies (co-hort detection) [5]. Pharmacovigilance is another field where the exploitation of health databases could play a key role [6].
Among the different data-mining methods, visual data analysis could be useful for exploring complex data. In-deed, visualization of data on the history of individual patients or groups of patients could allow highlighting chronological clues and causal relationships between drug exposure and ADR. A timeline is an interactive chronological representation of a list of events that can include different types of data and time scales. In the lit-erature, several timeline tools for electronic health rec-ord (EHR) data visualization to explore individual or population-wide clinical data (e.g., Lifeline [7], Outflow [8], VisuExplore [9], Eventflow [10]) have been de-scribed. For instance, CareCruiser [11] provides simul-taneously a view of the patient’s data and therapeutic protocols for the analysis of treatment responses (e.g., for a patient on oxygen, the O2 saturation values will
vary depending on the treatment). VisuExplore [9] offers different types of graphs (distribution curves, histo-grams) depending on the data type (e.g., for a diabetic patient, insulin administration is displayed as dots, while biological parameters, such as glucose concentration, are displayed as distribution curves). KNAVE-II [12] is an interactive and semantic viewer of clinical data based on the use of domain ontologies. However, none of these tools has been evaluated for pharmacovigilance.
This work focused on a timeline tool developed in the framework of the Retrieval and Visualization of Electronic Health Records (RAVEL) [13] and Pharmaco-Epidemiology
of Health Products (Pharmaco-Epidémiologie des Produits de Santé,PEPS) research projects the main mission of which is the development of new methods for information research and visualization of heterogeneous clinical data. In this paper we present the evaluation of the usability of this prototype timeline and the quantification of its contribution to phar-macovigilance routine practice in terms of time saving and quality of the collected data.
Implementation
Timeline description
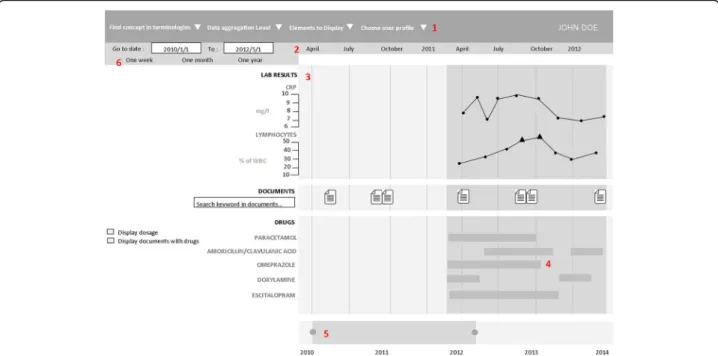
The prototype’s graphical user interface (GUI) was de-veloped using the JavaScript d3.js library [14]. For a broad use, this component was designed as a web ser-vice, weakly coupled to the EHR data source (eHOP for the prototype). eHOP (from entrepôt de données bio-médicales de l’HOPital), the biomedical data warehouse used by Rennes University Hospital Centre, contains comprehensive laboratory and clinical data on 1.6 mil-lion patients. It provides access to heterogeneous clinical information in the form of free text (hospitalization reports, discharge letters, etc.), of data coded using different termin-ologies (e.g., the International Classification of Diseases, 10th revision, ICD-10, medical diagnosis codes), and struc-tured data (laboratory results, prescriptions and drug ad-ministrations). The prototype used a web interface to allow interactive navigation. Real patient data were used for the prototype assessment. Figure1is a screen mock-up in Eng-lish to show how the information is displayed in the time-line. A real screenshot (in French) and demo are available in Additional file1.
To the best of our knowledge, this application includes new features. Specifically, semantic data aggregation/expansion was implemented by leveraging the hierarchical properties of different terminologies (Anatomical Therapeutic Chemical, ATC, classification system; French Common Classification of Medical Pro-cedures, CCAM; ICD-10; and the local terminology used by the Clinical Laboratory of Rennes). This ap-proach allows users to interactively control the granu-larity of the displayed information.
Medical codes (e.g., ICD-10 codes) can be directly searched in different terminologies using a hierarchical tree. This tree also allows users to choose the structured data they wish to display in the timeline. The choice of concepts to display can be pre-set according to the user’s specific medical field. The user also can search for terms in text documents via a free text search field. Each type of data has its own representation mode: graphs for clinical test results, windows for textual records and iconic language for med-ical terminologies (Visualization of Concepts in Medicine icons) [15]. The user can expand or reduce the time scale at will through two navigation controls: the overall time period selection and the timeline overview.
All these features were designed to facilitate navigating through the complexity of patient data.
Recruitment of experts
Expert users were recruited from a team of pharmacists and physicians who work at the Regional Pharmacovigi-lance Centre in Rennes and who are part of the target audience for our tool. Based on literature data [16], it was determined that five users were sufficient to identify 80% of the problems linked to the application’s usability [17]. Finally, six people (five women and one man among whom there were five pharmacists and one physician) could be recruited for the usability study, and three of them were also involved in the impact quantification study. These participants perform routinely pharmacovigi-lance activities. The six people received no financial com-pensation in exchange for their participation. Their mean age was 31.3 ± 4.5 years (range: 25 to 40). All routinely used computers as part of their pharmacovigilance activ-ity, particularly to study patient records.
Usability evaluation method
Usability is defined by the International Organization for Standardization (ISO) as the“extent to which a product can be used by specified users to achieve specified goals with effectiveness, efficiency and satisfaction in a speci-fied context of use”. [18] There are many methods for evaluating usability [17] and several are used for the de-velopment and evaluation of health-related software
programs [19–21]. We chose the ‘think-aloud protocol’ approach that has been described by Nielsen as “the most reliable evaluation method to obtain a usability es-timate” [22]. It is based on recording the participants’
opinion while they perform a series of tasks designed specifically for the usability evaluation [23]. Participants are asked to orally state their thoughts, perceptions and opinions while interacting with the application (concur-rent think aloud method). The participants’ performance during the execution of these tasks is then analysed by the evaluator. This method can be applied throughout all stages of the web application development and pro-vides qualitative data that will help evaluators to identify usability problems. It can also prompt the development of new features for the interface in response to the users’ feedback. The severity of the usability problems encoun-tered by users was rated with the Nielsen rating scale (from 0 = No usability problem to 4 = Usability catastro-phe) [24]. Peute and al. [25] showed that compared with the retrospective think aloud method, the concurrent method increases participants’ verbalization and leads to a higher detection rate of usability problems. In addition, this method seems to be more reliable than the retro-spective analysis of the test record, conducted in the users’ presence.
Usability evaluation use case
An ADR case, chosen in collaboration with the head of the Pharmacovigilance Centre, was used to test all the
Fig. 1 Timeline interface. The interface individual components are: 1. Selection of patient, laboratory and clinical data and medical codes (e.g., ICD-10 code). 2. Time scale. 3. Laboratory results in the form of graphic curves (dots show normal values; triangles and their orientation represent anomalous values). 4. Drug prescriptions and treatment duration (start, end and overall duration time, as well as the drug regimen. 5. Timeline overview for navigation. 6. Overall time period selection 4.
prototype’s features in a real-life situation. Participants were asked to determine whether or not the adverse re-action experienced by a patient admitted in intensive care resulted from exposure to an antibiotic. To this aim, they had to perform four main tasks: i) to find the patient’s name and address, ii) to determine the exact nature of the adverse reaction and collect all pertinent information, iii) to find information on the suspected drug (name and dose, for instance) and iv) to collect in-formation on the ADR outcome.
Usability evaluation procedure
Before the usability test, all users underwent, at the same time, training to become familiar with the time-line functionalities for about one hour. For this training session, fictitious patient data were created in the same format as the actual data to be able to show/test the features of the timeline without having to access real patient data. During this training session, participants could visualize the data of a fictitious patient in the timeline (e.g., drug prescriptions, laboratory data, re-ports) and could use each functionality at least once (see Timeline description chapter for details on these functions). If a user encountered a problem, the trainer helped him/her to overcome this problem. This training session and the usability test of the prototype took place at the Medical Informatics Laboratory of Rennes University. The working environment (operating sys-tem, computers, etc.) was the same as the one used at the Pharmacovigilance Centre. Usability tests (six ses-sions with one participant per session) were performed in the presence of the evaluator, who observed the in-teractions between participant and interface and noted his/her observations on paper. Each participant re-ceived a notebook to record all relevant data retrieved on the use case. The usability testing sessions were re-corded on video, as well as all interactions with the interface (keyboard input and mouse movements within the application). The recording and subsequent analysis were made using MORAE (TechSmith, software ver-sion 3.3.4). The video recordings were analysed after all participants had completed all the tasks. The MORAE software can capture on-screen video footage, while simultaneously recording the interactions between par-ticipant and GUI. Moreover, the parpar-ticipants’ face was also recorded, thus allowing the evaluators to assess, retrospectively, their expression and reactions while interacting with the prototype.
At the end of the usability test, each participant filled in the System and Usability Scale (SUS), translated into French. This questionnaire allows measuring the application’s usabil-ity in a fast and reliable way [26], and scoring was done as proposed by Sauro and Lewis. [27] Finally, each participant was interviewed using open-ended questions to determine
the timeline features they most appreciated and whether they encountered any particular problems. In addition, users were asked about suggestions to improve the timeline. The inter-views were not recorded.
Quantitative impact study
For the impact study, the timeline prototype was slightly modified to take into account the suggestions/remarks from the six participants after the usability test (the added features are described in the Results section).
Selection of patient records for the impact study
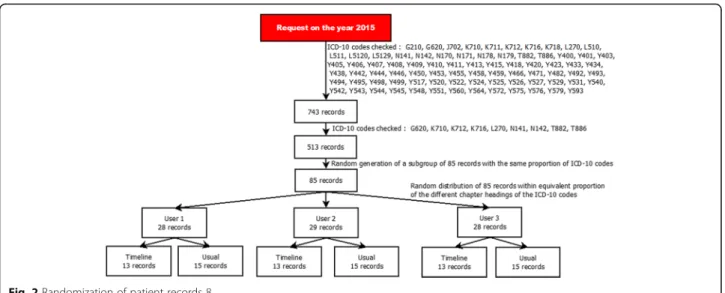
For the quantitative impact study, 743 potential cases from the 2015 eHOP data were selected according to a list of ICD-10 codes that were potentially related to ADR and the method described by Osmont et al. [28]. This list was defined in a previous internal study of the Pharmacovigilance Centre based on 2014 data. Only ICD-10 codes with the highest probability of matching an ADR were selected (Fig.2). Then, 85 cases were ran-domly chosen, in order to have roughly the same pro-portion of the different ICD-10 codes for the three participants and for each analysis method (usual method versus timeline, see below). A Python script was used to randomize the cases among the three participants.
Procedure for impact quantification
These 85 cases were reviewed by three members of the Regional Pharmacovigilance Centre of Rennes using two methods: the “usual method” (EHRs and DxCare® software, see Additional files 2 and 3), and the “time-line” method (timeline prototype). Participants were provided with a list of patient records and instructions on which method to use for each record (Fig. 2). The working environment (operating system, computers, etc.) was the same as the one used at the Pharmacovigi-lance Centre. As in the routine pharmacovigiPharmacovigi-lance practice, they had to gather information to establish a possible causality link between the diagnosis and the administration of a drug. They also wrote down the start time and end time for processing each file. The process was considered finished when the participant had retrieved all the required information or when he/ she considered that this information was not present or could not be found with the used method.
After reviewing a case, participants filled in a home-made questionnaire detailing the following information: complexity of the case, information about the ADR, which functions of the timeline were used, and general comments.
The report quality was measured using a method based on the WHO vigiGrade Completeness score that includes quality indicators, such as the drug name or description of the ADR (see Additional file4). Furthermore, absence of
information affected the resulting score. A member of the Pharmacovigilance Centre not involved in the timeline testing did the scoring.
All analyses were conducted on the 85 cases, but for the vigiGrade Completeness score comparison that con-cerned only the cases considered to be ADR by the par-ticipants. Time differences between methods were also compared according to the participants and according to the chapter of the ICD-10 codes.
Statistical analyses
Quantitative variables were expressed as mean and standard deviation. Continuous variables were compared using the Student’s t test or Wilcoxon rank-sum test, as appropriate, for two groups, and with the Kruskal-Wallis test for more than two groups. P values < 0.05 were con-sidered significant. Analyses were performed with the R statistical software, version 3.2.2. [29]
Results
Usability evaluation
The participants’ average SUS score was 82.5 out of 100 points. After responding to the questionnaire, all partici-pants expressed the desire to use the timeline in their daily practice.
All participants could successfully perform the tasks required for the use case. The use case completion time varied greatly among participants (mean completion time = 24.44 ± 9.97 min). The click count also was vari-able among participants (mean number of clicks: 174 ± 92.41, P = 0.06).
The error distribution in handling the interface did not vary much among participants (mean num-ber of errors: 1.33 ± 1.5). The task to gather infor-mation on the ADR outcome had the highest error count (P = 0.16).
Table 1 lists the usability issues encountered by participants during the test. The severity of each
Fig. 2 Randomization of patient records 8
Table 1 Usability issues
Problem Source of the problem Problem frequency
Nielsen scale score
Observations Zoom increase/decrease functionality
deemed
insufficiently accurate by participants
User Interface (UI) 6/6 (100%) 3/4 The Timeline overview does not allow accurate zooming to select the detailed view range Absence of prescription data Data source 6/6 (100%) 3/4 Prescriptions were not digitized in the Intensive
Care Unit Text highlighting did not work during
the search
UI 1/6 (17%) 3/4 Issues with accent detection
Medication regimens were not displayed UI 6/6 (100%) 3/4 Data on medication regimens were not available Hierarchical tree of biological concepts:
navigation problems
Complexity of the terminology in the UI
3/6 (50%) 2/4 The hierarchical tree of laboratory results was too large to allow users to easily find information without filtering
Repositioning document windows UI bug 2/6 (34%) 2/4 The window slid under the menu bar
usability problem was evaluated with the Nielsen rating scale [24] .
Corrections / adjustments of the application
The usability assessment allowed users to make recom-mendations for improving the user interface. These rec-ommendations have led us to adding new features designed specifically for pharmacovigilance, such as the option to automatically extract the drug names from textual documents and the ability to access, directly from the timeline, a module for visualizing the drug monography.
Evaluation of the application quantitative impact on the routine practice
Three participants (two pharmacists and one physician) were recruited for this evaluation. All were also involved in the usability study.
Overall, the time required for task completion was com-parable between methods (16′ 29″ and 15′ 51″ for the usual method and the timeline, respectively; P = 0.38) (Fig.3).
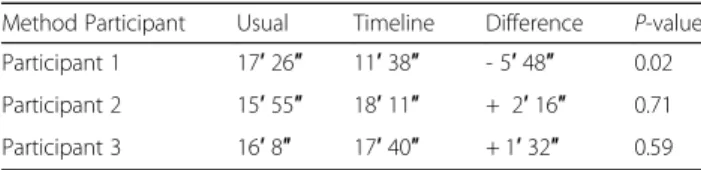
Comparison among the three participants, showed that for user 1, completion time was significantly lower with the timeline than with the usual method (P = 0.02). No difference between methods was observed for the other two participants (Table2and Fig.4).
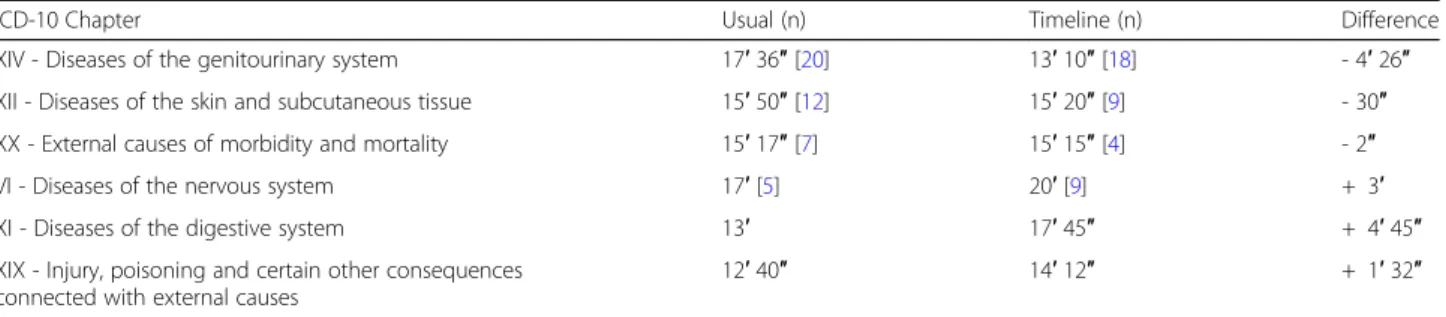
Finally, the completion time was compared between methods and the type of ICD-10 chapter (Table 3). Although not significantly different, completion time tended to slightly faster with the timeline method than
the usual method only for cases concerning genitouri-nary system diseases (P = 0.08). This difference could be explained by the systematic need to consult the patient’s laboratory results to judge the drug involvement in this type of ADR.
Among the 85 selected cases, 68 corresponded to actual ADR. Therefore, data quality was assessed and compared only for these records using the vigiGrade Completeness score. Overall, the average quality of the notifications (re-port for each adverse event) produced with the two methods was not significantly different (P = 0.49). Similar results were obtained also when comparing the notifica-tion quality among the three participants (Table4).
Participants’ feedback
During the interviews participants expressed the wish to use the timeline in their routine practice. The most ap-preciated features were the search functionality in the text and prescription display. The interviews also highlighted some negative points: problems in choosing the range of time of the timeline and difficulties in selecting the elements to display in the timeline. More-over, the participants wished to see the drug regimens in addition to the prescriptions.
After the evaluation of the timeline impact on the pharmacovigilance practice, participants reiterated their interest in obtaining the application for use in their daily practice. They stated that the timeline allowed them to save time in all cases that required consulting laboratory results. Moreover, they added that the possibility to display data prescription and information on drug
administration in a chronological format was a consider-able advantage.
Discussion
Usability evaluation
The results of the timeline usability test were almost excel-lent, as indicated by the SUS score (82.5) and users’ feed-back. The SUS questionnaire score indicates a good usability level. This score places the timeline in the 10% of applica-tions with usability scores higher than 80%, [30] and is higher than that of the KNAVE-II tool (69.1) [31]. The re-ported usability problems were, in general, minor defects that could be rapidly corrected. Moreover, based on the users’ feedback, new functionalities were introduced to bet-ter meet the needs of pharmacovigilance users. The signifi-cantly higher number of errors during the task of searching the ADR outcome can be explained by the high complexity of this task (search involving laboratory results, reading several documents simultaneously, etc.). Differences in com-pletion times can be explained by differences in each partici-pant’s working method. Some participants carried out their tasks in parallel, while others performed them one after the other. This explanation also applies to the difference in the
number of clicks, because some participants had to search for the same information more than once.
Evaluation of the application quantitative impact on the routine practice
The evaluation of the timeline quantitative impact on the routine practice showed a significant gain of time for one of the participants. This user was the one who participated the most in the development of the application and had the least experience with the usual method, compared with the others. This observation suggests that the gain of time could have been more general with a longer preliminary training session to better familiarize all participants with the timeline functionalities. Moreover, as the timeline was compared to the method that has been used in the Phar-macovigilance Centre for more than 10 years, the overall absence of time-saving supports the need for a new evalu-ation after participants have become more accustomed to the timeline tool, especially because the users wanted to be able to continue using the timeline after the evaluation.
Overall, for simple cases for which retrieving the rec-ord of the hospital stay is sufficient, the timeline added value is less apparent.
Finally, the absence of any significant difference in the quality of reporting shows that the exclusive use of the timeline is not a limiting factor for data collection. More-over, for some cases processed using the timeline, the poor quality of reporting could be explained by the presence of only textual documents in the application. This lack of data was not related to the timeline itself, but to the few data available in the data warehouse.
Fig. 4 Box-plot displaying the time spent per case in function of the method and participant 12
Table 2 Average time spent per case in function of the method and the participant
Method Participant Usual Timeline Difference P-value Participant 1 17′ 26″ 11′ 38″ - 5′ 48″ 0.02 Participant 2 15′ 55″ 18′ 11″ + 2′ 16″ 0.71 Participant 3 16′ 8″ 17′ 40″ + 1′ 32″ 0.59
Future versions
On the basis of the results and feedback obtained in this study, we are planning to introduce new features in the next version of the application. Particularly, we will focus on better displaying textual records, which is the starting point for locating information within patient re-cords. Also, it will be possible to more easily compare the contents of a document with the structured data dis-played in the timeline.
Limits of the study
During the usability test, breaking down the use case into tasks caused issues in the analysis of the MORAE records. Indeed, these tasks did not occur sequentially, but in paral-lel because in pharmacovigilance the investigation process does not follow a single critical path. In addition, for the same task, participants did not search the same level of details. Some participants wanted very specific and detailed information (e.g., the half-life of the molecule administered to the patient), and therefore they re-quired more time to complete their tasks. Conversely, other participants simply used the information con-tained in the text document retrieved by the query. It is, therefore, difficult to attribute the time differences observed during the execution of different tasks to an application usability problem.
For the impact study, only three participants were available, due to the limited human and material re-sources at our disposal, and therefore, it was not possible to process the same record twice using the two methods. A more thorough comparison between methods would require greater test power.
Conclusion
The complexity and richness of data found in medical records require the development of tools for their ef-ficient exploitation. Among the required features, viewing and querying information within a file remain critical elements. As part of the RAVEL project, we developed an integrated method for searching and visualizing information, in a timeline format. This art-icle details the evaluation of this timeline. The results of the usability test indicate a good general level of usability, and new features adapted to pharmacovigi-lance routine practice could be added on the partici-pants’ request. The timeline is now available to people in charge of pharmacovigilance for their daily practice.
Availability and requirements
Project name: RAVEL Timeline.
Project home page: e.g.http://devtools.univ-rennes1.fr/ websvn/Timeline/
Operating system(s): Platform independent.
Programming language: Java 8, HTML 5, CSS 3, JavaScript.
Other requirements: Java 8 or higher, Oracle 11 g or higher.
License: GNU GPL.
Any restrictions to use by non-academics: For use by non-academics, please contact Pr Marc Cuggia: [email protected]
Additional files
Additional file 1:Timeline interface (original French version). The interface individual components are: 1. Selection of patient, laboratory and clinical data and medical codes (e.g., ICD-10 code). 2. Time scale. 3. Laboratory results in the form of graphic curves (green dots are normal values, triangles and their orientation correspond to anomalous values). 4. Drug prescriptions and treatment duration (start, end and overall duration) as well as the drug regimen. 5. Timeline overview for navigation. 6. Overall time period selection. (PNG 140 kb)
Additional file 2:Portfolio interface (in French) (PNG 392 kb)
Additional file 3:Portfolio mock-up (PNG 63 kb)
Additional file 4:Dimensions included in the vigiGrade Completeness score and the corresponding penalties. (PNG 153 kb)
Table 4 Mean notification quality according to the method and the user
Participant Average quality, usual method Average quality, timeline Overall average quality Participant no. 1 0.87 0.81 0.84 Participant no. 2 0.81 0.85 0.84 Participant no. 3 0.81 0.74 0.78 Total 0.83 0.80 0.81
Table 3 Average time spent per case in function of the method and ICD-10 chapter
ICD-10 Chapter Usual (n) Timeline (n) Difference
XIV - Diseases of the genitourinary system 17′ 36″ [20] 13′ 10″ [18] - 4′ 26″ XII - Diseases of the skin and subcutaneous tissue 15′ 50″ [12] 15′ 20″ [9] - 30″ XX - External causes of morbidity and mortality 15′ 17″ [7] 15′ 15″ [4] - 2″
VI - Diseases of the nervous system 17′ [5] 20′ [9] + 3′
XI - Diseases of the digestive system 13′ 17′ 45″ + 4′ 45″
XIX - Injury, poisoning and certain other consequences connected with external causes
Abbreviations
ADR:Adverse drug reaction; ATC: Anatomical therapeutic chemical terminology; CCAM: French classification, for the medical diagnostic or therapeutic procedures (Classification Commune des actes médicaux); eHOP: Biomedical Data Warehouse of Hospital (Entrepôt de données biomédicales de l’HOPital); EHR: Electronic health record; ETL: Extract transform load; GUI: Graphical user interface; HMI: Human-machine interface; ICD-10: International classification of diseases, 10th edition; PEPS: Pharmaco-epidemiology health products (Pharmaco-Epidémiologie des Produits de Santé); RAVEL: Retrieval and visualization in electronic health records; SUS: System usability scale; UI: User interface; VCM: Visualization of medical knowledge (Visualisation des Connaissances Médicales); WHO: World Health Organization Acknowledgements
We thank Dr. Catherine Plaisant, Associate Director of Research of the Human-Computer Interaction Laboratory for her advices in the methodological choices and her attentive reading of the manuscript. We also thank Dr. Elisabetta Andermarcher for her careful proofreading of the paper. We also thank Dr. Jean-Baptiste Lamy for agreeing to provide us the VCM language. Funding
This work was supported by the French National Research Agency (ANR) (Project ID: ANR-11-TECS-0012) and the PEPS consortium (Pharmaco-Epidemiology of Health Products consortium).
Availability of data and materials
Data on the demo and screenshot are dummy data. Data used for the evaluation came from our clinical data warehouse, eHOP. [3] The main author works at the Clinical Data Centre of Rennes CHU and it is within this framework that he had access to these data.
Consent to publish Not applicable. Authors’ contributions
TL, ER, and PVH developed and implemented the prototype of the timeline. TL, GB, KB and MC defined the study methodology. TL, FT, KB and EP brought their expertise in the design of the timeline prototype. All authors read and approved the final manuscript. All authors reviewed, corrected, and approved the final version of the manuscript. All authors agreed to be accountable for all aspects of the work in ensuring that questions related to the accuracy or integrity of any part of the work are appropriately investigated and resolved.
Ethics approval and consent to participate
The study was approved by Rennes University Hospital Ethics Committee (approval number 15.58). In accordance with the opinion of the above-mentioned Ethics Committee and given the fact that no information about participants is provided in this paper, participants who participated in usability studies gave verbal consent to participate in this research. Competing interests
The authors declare that they have no competing interests.
Publisher’s Note
Springer Nature remains neutral with regard to jurisdictional claims in published maps and institutional affiliations.
Author details
1
INSERM, U1099, F-35000 Rennes, France.2Université de Rennes 1, LTSI, F-35000 Rennes, France.3CHU Rennes, F-35000 Rennes, France.4ERIAS,
INSERM U897, ISPED, Université Bordeaux, Bordeaux, France.5Centre Régional
de Pharmacovigilance, CHU Pontchaillou, Rennes, France.
Received: 22 September 2017 Accepted: 1 October 2018
References
1. WHO | Pharmacovigilance [Internet]. [cited 2017 Aug 21]. Available from:
http://www.who.int/medicines/areas/quality_safety/safety_efficacy/ pharmvigi/en/
2. Murphy SN, Weber G, Mendis M, Gainer V, Chueh HC, Churchill S, et al. Serving the enterprise and beyond with informatics for integrating biology and the bedside (i2b2). J Am Med Inform Assoc. 2010;17(2):124–30. 3. Cuggia M, Garcelon N, Campillo-Gimenez B, Bernicot T, Laurent J-F, Garin E,
et al. Roogle: an information retrieval engine for clinical data warehouse. Stud Health Technol Inform. 2011;169:584–8.
4. Cuggia M, Campillo-Gimenez B, Bouzille G, Besana P, Jouini W, Dufour J-C, et al. Automatic selection of clinical trials based on a semantic web approach. Stud Health Technol Inform. 2015;216:564–8.
5. Osmont M-N, Campillo-Gimenez B, Metayer L, Jantzem H, Rochefort-Morel C, Cuggia M, et al. Peranesthesic anaphylactic shocks: contribution of a clinical data warehouse. Therapie. 2015. p. 16. Available from:https://www. sciencedirect.com/science/article/pii/S0040595716311350.
6. Polard E, Nowak E, Happe A, Biraben A, Oger E. For the GENEPI study group. Brand name to generic substitution of antiepileptic drugs does not lead to seizure-related hospitalization: a population-based case-crossover study. Pharmacoepidemiol Drug Saf. 2015;24(11):1161–9.
7. Plaisant C, Mushlin R, Snyder A, Li J, Heller D, Shneiderman B. LifeLines: using visualization to enhance navigation and analysis of patient records. Proc AMIA Symp. 1998. p. 76–80. Available from:https://www.ncbi.nlm.nih. gov/pmc/articles/PMC2232192/.
8. Gotz D, Wang F, Perer A. A methodology for interactive mining and visual analysis of clinical event patterns using electronic health record data. J Biomed Inform. 2014;48:148–59.
9. Alexander Rind SM. VisuExplore: gaining new medical insights from visual exploration. 2010;
10. Monroe M, Meyer TE, Plaisant C, Lan R, Wongsuphasawat K, Coster TS, et al. Visualizing patterns of drug prescriptions with EventFlow: a pilot study of asthma medications in the military health system. 2013
11. Gschwandtner T, Aigner W, Kaiser K, Miksch S, Seyfang A. CareCruiser: Exploring and visualizing plans, events, and effects interactively. In: Visualization Symposium (PacificVis), 2011 IEEE Pacific; 2011. p. 43–50. 12. Shahar Y, Goren-Bar D, Boaz D, Tahan G. Distributed, intelligent, interactive
visualization and exploration of time-oriented clinical data and their abstractions. Artif Intell Med. 2006;38(2):115–35.
13. Thiessard F, Mougin F, Diallo G, Jouhet V, Cossin S, Garcelon N, et al. RAVEL: retrieval and visualization in ELectronic health records. Stud Health Technol Inform. 2012;180:194–8.
14. Bostock M. D3.js - Data-Driven Documents [Internet]. [cited 2017 Aug 21]. Available from:https://d3js.org/
15. Lamy J-B, Duclos C, Hamek S, Beuscart-Zéphir M-C, Kerdelhué G, Darmoni S, et al. Towards iconic language for patient records, drug monographs, guidelines and medical search engines. Stud Health Technol Inform. 2010;160(Pt 1):156–60. 16. Nielsen J. Why you only need to test with 5 users [Internet]. 2000 [cited
2017 Aug 21]. Available from: https://www.nngroup.com/articles/why-you-only-need-to-test-with-5-users/
17. Rubin J, Chisnell D. Handbook of usability testing: how to plan, design, and conduct effective tests. Indianapolis: Wiley; 2011. p. 353.
18. ISO 9241-11:1998(en), Ergonomic requirements for office work with visual display terminals (VDTs)— Part 11: Guidance on usability [Internet]. [cited 2017 Aug 21]. Available from:https://www.iso.org/obp/ui/#iso:std:iso:9241:-11:ed-1:v1:en
19. Nair KM, Malaeekeh R, Schabort I, Taenzer P, Radhakrishnan A, Guenter D. A clinical decision support system for chronic pain Management in Primary Care: usability testing and its relevance. J Innov Health Inform. 2015;22(3):329–32. 20. Kamal J, Rogers P, Saltz J, Mekhjian H. Information warehouse as a tool to analyze
computerized physician order entry order set utilization: opportunities for improvement. AMIA Annu Symp Proc AMIA Symp AMIA Symp. 2003. p. 336–40. Avaiblable from:https://www.ncbi.nlm.nih.gov/pmc/articles/PMC1480158/. 21. Neri PM, Pollard SE, Volk LA, Newmark LP, Varugheese M, Baxter S, et al.
Usability of a novel clinician interface for genetic results. J Biomed Inform. 2012 Oct;45(5):950–7.
22. Nielsen J. Usability engineering. San Francisco: Morgan Kaufmann Publishers Inc.; 1993.
23. Olmsted-Hawala EL, Murphy ED, Hawala S, Ashenfelter KT. Think-aloud protocols: a comparison of three think-aloud protocols for use in testing data-dissemination web sites for usability. In: Proceedings of the SIGCHI Conference on Human Factors in Computing Systems [Internet]. New York: ACM; 2010. p. 2381–90. [cited 2016 Jan 6]. (CHI‘10). Available from:http://doi.acm.org/10.1145/1753326.1753685. 24. Severity Ratings for Usability Problems: Article by Jakob Nielsen [Internet].
[cited 2017 Sep 18]. Available from: https://www.nngroup.com/articles/how-to-rate-the-severity-of-usability-problems/
25. Peute LWP, de Keizer NF, Jaspers MWM. The value of retrospective and concurrent think aloud in formative usability testing of a physician data query tool. J Biomed Inform. 2015 Jun;55:1–10.
26. Brooke J. SUS: a quick and dirty usability scale. 1996.
27. Lewis JR, Sauro J. The factor structure of the system usability scale. In: Proceedings of the 1st International Conference on Human Centered Design: Held As Part of HCI International 2009 [Internet]. Berlin: Springer-Verlag; 2009. p. 94–103. [cited 2016 Jan 6]. (HCD 09). Available from:https://doi.org/10.1007/978-3-642-02806-9_12.
28. Osmont M-N, Cuggia M, Polard E, Riou C, Balusson F, Oger E. Utilisation du PMSI pour la détection d’effets indésirables médicamenteux. Therapie. 2013 Jul 1;68(4):285–95.
29. R Development Core Team. R: a language and environment for statistical computing [internet]. Vienna: R Foundation for Statistical Computing; 2008. Available from:https://www.r-project.org/
30. Sauro J, Lewis JR. Chapter 8 - standardized usability questionnaires. In: Quantifying the user experience [internet]. Boston: Morgan Kaufmann; 2012. p. 185–240. Available from:http://www.sciencedirect.com/science/article/ pii/B9780123849687000084.
31. Martins SB, Shahar Y, Galperin M, Kaizer H, Goren-Bar D, McNaughton D, et al. Evaluation of KNAVE-II: a tool for intelligent query and exploration of patient data. Stud Health Technol Inform. 2004;107(Pt 1):648–52.