Publisher’s version / Version de l'éditeur:
Journal of Glaciology, 26, 94, pp. 43-52, 1980
READ THESE TERMS AND CONDITIONS CAREFULLY BEFORE USING THIS WEBSITE. https://nrc-publications.canada.ca/eng/copyright
Vous avez des questions? Nous pouvons vous aider. Pour communiquer directement avec un auteur, consultez la première page de la revue dans laquelle son article a été publié afin de trouver ses coordonnées. Si vous n’arrivez pas à les repérer, communiquez avec nous à [email protected].
Questions? Contact the NRC Publications Archive team at
[email protected]. If you wish to email the authors directly, please see the first page of the publication for their contact information.
NRC Publications Archive
Archives des publications du CNRC
This publication could be one of several versions: author’s original, accepted manuscript or the publisher’s version. / La version de cette publication peut être l’une des suivantes : la version prépublication de l’auteur, la version acceptée du manuscrit ou la version de l’éditeur.
Access and use of this website and the material on it are subject to the Terms and Conditions set forth at
Frequency of major avalanche winters
Fitzharris, B. B.; Schaerer, P. A.
https://publications-cnrc.canada.ca/fra/droits
L’accès à ce site Web et l’utilisation de son contenu sont assujettis aux conditions présentées dans le site LISEZ CES CONDITIONS ATTENTIVEMENT AVANT D’UTILISER CE SITE WEB.
NRC Publications Record / Notice d'Archives des publications de CNRC:
https://nrc-publications.canada.ca/eng/view/object/?id=2c4b3f2d-c0ad-4a14-952c-c6207d4be878 https://publications-cnrc.canada.ca/fra/voir/objet/?id=2c4b3f2d-c0ad-4a14-952c-c6207d4be878National Research
Conseil national
s
er
I
*
Council Canada
de recherches Canada
TH1
no.
982
c .
2
-
BLDG - - LFREQUENCY OF MAJOR AVALANCHE WINTERS
by B.B. Fitzharris and
P.A.
Schaerer
Reprinted from
Journal of Glaciology
Vol.
26,No. 94,
1980p.
43
* 52DBR Paper No. 982
This publication is being d i s t r i b u t e d by the Division of Building R e s e a r c h of the National R e s e a r c h Council of Canada. I t should not h e r e p r o d u c e d in whole o r in p a r t without p e r m i s s i o n of the original publisher. The Di- vision would be glad t o be of a s s i s t a n c e i n obtaining s u c h p e r m i s s i o n .
Publications of the Division m a y b e obtained by m a i l - ing the a p p r o p r i a t e r e m i t t a n c e ( a Bank, E x p r e s s , o r P o s t Office Money O r d e r , o r a cheque, m a d e payable t o the R e c e i v e r G e n e r a l of Canada, c r e d i t NRC) t o the National R e s e a r c h Council of Canada, Ottawa. K1A OR6. Stamps a r e not acceptable.
A l i s t of a l l publications of the Division i s available and m a y b e obtained f r o m the Publications Section, Division of Building R e s e a r c h , National R e s e a r c h Council of Canada, Ottawa. KIA OR6.
Journal ofClociola~, Vol. 26, No. gq, 1980
F R E Q U E N C Y O F MAJOR A V A L A N C H E W I N T E R S
By B. B. FITZHARRIS(Department of Geography, University of Otago, P.O. Box 56, Dunedin, New Zealand)
and P. A. SCHAERER
(Division of Building Research, National Research Council of Canada, 3904 West 4th Avenue, Vancouver, British Columbia V6R I P5, Canada)
ABSTRACT. A 70-year record has been compiled for avalanches affecting the Canadian Pacific Railway at Rogers Pass, British Columbia. Time series are presented for avalanche frequency, avalanche mass, and length of avalanche debris on the rail line for 26 avalanche paths as well as for winter snow-fall. Winters with the heaviest avalanche activity were 197 1-72, I 934-35, I 919-20, 1932-33, and 1953-54. Time-series analysis indicates that the size of avalanches has decreased in recent decades. Spectral analysis shows avalanche activity to be similar to white noise but with a weak periodicity of about 18 years. An examination of the climatology of big avalanche winters reveals two distinct circulation patterns: a strong zonal flow with frequent Pacific storms and heavy snow-fall; or a pronounced meridional flow, Arctic air outbreaks, and catastrophic avalanching released by rapid advection of warm moist Pacific air. Major avalanche winters need not be big snow-fall winters.
R B s u ~ b . Fri'quence des hivers les plus propices a m avalanches. Les auteurs ont compilt les donnCes recueillies depuis 70 ans concernant les avalanches ayant eu un effet sur la voie ferrte du Canadien Pacifique au col de Rogers en Colombie-Britannique. 11s prtsentent des stries chronologiques pour la frCquence des avalanches, la masse des avalanches, la longueur de dtbris laissCs par l'avalanche sur la voie ferrte pour 26 couloirs d'avalanche et les prCcipitations de neige en hiver. L'activitt des avalanches a t t t la plus considtrable au cours des hivers 1971-72, 1934-35, 1919-20, 1932-33 et 1953-54. L'analyse des series chronologiques indique que la taille des avalanches a diminuC au cours des dernikres dtcennies. L'analyse spectrale montre que l'activitt des avalanches est similaire au bruit blanc, mais avec une faible pCriodicitt d'environ 18 ans. Une ttude de la climatologie des anntes propices aux fortes avalanches montre deux schCmas de circulation: une forte circulation zonale avec de frtquentes tempetes en provenance du Pacifique et des chutes de neige abondantes; ou une circulation mtridionale prononde, des pousstes d'air de 1'Arctique et des avalanches catastrophiques dCclenchCes par l'advection rapide d'air chaud et humide du Pacifique. Les hivers les plus propices aux avalanches ne sont pas ntcessairement les hivers avec les prtcipitations de neige les plus importantes.
ZUSAMMENFASSUNG. Hiiujgkeit von Wintern rnit starker Lawinentiitigkeit. Uber Lawinen, die auf die
Kanadisch-Pazifische Eisenbahn a m Rogers Pass, British Columbia, niedergingen, wurde eine Aufstellung iiber 70 Jahre angefertigt. Die Zeitserien beziehen sich auf die Haufigkeit und Masse von Lawinen, auf die Lange des Lawinenschuttes auf der Bahnlinie fiir 26 Lawinenbahnen sowie auf den winterlichen Schneefall. Die Winter rnit der starksten Lawinentatigkeit waren 1971-72, 1934-35, 1919-20, 1932-33 und 1953-54. Die Analyse der Zeitreihen zeigt, dass die Lawinengrosse in den letzten Jahrzehnten abgenommen hat. Die Spektralanalyse erweist eine Ahnlichkeit der Lawinentatigkeit mit weissem Rauschen, jedoch mit einer schwachen Periodizitat von etwa 18 Jahren. Eine klimatologische Untersuchung der Winter mit starker Lawinentatigkeit lasst zwei verschiedene Zirkulationsmuster erkennen: eine starke zonale Stromung mit haufigen pazifischen Sturmen und heftigem Schneefall, oder eine ausgesprochen meridionale Stromung mit Ausbriichen arktischer Luftmassen und katastrophenartigen Lawinenabgangen, hervorgerufen durch die schnelle Advektion warm-feuchter pazifischer Luft. Winter mit starker Lawinentatigkeit mussen nicht besonders schneereich sein.
I n avalanche zoning problems estimates of the hazard are usually made using a statistical analysis of past avalanche activity. Questions that can arise in this connection include: Has avalanche activity changed with time? What atmospheric circulation patterns and weather systems have produced major historical avalanche events? Are there periodicities or rhythms in avdanche activity that would be of value for prediction? T o examine these questions a 70-year avalanche record was constructed for Rogers Pass in the Selkirk Mountains of British Columbia, Canada, where avalanches affecting the Canadian Pacific Railway have been recorded since the winter of 1909-10. The characteristics of the avalanche paths a t Rogers Pass h,ave been summarized in other papers (Schaerer, 1972, [1975]).
44 J O U R N A L O F G L A C I O L O G Y
Data of avalanches affecting the railway line were compiled from various sources. The oldest records were reports of the road masters of the Canadian Pacific Railway covering the years 1909-53 In 1953 the Canada Department of Public Works initiated avalanche observa- tions in the area in connection with the construction of the Trans-Canada Highway and these observations were continued by Parks Canada after completion of the highway. The National Research Council of Canada began a study of the mass of snow contained in avalanches in 1966. I n addition, earlier reports of avalanche activity were available from old journals and newspapers, but a continuous record could not be constructed from them.
Each source has recorded the occurrence and size of avalanches differently. As the railway data cover the longest period, 1909 to 1953, and indicate only large avalanches that have clearly run to and beyond the rail line, they were regarded as the standard. Equivalent data were selected from the other sources to continue the record to 1979. After examination of all data, it was possible to establish a consistent, homogeneous record for 26 avalanche paths that affected the railway line on a section 24 km long between 1909 and 1979. The characteristics of the avalanche paths are listed in Table I.
Three different measures were selected to represent the record:
I . The number of avalanches to affect the railway in each winter for the period 1909-79, ZF.
2. The estimated total mass of the above avalanches for each winter for the period 1918-79, EM.
3. The length of the railway track covered by avalanche snow for each winter for the period 191 8-79, EL.
TABLE I. CHARACTERISTICS OF AVALANCHE PATHS UNDER STUDY
Largest avalanche Relative runout Limit Number of observed Mean slope Mean slope Maximum run-out distance to avalanche avalanches
Avalanche path of track run-out zone distance D m railway Dr/Dm M o 1909-79 Year Mass M
deg deg m 106 kg 106 kg
Connaught 32 15 5 6 ~ 0.16 I 136 23 1920 312
Unnamed No. 6 33 6 305 0.89 250 2 1934 3
Stone Arch 37 8 215 0.77 164 6 I979 52
Abbott Observatory 34 I I 320 0.63 10 1965 36 Abbott 3 34 12 I 65 0.52
d
10 1949 23 Abbott 4 32 14 90 0.67 I 16 Cheops South I 5 1920 I9 35 I 2 290 0.79 371 4 1933 68Couger Creek East 38 8 380 0.47 447 7 1952 I O I
Couger Creek West 38 8 495 0.91 1 299 3 1935 41
Couger Corner 6 43 5 90 0.72 56 6 1972 7 Couger Corner 3 42 I I '50 0.97 83 I 1952 0.8 Couger Corner 2 42 15 270 0.80 281 Ross Peak 32 7 530 0.80 5 197' 12 Railroad Gunners 28 4 200 0.70 3 161 1 387 25 6 1946 404 1923 15 Smart East 40 7 360 0.89 288
Smart West 40 5 190 0.40 272 6 4 I933 1933112 39
Fidelity 28 I I 535 0.92 CPR Sheds 18 1 407 3 '959'80 Park One 35 38 -8 205 75 0.33 0.44 I 122 58 7 '972 5 Fortitude 22 15 r 050 0.94 11 640 6 I933 229 Laurie 33 -8 305 0.07 I '935 83 Lanark 30 9 610 0.90 5 242 865 23 6 1954 I53 1951 207 Twins 36 - 16 1°5 0.71 700 11 1935 60
Jack MacDonald 28 8 535 0.68 2 goo
Helen 30 3 250 0.92 I 658 9 '937 306
F R E Q U E N C Y O F M A J O R A V A L A N C H E W I N T E R S 45
2. I . &umber of avalanches
Early data of the railway company record dates, locations, length, and depth of avalanche deposits on the line. More recent records of the National Research Council and of Parks Canada also note whether avalanches reached the rail line, but data are poor for the period f 1952-65.
2.2.
Mars
of avalanchesThe National Research Council measured or estimated the location of the avalanche terminus, the length, width, depth, and density of the deposit, and calculated from this information the mass of the avalanche.
The Parks Canada data give the avalanche terminus in terms of its position on the usual run-out zone or with respect to the Trans-Canada Highway, and when avalanches reached the highway give the depth of deposit on the roadway and the length of road affected. Because both the railway and Parks Canada records give the length of rail line or highway L covered by avalanche snow and its depth
5
a characteristic cross-section A of the avalanche could be calculated fromA = LZ.
The length of the avalanche deposit was equated to the likely run-out distance D which took into account the characteristic cross-section of the avalanche snow, terrain of run-out zone, and description of avalanche. The beginning of the run-out zone was identified with the help of people with local knowledge and usually occurred where the slope decreased to 1 6 deg. For very large events it was assumed that avalanches ran close to the maximum run-out distance Dm (Table I ) indicated by the trimlines of vegetation.
The mass M of the avalanche deposit was estimated by one of the following methods: (a) for unconfined avalanche paths with uniform, open slopes in the run-out zone
M = PAD,
(b) for confined avalanche paths emerging from a gully on a fan, the deposit is often triangular in plan, so that
(c) for avalanches that crossed the river and moved up the opposite side of the valley (for example, the Twins path) it was assumed that
M = o.8pADY
(d) for some avalanche paths such as Fidelity it was obvious that only the very tip of a large avalanche had cut the railway line, and the characteristic cross-sectional area was not a good one; in these cases A was calculated by replacing L with the average width of the run-out zone.
p in the above formulae is the density of the deposited avalanche snow and varies with the free-water content and size of the avalanche. Guidelines for estimating average values of p were available based on National Research Council observations.
In 14% of the avalanche occurrences the only information on size was a qualitative description such as "similar size to last winter" or "two hours to clear debris". I n such cases a rough estimate was made by comparison with avalanches of known size on the same path. No information was available as to size in 9% of the avalanches and it was assumed that they were medium size with M = 0.01 Mo, where Mo is the mass of the limit avalanche. T h e limit
avalanche is defined as (Schaerer, [1g75])
46 J O U R N A L O F G L A C I O L O G Y
where S is the go-year maximum water equivalent of snow irs the starting zone, R is the retention of snow due to roughness of ground, and A, is the area of the starting zone. 2.3. Length of railway line covered by avalanche de~osits
The length of track covered by avalanches during one winter, summed for the 26 selected avalanche paths, was used as an index of activity. Values were olqtained directly from railway records or the other listed sources. Z
I
2.4. Climatological data t
Daily records of snow-fall, rain-fall, and maximum and miniinum temperature at Rogers Pass extend back almost continuously to 1896, but the observation site was moved several times so that snow-fall values were standardized by comparison with hther nearby stations. Daily hemisphere surface synoptic charts were available from 1909 to the present from the Canadian Atmospheric Environment Service.
2.5. Quality of data 2
The avalanche records for numbers F, mass M, and ldngth of track covered L, may contain trends and discontinuities owing to factors other than climatic variations; for example, changes of vegetation and control by artillery have occurred on 15 of the paths since 1965. Further- more, errors of observation and interpretation may occur.
The most reliable measures of activity are considered to be thbse for number of avalanches and length of track covered. The series for the mass of avalanche snow involves numerous assumptions, but because such long-term series have not been available before they are worth reporting. Furthermore, estimates of mass allow magnitudqfrequency relations to be determined.
2.6. Nature of avalanche data sample
Avalanches from large starting zones do not necessarily reach the railway line more frequently than those from smaller zones. Frequency and size of avalanches reaching the line depend also on the location of the line with r e s ~ e c t to the run-out distance of the avalanche. Relative run-out distances, which are the ratio of the run-out distance to the railway Dr and the maximum run-out distance Dm as observed from vegetation patterns, are given in Table I.
The time series for XF. EM. and XL fall into the class of non-annual exceedence series. As a n avalanche must be large enough to cross the railway line to be mcorded, such an event need not occur every year. The minimum size of avalanche required to cross the line is the base value for that path. Thus the series do not give annual maxima bui provide non-annual maximum series for each path. Furthermore, the base value is not, the same for each path selected and may even differ on each path for wet and dry avalanches. For paths with large D r / D m base values, the non-annual excedence series represents the extreme tail of'the population frequency distribution. For paths with small D r / D m base values much moraof the frequency distribution is available.
3. FREQUENCY OF MAJOR AVALANCHE WINTERS
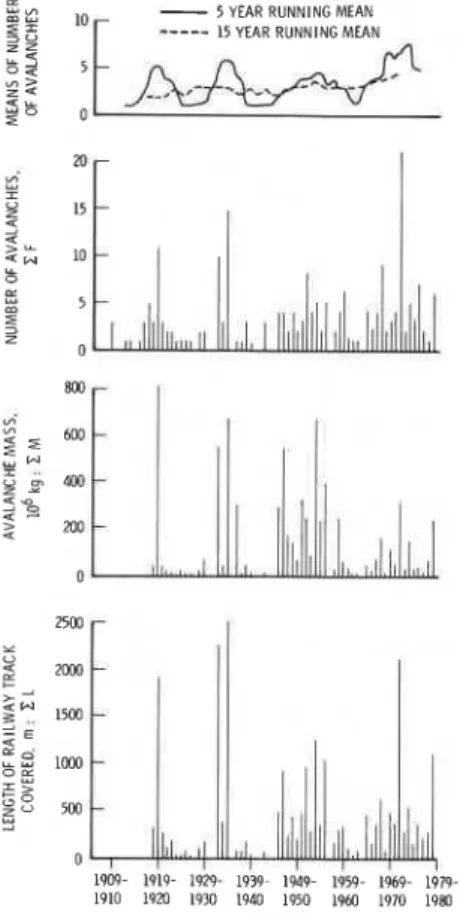
Constructed records for XF, EM, and XL are given
in
Figure I . The records for X F show long periods of low to moderate avalanche frequency separated by peaks of very much higher frequency during the winters of 191 9-20, 1932-33, 1934-35, 1067-68, and 197 1-72. This pattern, in which extreme winters have considerably more ava nche activity than average, also appears in the frequency records of Loup and Lovie from the Tarentaise and in those of Chishima (1976) from Japan. 1F R E Q U E N C Y O F M A J O R A V A L A N C H E W I N T E R S
1 9 ~ - 1919- 1929- 19'39- 1949- 1959- 1969- 1979 1910 1920 1930 1940 1950 19tO 1970 1980
WINTER
Fig. I . Number of avalanches, total mass of avalanches, and length of track covered per winter.
The record for C M displays characteristics similar to those for CF, but with more peaks (Fig. I). There is also a different ranking of heavy avalanche years, mainly owing to the variation in size of the starting zones of the 26 avalanche paths selected. A single avalanche on a large path, such as Ross Peak, can contain more mass than 10 or so avalanches on the small
paths, for example, Couger Corner 3 and Couger Corner 6. Thus the winter of 1936-37 ranks eighth on the list of CM, although only one avalanche (with an exceptionally large mass, at the Jack McDonald path) reached the railway line. Conversely, C M for the winter of 1971-72 was much lower than that for other winters with high CF. I n 1919-20 large avalanches ran on several paths, to give maximum C M over the 61 years of records.
The maximum avalanche to occur on each path varies widely over the winters studied (Table I), but five paths produced their largest avalanches in 1932-33, four in 1934-35, and two in 1919-20 and 1971-72. Thus winters with a high frequency of avalanches produced relatively large avalanches on many, but not all, paths.
Despite the wide range of snow and weather conditions experienced over 61 winters, some paths failed to produce large avalanches in relation to their limit avalanche, suggesting that factors other than snow or weather also contribute to magnitude-frequency relations.
The record for CL is intermediate between that of CF and CM, with outstanding winters again in 1919-20, 1932-33, 1934-35, and 1971-72 (Fig. I ) . By taking into account both
48 J O U R N A L O F G L A C I O L O G Y
1977-72, 1934-359 1919-20, 1932-33, 7953-54, 1967-68, 1946-47, 1951-52, 1978-79, and '945-46.
The record of avalanche activity at Rogers Pass is incomplete prior to the winter 1909-10. Surveys of early journals, books, and newspapers suggest that avalanche activity was heavier than normal in the early 1880's and may have been extreme in one winter. Between 1888 and 1909 avalanche activity appears to have been normal or less than normal. There is no evidence during this period of extreme avalanche winters similar to those of the four most severe listed above. I t seems reasonable, therefore, to consider that these winters were the most severe since 1888.
Avalanche records were examined to identify periods of a few days when three or more avalanches affected the railway line. In all, 20 periods were recognized, mainly in January and
February, that contained nearly half of all avalanches. The most intense periods were in 1934-35 ( F = I I ) when the line had to be abandoned for a week, 1932-33 (F y IO), and
1919-20 ( F = 9). During these winters, avalanches within a few days made up all, or the
bulk of, the annual total. This suggests a pattern of critical storm conditions superimposed on a snow-pack made weak by prior winter weather. On the other hand, the winter of 1971-72 was characterized by avalanches throughout the season, with several periods of intense avalanche activity.
5. TRENDS AND PERIODICITIES IN AVALANCHE RECORDS
The 15-year running means for CF indicate no marked change in long-term avalanche frequency except for a slight upward trend in recent decades (Fig. I ) . This may reflect artillery control, more reliable observations, or changes in climate, but it is not large enough to be of significance. The five-year running means for XF suggest a periodic pattern of several winters of high avalanche frequency separated by periods of less activity. Despite the high frequency of avalanches in the last decade, there is a strong suggestion that their mass has decreased.
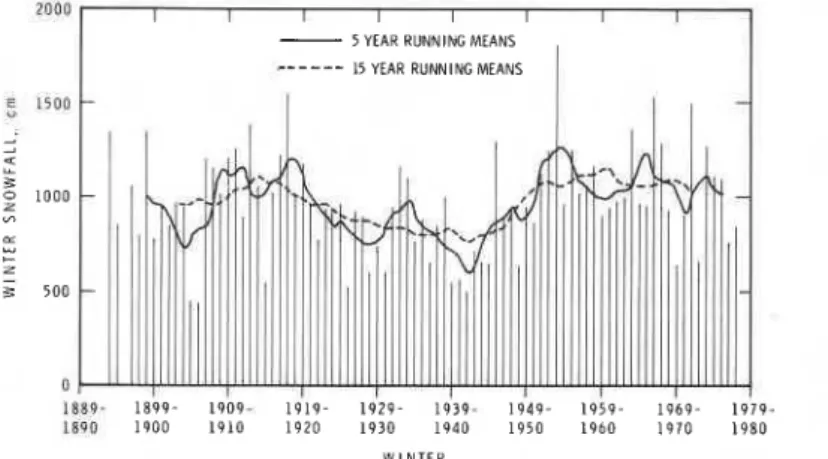
The 15-year running means for winter snow-fall at Rogers Pass also show no linear trend, but there is a suggestion of a broad peak from approximately r g r o to r 920, followed by a broad trough from 1935 to 1945 and a rise to another broad peak in recent years (Fig. 2). The five- year running means illustrate smaller-scale fluctuations superimposed on these long-term variations.
-
5 YEAR RUNNING MEANS---
15 YEAR RUNNING MEANS
I
1889. 1 8 9 9 - 1 9 0 9 - 1 9 1 9 - 1 9 2 9 - 1 9 3 9 - 1 9 4 9 - 1 9 5 9 - 1 9 6 9 - 1 9 7 9 - iZq0 1 9 0 0 1 9 1 0 1 9 2 0 1 9 3 0 1 9 4 0 1 9 5 0 1 9 6 0 1 9 7 0 1 9 8 0
W I N T E R
F R E Q U E N C Y O F M A J O R A V A L A N C H E W I N T E R S 49
T o investigate the frequency response of avalanche records a spectral analysis was applied to the time series of ZF, CM, CL, and to winter snow-fall using the Tukey-Manning method and the approach described by Jenkins and Watts ([C1968]). Correlograms and spectral- density estimates were calculated for each series. These are short series for spectral analysis, but must suffice in the absence of longer records, although caution is required in interpreting them since the addition of more data could markedly alter the results. Jenkins and Watts ([C1968]) noted that a short series with fewer than roo observations can provide acceptable estimates of a smooth spectrum, but that it is often too short to provide a n estimate of a spectrum containing a narrow peak. For the purpose of checking results a spectral analysis using the maximum-entropy method (Ulrych and Bishop, 1g75), which is more powerful for short-time series, was also used.
All correlograms were found to be similar to those for white noise, indicating that the avalanche data are produced by near-random events. All except the correlogram for winter snow-fall decay rapidly to near zero after one lag. Thus frequency and size of avalanches on the railway line are independent from one winter to the next. The correlogram for winter snow-fall decays less slowly, with a correlation coefficient between one winter and the next of 0.22, which is just significant at the 95% confidence level. This probably reflects a small amount of persistence in atmospheric circulation and weather patterns from one winter to the next.
Correlations at lag two of more than 0.25 for C M and CL suggest that a larger than normal avalanche year tends to be followed by another two years later. Beyond lag two the correla- tions for all series are small and not significant, so that inferences based on such information are suspect. It is worth noting, however, that between lag four and lag eleven correlations tend to be negative, indicating that large avalanche years are followed by small avalanche years for about a decade.
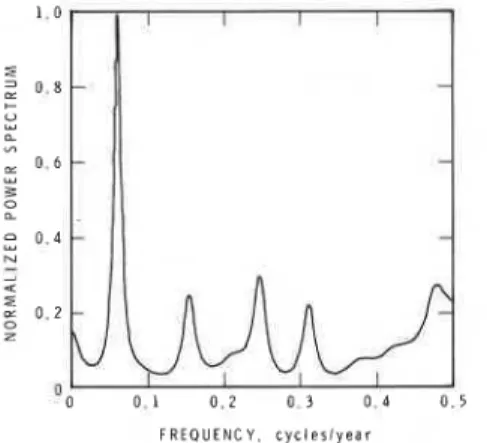
The power spectra for CF obtained by using the maximum-entropy method have the highest power at 0.06 cyclelyear, with lesser peaks at 0.15, 0.24, 0.31, and 0.47 cycle/year (Fig. 3). Thus, a periodicity of 18 years is suggested, with periodicities ofjust over two years and three to seven years also perhaps present although certainly not pronounced. As the spectra are not concentrated at a single frequency but spread over a wide range, the series are not truly periodic. I t should also be stressed that the suggestion of an 18-year periodicity in the record for the period from 1909 to 1977 may itself be chance and that it would not appear if a much longer period of record were available.
The power spectra for C M and CL show similar results. Those for snow-fall show a number of peaks over the entire frequency range, but with no major peak at 0.06 cyclelyear. Thus no
F R E Q U E N C Y , c y c l e s l y e a r
5O J O U R N A L O F G L A C I O L O G Y
periodicity useful for prediction appears in the avalanche time series at Rogers Pass or in the snow-fall record.
The literature has yet to show a consistent periodicity in avalanche activity. The Rogers Pass time series and data reported by Kahn ( I 966), Loup and Lovie ( I 967), Frutiger ( I 977), and Armstrong (1978), all suggest major avalanching every 18 to 30 years, but this "rhythm" cannot be defined more precisely. Only Tushinskiy (1966) and Kahn (1966) report a correla- tion between the eleven-year sunspot cycle and avalanche activity.
These arguments suggest that projections based on rhythms of avalanche activity are unlikely to be successful. Rather, estimates of future avalanche activity must be made by statistical means, by assigning probabilities of occurrence to certain sizes of avalanche.
Five methods were used to define the climatology of avalanches. Each seeks to identify the specific synoptic conditions that trigger major avalanches as well as establish the nature of the atmospheric circulation preceding them. They are:
( I ) Examination of winter snow-fall, daily precipitation, and maximum and minimum temperatures at Rogers Pass for major avalanche winters.
(2) Case studies of major avalanche winters; daily surface synoptic maps and upper air 500 mbar charts, when available, were analysed.
(3) Classification of daily synoptic maps for the period from November to February for nine major and nine small avalanche winters. These were compared with each other and with a standard period to detect differences. Few observation stations existed in western North America in rgog and knowledge of weather-map analysis was limited. All pre-Second World War maps used were subsequently standardized, however, and re-analysed by the U.S. Weather Bureau in an attempt to produce a homogeneous set. (4) Construction of Hovmoller (1949) diagrams, which show the longitude and intensity of troughs and ridges at the 500 mbar level in middle latitudes as a function of time of winter. These attempt to illustrate differences in hemispheric atmospheric circulation between medium and small avalanche winters.
(5) Discussions of the weather and circulation of the month, appearing regularly in Monthly Weather Review, were examined for major avalanche winters.
6. I . Major avalanche winters at Rogers Pass
These appear to fall into two main categories:
( I ) Winters with strong zonal flow. Characteristic features are frequent storms, rapidly fluctuating but not extreme temperatures, and sustained snow-fall. Major avalanches occur with warming above freezing or exceptional snow-fall, but tend to be distributed throughout the winter, with no period of intense activity. Winters that belong to this category were 197 1-72 and 1953-54.
(2) Winters with strong meridional flow. Characteristic features are a sustained thermal regime that rapidly breaks down or shifts to another which is markedly different. Temperatures are unusually extreme. Prolonged intense outbreaks of Arctic air to the west of the Rockies are followed by a major storm, with rapid warming to above o°C, heavy snow-fall, and sometimes rain. These winters give rise to the catastrophic event, in which many paths produce large avalanches within a few days. The winters of 1919-20, 1934-35, and 1978-79 were in this category. Some winters, such as
1932-33 and 1951-52, appear to be intermediate between categories I and 2. The peaks in the winter snow-fall record (Fig. 2) do not always correspond with those of XF, EM, and Z L (Fig. I ) . The correlation coefficient between Z M and winter snow-fall is
F R E Q U E N C Y O F M A J O R A V A L A N C H E W I N T E R S 5' even weaker. These relations illustrate that heavy snow winters are not always winters with large avalanches. When heavy winter snow-fall occurs, avalanches may run so frequently as to prevent a large build-up of snow in the starting zone, and this, or artillery control, may account for the relatively low C M for 197 1-72. I n some winters, such as I 910-1 I and 1963-64,
no avalanches were sufficiently large to reach the railway line despite above-average snow-fall. O n the other hand, a winter with light or moderate snow-fall can produce a large number of major avalanches, as was the case in 1934-35.
Winters when numerous, very large avalanches occur have weather sequences that maximize all the principal causes of avalanches. Sustained early winter outbreaks of Arctic air below -25°C encourage weaknesses to develop in the snow cover. The trigger storms are associated with record or near-record snowfalls, usually occurring when frontal systems are near stationary or when lows intensify over Rogers Pass. Snow-fall water equivalents of
I I o mm in six days or 60 mm in one day seem to be required. Winds are often strong, so that
there is much drifting snow. Finally, temperatures rise rapidly to above freezing and it often rains. The combination of these extreme weather sequences is apparently required for catastrophic avalanches similar to those of the winters of 1919-20 and 1934-35. Such winter conditions occur rarely and have not done so over the last four decades. (A paper describing in greater detail the climatology of major avalanche winters is in preparation.)
7. CONCLUSIONS
I . During the winter of 1971-72 more avalanches reached the railway line at Rogers Pass
than in any of the last 70 years, possibly more than in the last go years. Other winters, how- ever, have produced more intense avalanche activity involving catastrophic release of much larger quantities of snow within a few days. The most spectacular of these were the winters 1919-20 and 1934-35. AS this type of winter has not occurred within the past four decades, it is beyond the personal experience of those at Rogers Pass.
2. Major avalanche winters produce more frequent avalanches of greater size than average winters, so that their impact tends to come as a surprise.
3. Rhythms in avalanche activity are weak and cannot at present provide a reliable method of prediction. The strongest periodicity is about 18 years.
4. Winters with many catastrophic avalanches released within a few days require a combination of weather conditions, each extreme. These conditions are sustained low temperatures, heavy snow-fall with precipitation that amounts to I 10 mm in six days, or
precipitation intensity of over 60 mm in one day, strong winds, and rapid warming to above
0°C.
5.
There are clear linkages between avalanche activity a t Rogers Pass and atmospheric circulation over the eastern Pacific and western North America. Over the last 70 years major avalanche winters have fallen into two categories:(a) Winters with strong zonal flow, heavy snow-fall, and rapidly fluctuating temperatures; during such winters the activity of major avalanches is spread throughout the winter. (b) Winters with periods of sustained meridional flow and blocking; these are cold, with average or below average snow-falls, and major avalanches occur as Pacific air invades the region.
ACKNOWLEDGEMENTS
The authors are grateful for helpful and critical comments from A. Salway, H. Norem,
R. Perla, M. Church, V. Schleiss, and W. Schleiss. They also wish to thank the staff of the Atmospheric Environment Service of Environment Canada, the British Columbia Ministry of Highways, and CP Rail for their willing co-operation. The weather-typing system was
5*
J O U R N A L O F G L A C I O L O G Yestablished by the Canadian Atmospheric Environment Service. T. J. Ulrych, Department of Geophysics, University of British Columbia, performed the maximum-entropy-method spectral analysis.
This study was carried out when B. B. Fitzharris was on staff as a visiting scientist with the National Research Council of Canada. The paper is a contribution from the Division of Building Research, National Research Council of Canada, and is published with the approval of the Director of the Division.
R E F E R E N C E S
Armstrong, B. R. 1978. A history of avalanche hazard in San Juan and Ouray Counties, Colorado. Canada.
National Research Council. Associate Committee on Geota~hnical Research. Technical Memorandum No. 120, p. 199-2 18.
Chishima, S. 1976. S6ya-kannai no nadare ni tsuite [Statistics of avalanches in Soya district, Hokkaido]. Seppy6,
Vol. 38, No. 2, p. 61 -65.
Frutiger, H. 1977. Avalanche damage and avalanche protection in Switzerland. Glaciological Data. Report GD-I, p-! 7-32.
-
-
Hovrnoller, E. 1949. The trough-and-ridge diagram. Tellus, Vol. I, No. 2, p. 62-66.
Jenkins, G. M., and Watts, D. G. P1g68.1 Swtrol a n ~ ! ~ s i s and its applications. San Francisco, etc., Holden-Day.
(Holden-Day Series tn Timc Scries Anaiysis.)
Kahn, M. 1966. ConsidCrations preliminaires sur la r6partition chronologique des avalanches de neige. Union
de GidCrie t t G60physiq11e Inbcmnnlionale, Association Ittternationale d'Hydrologie ScientiJque. Commission pour la N e k e
el In Glace. Division A'eige LSaironndre et At~nlanches. S_~mposium international sur les aspects scientijques d e s avalanches
& neige, 5-10 acril 1965, Doms, S~tissf, p. 332-40. (Publication No. 69 de 1'Association Internationale d'Hydrologic Scientifique.)
Loup, J., and Lovic, C. 1967. Sur la frtquence des avalanches en Haute Tarentaise. Revue de Giographie Alpine,
Tom. 55, Fast. 4, p. 587604.
Schaercr, P. A. 1972. Terrain and vegetation of snow avalanche sites at Rogers Pass, British Columbia. ( I n
Mountain ~eomorpholo~~. - - \.'ancouver, B.C., Tantalus Research Ltd., p. 215-22. (B.C. Geographical Series,
NO. 14.))
Schaerer, P. A. [1g75.] Relatmn between the mass of avalanches and characteristics of terrain at Rogers Pass, R.C., Canada. [Union Gbd4kque et Gdop!yn'que Intnrmtionale. Association Internationale des Sciences Hydrologiques.
Commission der ,Veigcs el GLmes.1 Symposium. .IYeig~s ef glaces. Actes du colloque de Moscow, aodt 1971, p. 378-80.
(1ASH-ATHS Publication No. 104.)
Tushinskiy, G,
K.
1966, Avalanche claification, and rhythms in snow cover and glaciation of the NorthernIiem~sphere In historical times. Union de GLoaZsie et GLophysique Internationale. Association Internationale d'tlydrologk ScientiJque. Commission pour la Neige et la Glace. Division Neige Saisonni2re et Avalanches. Symposium international
sur les aspects ~cient$~ues des avalanches de neige, 5-10 avril 1965, Davos, Suisse, p. 382-93. (Publication NO. 69 de
1'Association Internationale d'Hydrologie Scientifique.)
Ulrych, T. J., and Bishop, T. N. 1975. Maximum entropy spectral and autoregressive decomposition. Reviews of