CRYSTALLOGRAPHIC ORIGINS OF FAST-ION CONDUCTION IN
PYROCHLORE
by
Kevin W. Eberman
B. S. Materials Science and Engineering University of Wisconsin at Madison, 1994 Submitted to
in Partial
the Department of Materials Science and Engineering Fulfillment of the Requirements for the Degree of
DOCTOR OF PHILOSOPHY IN MATERIALS SCIENCE
at the
Massachusetts Institute of Technology June 1998
© 1998 Massachusetts Institute of Technology All rights reserved
Signature of Author
Department of Materials Science and Engineering
S r a May 1, 1998 Certified by .Be r rdt J. Wuensch Professor of Ceramics Thesis Supervisor Accepted by , Linn W. Hobbs John F. Elliott Professor of Materials Chairman, Departmental Committee on Graduate Students
104IN&A- - ;
CRYSTALLOGRAPHIC ORIGINS OF FAST-ION CONDUCTION IN
PYROCHLORE
by
Kevin W. Eberman
Submitted to the Department of Materials Science and Engineering on May 1, 1998,
in partial fulfillment of the requirements for the degree of DOCTOR OF PHILOSOPHY
IN MATERIALS SCIENCE
Abstract
We have examined the crystallographic origins of fast-ion conduction in oxides with the pyrochlore structure-type, ideally A2B207, a superstructure of (A,B)203.5 defect
fluorite-like array. These materials have technological promise for use in electrochemical devices such as oxygen sensors and solid-oxide fuel-cells. The pathway for ion conduction proposed by several authors has been a jump between equivalent nearest-neighbor oxygen sites through the tetrahedral edges of the relatively-immobile cation array. Substitution of a third cation species in slid-solution in the B site, A2(B-yB'y)2O,, results in a marked
change in the structure and properties of the materials which is not fully understood. As the average radius of the cations occupying the B-site increases (with changing composition) towards that of the larger average radius of the cations occupying the A-site, a tendency for increasing disorder has been observed, where complete disorder corresponds to the fluorite structure. A decrease in Frenkel-defect formation-energy and an increase in the migration enthalpy accompanies the disordering. We have executed several studies of pyrochlore structures employing neutron and x-ray powder diffraction. In particular, we have focused on high-temperature in-situ experiments that should better correspond to the structure for which the conductivity measurements were made at elevated temperature. We have used (1) powder neutron diffraction to examine the structure of the Y2(SnyTi,-y)202 solid-solution series, (2) powder x-ray diffraction to study
the structure of the Gd2(SnyTi-.y)207 solid-solution series, (3) powder neutron diffraction
to determine the effect of elevated temperatures (to a maximum of 14500C) and decreased oxygen partial pressures on the crystal structure of Y2(Zro.0Tio.4)2O,, Y2Sn2
0,
and(Y.90Ca0.10)2Ti2O7. The results demonstrate that bonding plays at least as important a role
in stabilizing the superstructure as the difference between the A3' and B4+ cation radii.
Both the Y2(SnyTi,-y)202 and the Gd2(SnyTi$.)207 solid-solution series remain relatively
ordered despite the increase in average B4+ radius with tin substitution beyond that of the
average B4+ radius for members of the series Y
2(ZryTi.-y)207 and Gd2(ZryTi-y)20O7 which
were both determined previously to exhibit a high degree of disorder. The degree of disorder among compounds examined did not change greatly with elevated temperature, although the Y2(Zro.o6Ti0.40)207 did show signs of increasing disorder above 10000C.
in Fourier synthesis of the scattering density which displayed a bridge between nearest 0(2) and 0(1) sites. This is not confirmed as an active conduction pathway in (Y.9Ca.1)2Ti207 pyrochlore. Instead, a curved pathway connecting nearest 0(1) sites nominally in the <100> is detected. This observation confirmed the accepted mechanism for ionic-conduction. Evidence was found for an equivalent vacancy population on the 0(1) and 0(2) sites for this compound.
Thesis Supervisor: Bernhardt J. Wuensch
Acknowledgments
Gratitude is often hard to accept, because we feel that we have only done our job. Those whom I would like to acknowledge here will hopefully accept my gratitude, for they have gone well beyond the call of duty. I have been blessed in life, and during my days at MIT, by the company of caring individuals who could never just do what was expected of them.
I was told by my elder peers in college that the key to happiness in graduate school was having a good relationship with your thesis advisor. I was lucky twice in this respect. I began at MIT working under Professor Subra Suresh, who proved thoroughly decent and thoughtful. After a term, when I decided to change horses to Professor Bernhardt Wuensch, Subra brought grace to this potentially awkward transition. Bernie brings style to everything and this event was no exception.
The danger in my relationship with Bernie Wuensch was never, "Will I be prepared to meet with him today," but instead, "Will we get so caught-up in conversation about adventure in the great-outdoors that I forget what I came to inquire about." Bernie never exerted an ounce of pressure on me. Instead he provided a wealth of ideas and a virtual springboard for my own thoughts. When I was unmotivated, Bernie was inspiring through shear charisma and enthusiasm. Bernie made my thesis experience seem more
like walk through Wonderland than a portage over rough terrain.
Two others who helped me to navigate the terrain at MIT were my committee members, Professors Harry Tuller and Samuel Allen. I was very impressed by how thoroughly Harry and Sam had read my thesis, and by the sophistication of the discussion we shared at my final defense. Their comments and suggestions for my thesis truly sharpened the document.
A group of five more Doctors deserve special mention for providing me with a compass pointing the way out of the woods just as I had entered the forest. Michael Liberatore and Yong-Chae Chung helped me to make the decision to start working with Bernie and always provided a balanced sounding-board. Per Onnerud came to MIT from Sweden as
post-doc in the early part of 1995. With his background in solid-state chemistry and his extensive experience with the Rietveld Method, plus his ebullient and brotherly demeanor, I enjoyed a virtual piggyback for the first mile of my journey. His effervescent wife Kristina Limpe Onnerud also assisted us, especially to understand the arcane chemistry of organo-metallic solutions. Harry Tuller, Bernie Wuensch, Per Onnerud, and Tae-Hwan Yu initiated the collaboration to examine the stannate pyrochlores discussed in the present work. Tae-Hwan was always very interested in our structural analyses, though he needed to focus most of his attention his own thesis. He was also a pleasure to work with, providing us with all sorts of secrets in the art of the liquid-mix synthesis method. The greatest impetus for these continued crystal-structure studies of fast-ion conducting pyrochlores, came from Catherine Heremans. She published, with Bernie Wuensch and Judith Stalick, the first examination of the relationship between progressive-disorder induced by chemical substitution and the ionic conductivity for pyrochlore solid-solutions. It is not just for this that I am indebted to Catherine, but also for countless hours of advice, both scientific and otherwise. With perfect charm, Catherine detected and announced to me what was making it so hard to write my thesis proposal. I simply sighed far too often. She could always melt that sigh into laughter.
Other members of the Wuensch Entourage whom I have had the good fortune to work with were Jessica Lai, Evangeline Yeo, Dr. Dirk Wilmer, and Esther Ku. Jessica came to us as a freshman and astonished us with her independence and precipitous learning curve. Evangeline helped us to begin characterizing the (Sn,Zr) leg of the yttrium titanate-zirconate-stannate pyrochlore system. With Dirk I shared many scientific and personal conversations that kept me afloat in the later part of my trek, especially at Argonne National Laboratory. Esther provided an outlet for my experience just when I was about to burst with knowledge of the pyrochlore structure. I hope to have handed-off my
compass to her when I leave the thicket.
Diffraction experiments are never done completely independent from the professionals, and a group of five individuals provided assistance with a smile. I have personally
logged hours upon hours of time using the x-ray diffractometers at MIT. Joseph Adario and Peter Kloumann never hesitated to drop whatever they were doing to help me untangle the snarls I encountered in that time. Without the help of Dr. Judith Stalick at NIST, we could never have gathered all of the constant-wavelength neutron diffraction data in the present work. We just sent her the samples and she did the rest. Dr. James D. Jorgensen practically invited Bernie and I to come to Argonne National Laboratory for collection of pulsed-neutron diffraction data in-situ at elevated temperatures. I spent approximately three and one-half months in sum under the nurturing supervision of Jim, with most of my time funded by the Laboratory. The experiments were performed primarily with assistance of Simine Short, who made herself available at any hour, and always with a optimistic attitude.
I would like to include a brief statement to acknowledge all those populating this landscape who surprised me at every encounter with positive attitudes. Our department secretary, Gloria Landahl, certainly endured most of my long-sighs which came whenever I had my map upside-down. The Department of Materials Science and Engineering needed a new graduate secretary, but got much more - a ray of sunshine. Professor Yet-Ming Chiang ran a no-nonsense, up-beat, 3.082 class, for which I had the pleasure of providing teaching assistance. Elaine Tirrell brought color to my experience through the many tales we exchanged. Fred Wilson unlocked many doors that stood in my way and boosted my morale like the mushrooms Alice eats in Wonderland. Joshua Friedman made all my financial woes seem like clockwork. The entire office staff in the DMSE headquarters deserves a tip-of-the-hat as well.
If you think this section has been too sentimental for your blood thus far, stop now, reader, for you may not take well the print that follows. A handful of fellow travelers in this forest made the way so much more marvelous. The first was Dr. Christopher San Marchi, whom I met at the Royal East during the hosting of perspective students. Chris was never the agreeable sort, but never disagreeable either. The second was Dr. James Foresi, to whom Chris introduced me. Jim too was not one to go along with anything. Chris, Jim, and I shared countless hours, haunting Irish pubs and sharing tangential banter
that was always somewhere between clever conversation and meaningful discourse. Both of them were anything but the typical MIT student. Later, I got closer to Dr. Laura Giovane, who could sympathize with me in our parallel struggles with enduring long-distance in a relationship and with the final scramble towards the thesis grail. Anand Reddy and John Reed kept me strong in those last months.
Outside of the land of Technology, I shared a supportive home with Todd Krueger and Ben Brown for three years. They watched helplessly as I delved deeper and deeper into my thesis, but never complained, and never lost any faith in me. If either one of them was at home with me, I could always be guaranteed a stimulating and non-scientific
conversation. I am not sure I would be so sane today if not for them.
In the same house for most of those years were my oldest brother Brian, my sister-in-law Margaret, and my niece Catherine. Surrounded by family as well as friends, it was never hard to regain my balance. My other brother Doug, came to my aid as well, sometimes lending me his ear in the middle of the night. Thanks go to my parents, Kay and Paul, who gave me the confidence to take on many challenges leading to MIT and supported me throughout the quest.
The supporters I have listed were always just that, supporters, never pushing me forward but instead keeping me on my feet. The one who pushed and always had overly ambitious expectations was me. This mania of mine was at its height during my graduate work, and only one extraordinary individual had the magic to make me keep the picture in perspective. Without the stubborn love lavished on me by Bianka Pineda, my fiance, I would not be turning in my thesis this semester, and I may not have seen the light at the edge of the woodland at all. Bianka never once doubted that I would finish. I think that bright-light shining in the meadows beyond this forest was actually her, since Bianka and I shall be married in just over one month's time.
Table of Contents
A bstract ...
Acknow ledgm ents ... ... 5
Table of Contents ... ... 9
List of Figures ... 11
List of Tables ... ... 13
Preface ... 14
1 INTRODUCTION ... ... 16
1.1 Purpose of this Research ... ... 16
1.2 Technologies Using Pyrochlore ... ... 18
1.3 Pyrochlore Structure ... 23
1.4 Ionic Conductivity for the Y2(Sn7Ti .) 20,, Gd2(SnyTi1,,)2O7, Y2(ZryTil-,)20,, and (Y l.Ca )Z TiO 7 Pyroch rlores ... ... 27
1.5 Relationships Between Structure and Ionic Conductivity in Pyrochlore Systems ... 31
1.6 Synthesis Routes: Liquid Mix (Pechini) and Solid-State Reaction ... 34
1.7 Rietveld Analysis ... ... 35
1.8 Sum m ary ... 36
2 PERSISTENT ORDER IN THE Y2(SnyTi.y)207 PYROCHLORE SYSTEM DETERMINED BY RIETVELD ANALYSIS OF NEUTRON DIFFRACTION DATA ... 38
2.1 Introduction... ... 38
2.2 Experim ental ... ... 39
2.3 Refinem ent of the Structures ... ... 40
2.4 Results and Discussion ... ... 47
2.4.1 Variation of Atomic Coordinates with Composition ... 47
2.4.2 Changes in Disorder with Sn Content...51
2.5 Conclusions ... ... 56
3 RIETVELD X-RAY ANALYSIS OF THE STRUCTURE OF FAST-ION CONDUCTING Gd2(SnTiz.Y),O SOLID SOLUTIONS AND ITS RELATION TO IONIC CONDUCTIVITY...58
3.1 Introduction ... ... 58
3.2 Experim ental ... ... 58
3.2.1 Preparation of Samples ... 58
3.2.2 X-Ray Analysis... ... 59
3.3 Refinem ent of the Structures ... ... 60
3.4 Results ... ... 64
3.4.1 Variation of Coordinates with Composition ... 66
3.4.2 Change in Disorder in the Cation and Anion Arrays with Sn4+ Content ... 67
3.4.3 Structure Related to Conductivity and Conclusions ... ... 69
4 STRUCTURES AS A FUNCTION OF TEMPERATURE AND OXYGEN PARTIAL PRESSURE FOR Y z(Zro TiO.40)2O 7 AND Y,Sn2O 7 ... ... 7 2 4.1 Introduction ... ... ... 72
4.2 Experim ental ... ... . ... 73
4.2.1 Preparation of Samples ... ... 73
4.2.2 Neutron Diffraction... ... 73
4.3 Refinem ent of the Structures ... ... 74
4.4 Results ... ... 80
4.4.1 Variation of Structural Coordinates with Temperature ... 82
4.4.2 Change in Disorder in Cation and Anion Arrays with Temperature... ... 85
4.4.3 Fourier Synthesis of Scattering-Density ... 91
4.5 Conclusions ... ... 97
5 STRUCTURE AS A FUNCTION OF TEMPERATURE OF A DOPED PYROCHLORE: (Y0.9Ca0o.o)2Ti2O7... 99
5.1 Introduction ... ... 99
5.2 Experim ental ... ... 101
5.2.1 Preparation of Samples ... ... ... 101
5.2.2 Neutron Diffraction...102
5.3 Refinem ent of the Structures ... ... 102
5.4 R esults ... ... 108
5.4.1 Analysis of M inor Phases ... 1... 111
5.4.2 Variation of Structural Coordinates with Temperature ... ... 113
5.4.3 Change in Disorder in Cation and Anion Arrays with Temperature ... 116
5.4.4 Fourier Synthesis of Scattering-density ... 122
5.5 Conclusions ... ... 124
6 CONCLUSIONS AND RECOM M ENDATIONS ... ... 126
6.1 M ajor C onclusions ... ... 126
6.2 Future W ork ... ... 127
List of Figures
Figure 1. 1 Above, the general design and, below, a schematic for a solid oxide fuel cell is pictured...19 Figure 1. 2 Representative data for a number of oxygen ionic conductors with fluorite, pyrochlore, and
perovskite structures [16] ... 21 Figure 1. 3 An illustration of a solid oxide fuel cell composed entirely of modified Gd2Ti207 pyrochlore..22
Figure 1. 4 (a and b) Projection of the contents of the pyrochlore supercell for 0 5 z _ 4, given in (a)...23 Figure 1. 5 Structure field map of A3 +
cation radius versus B4+ cation radius contoured with values of the lattice constant, a, 0(1) coordinate, x, and radius ratio, r/r ... ... 27
Figure 1. 6 Variation of the ionic conductivity of the Y2(SnyTi,-y)207, Gd2(SnyTi,-y)207 and the
Y2(ZryTi,y)207 at 1000 0
C... ... 29 Figure 1. 7 Increase with temperature of the pre-exponential factor for ionic conductivity of the
Y2(SnyTi-.y)207, Gd2(SnyTi.-y)207 and the Y2(ZryTi,.y)207 at 10000C...29
Figure 1. 8 Increase with temperature of the activation energy for ionic conductivity of the Y2(SnyTi-y)20,
Gd2(SnyTi .)207 and the Y2(ZrTi-,)20,. ... .. .. .. .. .. . . 29
Figure 1. 9 Ionic portion of the electrical conductivity of Y2(ZrTi.-y)207 as a function of temperature and
the atomic fraction, y, of Zr4+ substituted for Ti. ..... .. .. .. .. .. . . .. . . .. . . .. . . 33
Figure 2. 1 Powder-diffraction patterns obtained with 1.5396 A thermal neutrons for Y2(SnyTil-y)207 samples with y = 0.00, 0.40, 0.60, 0.85, and 1.00 ... 45 Figure 2. 2 Variation of the pyrochlore lattice constant with composition y. ... 48 Figure 2. 3 Displacement with increasing Sn4+
content, y, of the 0(1) coordinate x. ... 48 Figure 2. 4 A comparison for the 0(1) coordinate x as a function of mean B4+ ionic radius between the
Y2(SnyTil.,)207 and the Y2(ZryTi.-y)207 systems, shown as squares and triangles respectively...50
Figure 2. 5 Change in occupancy of the normally unoccupied 0(3) site with increasing Sn4+ content of the pyrochlore solid-solutions. ... ... 52 Figure 2. 6 Variation with Sn4+ content, y, of the anisotropic temperature coefficients, uij, for 0(1)
diagonalized along the principle directions <100>, <0-11>, and <011>, shown as squares,
triangles, and circles respectively... ... 52 Figure 2. 7 Decrease in occupancy of the A site with increasing Sn'4 content, y, by y3 , [Y ... 55 Figure 2. 8 Variation with Sn4+ content, y, of the temperature coefficients for the A and B sites...55
Figure 3. 1 Powder-diffraction patterns for Gd2(SnyTil-y)207 samples with y = 0.20, 0.40, 0.60, and 0.80 obtained with Copper Kcx radiation (,CuKal = 1.54051, XCuKa2 = 1.54433 A) ... 62
Figure 3. 2 A powder-diffraction pattern for the Gd2(Sn0.20Ti0.80)207 composition scaled to reveal features in of the background. ... ... 63 Figure 3. 3 The lattice constant of Gd2(SnyTi.-y)207 as a function of composition are plotted as squares...66
Figure 3. 4 Variation of the coordinate x for 0(1) in 48f x'/,'/, plotted as squares... 66 Figure 3. 5 Change in occupancy of the 0(1) site with increasing Sn44 content of the pyrochlore
solid-solutions. ... ... 68 Figure 3. 6 The concentration of Gd34 on the A site as a function of composition for Gd2(SnyTi,-.)207 solid
solutions under the assumption that Sn4Ti4 . exchanges with each Gd3' . . . .. .. ... . . . . 68 Figure 3. 7 Ionic portion of the electrical conductivity of Gd2(SnyTi.y)207 at 1000*C as a function of the
atomic fraction, y, of Sn substituted for Ti...70
Figure 4. 1 Powder-diffraction patterns for Y2(Zr.0Ti0.40)207 sample at 20, 800, 1000, 1200, and 1450 OC
Figure 4. 2 Powder-diffraction patterns for Y2Sn207 sample at 100, 1000, and 1400 oC obtained with
pulsed neutron radiation ... ... 77
Figure 4. 3 The lattice constants of Y2(Zro.60Ti0.40)207 and Y2Sn207 as a function of temperature are plotted as squares and triangles respectively ... ... 82
Figure 4. 4 Variation of the coordinate x for 0(1) in 48f x'/,'/ plotted as squares and triangles for Y2(Zro.6oTi.40)207 and Y2Sn207 as a function of temperature ... ... 83
Figure 4. 5 The increase with temperature in bond length for the A-0(1) and B-0(1) bonds are plotted for Y 2(Zr0.6Ti0 .40)20 7 and Y 2Sn20 7 ... .. .. .. .. . .. .. .. . .. .. .. . .. .. .. .. .. . .. .. .. . .. .. .84
Figure 4. 6 Change in all refined site occupancies with increasing temperature of the pyrochlore com pounds. ... ... 85
Figure 4. 7 Diminishing combined occupancy for the oxygen sites with temperature is plotted for Y2(Zr.6Ti0.40)207 o and Y2Sn207 ... .. . .. .. .. .. .. .. . .. .. . .. .. .. .. .. .. . .. .. .. . .. . . . 87
Figure 4. 8 The increase in mean square displacement of oxygen about the 0(1) site with temperature is shown for Y2(Zro.6Ti0.40)207 and Y2Sn207 ... . .. . .. .. .. . . .88
Figure 4. 9 The variation with temperature in mean square displacement of the cations about their respective A and B sites is shown for Y2(Zro oTi.40)207 and Y2Sn207 ... .. .. .. .. . .. .. . . . .. .. 89
Figure 4. 10(a-d). Fourier synthesis maps of the scattering density, p, in Y2(Zro.60 Ti.40)207 pyrochlore are plotted for 4 temperatures: (a) 20, (b) 800, (c) 1200, and (d) 1450C ... 92
Figure 4. 1 l(a and b). Fourier synthesis maps of the difference density, pobs -P,,, for Y2(Zro0 60Ti0 4 0)207 pyrochlore are plotted for 2 temperatures: (a) 1200, and (b) 14500C ... 93
Figure 4. 12(a, b). Fourier synthesis maps of the scattering density, p, in Y2Sn207 pyrochlore are plotted for 2 temperatures: (a) 100 and (b) 14000C. ... 94
Figure 4. 13(a-d). The variation in all refined site occupancies of the pyrochlore compounds with time in a reducing atm osphere. ... 97
Figure 5. 1 The complete powder-diffraction pattern for the (Y0.Cao0 10)2Ti207 sample at 250C obtained with constant-wavelength neutron radiation. ... 101
Figure 5. 2 Powder-diffraction patterns for (Y.9Cao.o1)2Ti207 sample at 158, 984, and 1389 OC obtained w ith pulsed neutron radiation ... 103
Figure 5. 3 The increase with temperature in weight fraction of A1203 from the sample support ... 109
Figure 5. 4 The lattice constants of the CaTiO3 minor phase as a function of temperature are plotted... 110
Figure 5. 5 The lattice constants of the A1203 minor phase as a function of temperature are plotted. ... 111
Figure 5. 6 The lattice constant of (Y.9Cao10)2Ti207 as a function of temperature is plotted ... 113
Figure 5. 7 Variation of the coordinate x for 0(1) in 48f x'/g'/ plotted for (Yo.9Cao.0)2Ti207 as a function of tem perature... ... 113
Figure 5. 8 The increase with temperature in bond length for the A-0(1) and B-0(1) bonds are plotted for (Y o.,C ao.10)2Ti20 7pyrochlore... 115
Figure 5. 9 Change in all refined site occupancies with increasing temperature of the (Yo.gCaoo10)2Ti20, com pound... . ... 118
Figure 5. 10 Diminishing combined occupancy for the oxygen sites with temperature is plotted for (Y o.9C ao. )2T i20 7 ... 118
Figure 5. 11 The increase in mean square displacement of oxygen about the 0(1) site with temperature is show n for (Y .9Cao. )2Ti20 7 ... .. .. . ... .. .. . .. .. .. . .. .. .. .. . .. .. ... . . . .. .. . . 119
Figure 5. 12 The variation with temperature in mean square displacement of the cations about their respective A and B sites is shown for (Yo9Cao o1)2Ti207... . . . ... . .. .. .. . .. .. .. . . .121
Figure 5. 13(a,b). Fourier synthesis maps of the scattering density, p, in (YO.9Ca.10)2Ti207 pyrochlore are plotted for 2 temperatures: (a) 158 and (b) 1389C ... ... 123
List of Tables
Table 2. 1. Values of the Lattice Constant, Atomic Coordinates, Site Occupancies, and Anisotropic Temperature-Factor Coefficients, Peak Shape, and Residuals for the Y2(SnyTil.y)207 phase. The two
compositions marked "s" were synthesized by solid-state reaction; the rest were synthesized by a liquid-m ix route. ... ... 46 Table 3. 1. Values of the Lattice Constant, Atomic Coordinates, Site Occupancies, and Isotropic
Temperature-Factor Coefficients, Peak Shape, and Residuals for the Gd2(SnyTit-y)20~ phase...65
Table 4. 1. Values of the Lattice Constant, Atomic Coordinates, Site Occupancies, and Anisotropic Temperature-Factor Coefficients, Peak Shape, and Residuals for the Y2(Zro. 60Tio.4)207 Phase at
Five Temperatures, Nominally 20, 800, 1000, 1200, and 14500C. ... ... 78
Table 4. 2. Values of the Lattice Constant, Atomic Coordinates, Site Occupancies, and Anisotropic Temperature-Factor Coefficients, Peak Shape, and Residuals for the Y2Sn20 7 Phase at three
Temperatures, Nominally 100, 1000, and 14000C. ... .... ... 79 Table 5. 1. Results from Refinement of Data from a Constant-Wavelength (A = 1.5396A)
Neutron-Source. Values of the Lattice Constant, Atomic Coordinates, Site Occupancies, and Anisotropic Temperature-Factor Coefficients, Peak Shape, and Residuals for the Y2Ti207 and (Y.9Ca.10)2Ti20 7
Phases, and the Weight Fraction and Lattice Constants of the Minor CaTiO3 Phase ... 106
Table 5. 2. Results from Refinement of Data from a Pulsed Neutron Source. Values of the Lattice Constant, Atomic Coordinates, Site Occupancies, and Anisotropic Temperature-Factor Coefficients, Peak Shape, and Residuals for the Y2Ti20, and (Yo 9Cao10)2Ti20 7 Phases, and the Weight Fraction
and Lattice Constants of the Minor A1203 Phase and the Lattice Constants of the Minor CaTiO3
Preface
Before beginning to describe the details of this study of fast-ion conducting pyrochlores, it will be helpful to the reader to understand the organization of the present thesis. Generally, the body chapters are written to stand-alone as manuscripts to be submitted for publication, except where the chapters greatly overlap. For example, since each chapter is a self-contained study of pyrochlore structures with its own particular purpose, a description of the pyrochlore structure-type would be necessary for each, if they were submitted as manuscripts for publication. It would be tedious to read descriptions of the structure-type four times; thus it is described just once in the Introduction.
The Introduction, however, contains more general background information than would be included in any manuscript. Aside from providing information that is common to each study, the Introduction gives a brief summary of topics that are thought to be of interest to the reader. It is not the purpose of this introduction to provide any comprehensive review, but rather to give the information necessary to understand the analyses and observations made in the rest of the thesis. Where it is appropriate, the reader is pointed to sources, such as reviews and world-wide-web-sites, for more information beyond the scope of the present work.
Each body chapter contains all the analysis and discussion pertinent to the study at hand, and it contains the relevant comparisons to the results from the other chapters. The research is presented chronologically, in the order in which it was completed, thus the cross-referencing between chapters increases with chapter number. The reader may perceive the "story" of our exploration in that the goals of each chapter follow sensibly from the results of the previous chapter. More speculative reasoning, concerning the overall results from the individual studies, is given in the Conclusion.
A summary of the major results of this thesis are presented in the Conclusion. We also attempt to assimilate our total knowledge of the pyrochlore structure and to compare it in greater detail to the conductivity results obtained by others. The implications as to how
one should design a pyrochlore to improve the ionic conductivity from the perspective of its atomic arrangement is given. Additionally, suggestions for future research are given. This arrangement was chosen for two reasons: (1) for the benefit of the reader, and (2) for the benefit of the author. A thesis is not typically read from cover-to-cover. Instead, the reader is interested in some particular facet of a thesis and wishes to quickly extract just that. Often a single figure is the object of interest in a thesis, and the reader will simply photocopy that figure and leave the thesis on its shelf, having never glanced at the pages surrounding it. The arrangement for this thesis was chosen, in part, to accommodate this kind of reader who is thought to be typical. If a person is interested in high-temperature studies of the crystal-structures of fast-ion conductors performed in-situ using neutron diffraction, the person may turn directly to Chapter 4 or 5 without missing any integral text. The author acknowledges that the other motivation for the organization style chosen was to expedite the publication of the results.
1 Introduction
1.1 Purpose of this Research
Fast-ion conducting pyrochlores, A'+B4
'O,, have been found which may be of technological value. Conductivity measurements and crystal-structure determinations have been performed for a great number of pyrochlores. Some computer modeling has also been done to understand the origin of the fast-ion conduction in these pyrochlores. Moon et al. have shown recently in a solid-solution series that substitution on the B site of a larger isovalent cation for a smaller one drives the system to a completely disordered state with a non-stoichiometric fluorite structure, MO1.75 [6]. In a Rietveld analysis of neutron diffraction data from quenched specimens at ambient temperature Heremans et al. have shown [1,2] that the system Y2(ZryTi-.y)207 progressively disorders with
increasing y and attains the non-stoichiometric fluorite structure at y = 0.90. The creation of, on average, '/ vacancy in each anion site causes the disordered pyrochlores to be oxygen-ion fast-ion conductors. Indeed, the ionic conductivity increases by more than 10' above that for fully-ordered pyrochlore [3] to levels that are useful in technological applications (e.g., 10-2 S/cm at 10000C).
However, the structural origins of fast-ion conduction in these pyrochlore-structured materials are not yet fully understood. Among questions remaining are the following.
1. Is disorder among the cation and anion arrays of the structure truly dependent on the relative size of the A and B cations alone and not on bonding?
2. Are the disordering processes in the cation and anion arrays coupled? Results for quenched samples in the Y2(ZryTi,,)207 system indicate that the disordering processes do occur independently. In fact, three parameters are necessary to describe the state of order. Two parameters are needed to describe the anion site disorder, one independent occupancy for each of the two sites emptying as the interstitial 0(3) fills, and a third is needed to describe the anti-site disorder in the
cation array. Is this truly how this system behaves when it has an equilibrium structure? The phase stability calculations for the similar Gd2(ZrTil.Y)207 system
indicate that order in the cation array should be strongly coupled to that in the anion array [4].
3. Given the fact that these are fast-ion conductors at elevated temperature, to what degree is the temperature structure preserved by quenching? If the high-temperature structure is poorly represented by the structure of a quenched sample, all of the crystallographic determinations to date bear no relevance to the high temperature conductivity data.
4. Is the ionic conduction mechanism that is generally accepted in agreement with observations made by diffraction methods? If the hopping motion of ions between neighboring sites is frequent enough, examination of the structures at elevated temperature should reveal a distribution of scattering-density between anion sites consistent with that predicted from conductivity measurements and computer modeling.
5. What is the crystallographic disorder induced by aliovalent substitution? Are charge compensating oxygen vacancies indeed formed? To the best of our knowledge this issue has never been investigated.
To address questions 1, 2, and 4, we collaborated with Dr. Tae-Hwan Yu and Prof. H.L. Tuller in the synthesis of new pyrochlore solid-solutions: Y2(SnrTily)207 and
Gd2(SrTi,-y)207 [5]. These Sn4+ substitution series were chosen for comparison to the
Zr' substitution series previously studied by Heremans and Moon: Y2(ZryTil.y)20 7 and
Gd2(ZryTi,,.)207 [1,2,3,6]. The yttrium zirconate-titanate, in particular, was shown to be
completely disordered at y = 0.90. Thus we thought it reasonable to investigate the substitution with Sn4+, as its ionic radius is intermediate to that of Ti4+ and Zr4',
corresponding to the average radius of (Zr0.74Ti. 26). Neutron diffraction studies of the two
refinements of the compositions y = {0.00, 0.40, 0.60, 0.85, 1.00} and {0.20, 0.40, 0.60, 0.80} are given for the Y2(SnyTily)20, and Gd2(SnyTi,-y)207 systems respectively.
A highly disordered pyrochlore from the Y2(ZryTil.,)207 solid-solution system, with y =
0.60, was chosen for comparison to the fully ordered Y2Sn207 compound. In addition to addressing questions 1, 2, 4, and 5, we compared these two pyrochlores to examine the effect of having a solid-solution of B4+ cations opposed to a single B4" cation. Neutron
diffraction studies at elevated temperature and controlled oxygen partial-pressure are described in Chapter 4. Structural refinements for 78 and 85 data-sets from different temperatures are given for the Y2(Zr0.60Ti0.4 0)207 solid-solution and Y2Sn20 7 compound
respectively.
We have additionally examined a doped pyrochlore, (YO.9Ca0.1)2Ti20 7, to probe questions 3, 4, and 5. Structural analysis from neutron diffraction data taken for the sample at room temperature and at elevated temperatures are given in Chapter 5. It was hoped that the high ionic-conductivity and the high degree of order in this doped pyrochlore could make direct measurement of parameters for ionic-conduction possible.
1.2 Technologies Using Pyrochlore
At this summer's Democratic National Convention, the Chicago Transit Authority will showcase a vehicle that could forever change the grimy
image of the urban transit bus. Powered by a fuel cell developed by Ballard Power Systems, based in Vancouver, B.C., its only exhaust is water so pure that CTA President Robert Belcaster actually drank a glassful straight from the tailpipe. "It tasted like the water my mother used to put in her iron, " he says. No wonder Belcaster predicts fuel-cell buses could eventually take over Chicago's entire fleet and calls this "the power technology for the next century. "
This leading paragraph from Business Week [7] awakens us to the reality of the coming age of fuel-cells. The article goes on to mention that Daimler Benz unveiled a Mercedes minivan that is capable of 65 mph and a 150 mile trip powered by a fuel-cell. Possibly by 2020, Benz believes it could be mass producing fuel-cell cars. Articles expressing enthusiasm about fuel-cell powered cars have been numerous in recent years
[8,9,10,11,12], but the current power-plant for these prototype automobiles uses a proton-exchange membrane. The membrane materials for oxygen proton-exchange, a class of which is the focus of this thesis, are leading competitors but not yet efficient enough to be commercially viable [13,14]. One source of motivation for this research is to expand the understanding of these materials such that their properties as solid-oxide fuel-cells may be improved.
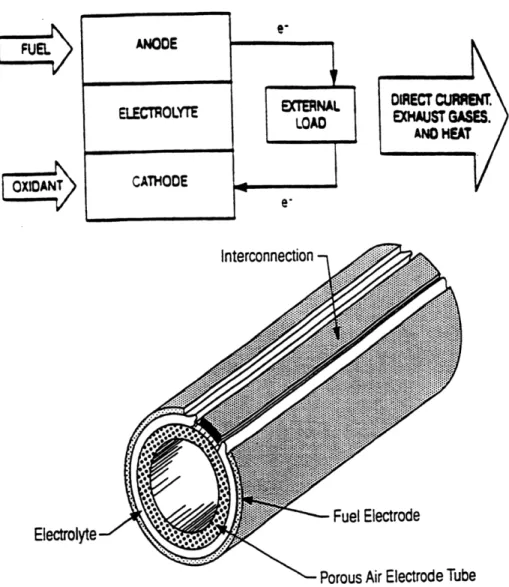
DIRECT CURAB4t.
EXAUST GASES. ANO HEAT
Electrolyte-Porous Air Electrode Tube
Figure 1. 1 Above, the general design and, below, a schematic for a solid oxide fuel cell is pictured. The ideal half reactions in the electrodes are as follows:
Cathode: 202 +2e- = 02-Anode: H2 + 02- = H2O +
2e-Cell: H2 +'A02 = H20.
The lower figure is from Westinghouse. It features an air-electrode-supported type tubular design [15].
FUEL
The typical fuel-cell material today is yttria-stabilized cubic zirconia. This is the same ceramic used in the exhaust manifold of nearly every car on the road. The cubic zirconia acts as the oxygen membrane in a sensor to give a highly sensitive voltaic signal indicating the oxygen partial pressure in the exhaust. This, in turn, is used to monitor and control the air-to-fuel ratio injected into the engine. Clearly, this material is very useful and valuable due to its high oxygen-conductivity [16]. This conductivity is approximately 10-1 S/cm at 10000C and has an activation energy of -leV.
Cubic zirconia could act as solid electrolytes or as electrodes in an oxygen sensor or in a solid oxide fuel cell (SOFC) (Fig. 1.1). Several design requirements must be met for a fast-oxygen ion conductor to be technologically valuable in a solid state electrochemical device [17]. An electrolyte and an electrode would both require high ionic conductivity,
ui 2 10.2 S/cm. The electrolyte must have a low electronic conductivity, oe, while the
electrode requires a high electronic conductivity. This criterion is best described in terms of the electronic-transference number, te, as:
t Q, [1.1]
ai + Ce
where te should be less than 102 for an electrolyte and much greater than 102 for an electrode. The important secondary requirements are chemical, morphological, and dimensional stability, compatibility with adjoining materials, adequate strength, and a reasonable cost of fabrication.
One possible material-system under consideration for use in oxygen conducting electro-chemical devices is the perovskite system which has recently achieved high conductivities for oxygen [18,19,20,21]. A study of lanthanum and praseodymium strontium cobalt oxides found a peak in oxygen conductivity of 1001 S/cm for La0.3Sr0.CoO 3-_ at 1115K. However, the electronic-transference number for this
compound was found to be only 0.9988 making this a rather ineffective electrolyte. To construct an SOFC from this material, the Lao.3Sr0o.CoO3. could act as a very effective
prevent short-circuiting across the electrolyte. As the perovskite fast-oxygen conductors have typically had high electronic-transference numbers, an alternative material would have to act as the electrolyte with the perovskite abutted at the ends. This could cause numerous problems such as thermal-fatigue or chemical instability, as between yttria-stabilized zirconia and LaSrCoO3.
T (C)
0 1155 977 838 727 636 560 496
... Lao9Sr 1Gao.SMgo0203
CO- Ce0.8Gdo 2 0
2
C -31
--C-o
1
OO/T (K)
Figure 1. 2 Representative data for a number of oxygen ionic conductors with fluorite, pyrochlore, and perovskite structures [16.
We are interested in A2B207 pyrochlore systems because of their versatility. A comparison of the ionic conductivities of more promising representatives from the fluorite, perovskite, and pyrochlore systems is given in Figure 1.2. Fast-oxygen-ion conducting pyrochlore systems have been found for which the same material can display either predominately oxygen-ion conduction or predominately electron conduction with appropriate doping [5,6,22]. This permits the construction of a single-material electrochemical device. Figure 1.3 shows an example of such a construction in which
Gd2Ti20, serves as a template. Chemical substitutions modify the material to create one
electrode viable in an oxidizing environment and another in a reducing environment. The electrodes are separated by an electrolyte stable over the full range of oxygen environments. Another example of such a system is the Gd2(Zr0.25Ti0.75)207 system. The electronic-transference number can be varied from 10-6 to 0.75 at 1273 K by controlling
the doping level. The ionic conductivity of this compound with 2 at% acceptor doping is 10-2 S/cm at 1273 K [23]. This level of conductivity, plus the fact that pyrochlores may be doped on two different sites to cause them to become predominantly electronic or predominately ionic conductors, makes such materials very attractive for application in fuel cells. Devices can be constructed with the advantage of having the same structure and similar chemistry for both of the electrodes as well as the electrolyte.
0
Cathode
Electrolyte
Anode
Gd(Ti, -Ru) 07 (Gd,Ca)2Ti2O7 Gd-(Ti .Mo) 20 7
Figure 1. 3 An illustration of a solid oxide fuel cell composed entirely of modified Gd2Ti20 7 pyrochlore. The spatial dependence of the ionic and electronic transference numbers depends on the corresponding compositional profiling [16].
Titanate pyrochlores, in particular, are also useful for a completely different technology: the disposal of radioactive waste. Plutonium may be immobilized in a ceramic host composed primarily of titanate pyrochlore [24]. Oxygen mobility is of less interest for this application, but the behavior of the crystal-structure at high-temperature is important.
(
A
+in 16 c 3m 000
B4+ in 16d 3m1/21/2 1/2
O
0(1)O
0(2)in 48f mm x 1/8 1/8
in 8a 43m 1/8 1/8 1/8
+ 0(3) in 8b 43m 3/8 3/8 3/8a
1
a2 a2a,
(a)
(b)
Figure 1. 4 (a and b) Projection of the contents of the pyrochlore supercell for 0 _ z : , given in (a). Projection of the contents of the pyrochlore supercellfor Y8 -A _ z _ % + A where A = x -3/4 given in (b). In (b) oxygen ions are drawn with a reduced radius when they are located directly above another oxygen ion. The 0(1) coordinate x = 0.4130 is that of Y2Sn207 and shows a displacement of 0.40 A toward the
0(3) position, a site that is unoccupied in afully ordered pyrochlore structure.
1.3 Pyrochlore Structure
Fast-ion conducting pyrochlore materials having the formula A2B207 are not only of
interest for their technological value, but also for their remarkable physical properties. Of particular interest are disordering phenomena as these may occur in the anion arrangement, the cation arrangement, or both.
The classic oxygen electrolyte, yttria-stabilized zirconia, is of the fluorite structure-type. This Zr+41-y+3,02-y/2 composition has space group Fm3m. Many A2B207 pyrochlores
completely disorder at high temperature and also take on a defect fluorite structure (A,B)0 7/4. The zirconates in particular have been studied extensively with regard to this
order-disorder transition, although no agreement has been reached on exact temperatures for the transition. Transition temperatures of 15300, 22000, and 23000 C have been proposed for Gd2Zr20, Sm2Zr207, and Nd2Zr20, respectively [25]. Uehara et al. [26] set the transition temperature above 16000C for Gd
2Zr20, while Scheetz and White [27] detected no superstructure intensities in the diffraction pattern for this material, despite the fact that their sample was annealed at 14000C. More recently, this phase has been the focus of an in-situ measurement made using x-ray diffraction at elevated temperatures by Meilicke and Haile [28]. They have confirmed that the order-disorder transition temperature for Gd2Zr20 7 lies between 15000 and 15500C.
The ordered pyrochlore type has the space group Fd3m and is a superstructure of the fluorite structure type with a doubled cell edge, Figure 1.4. A large A3' cation and a smaller B4+ ion order, respectively, in alternating rows along <110> in positions 16c at
000 and 16d at 2/2 respectively. Two independent anions, 0(1) and 0(2), occupy sites 48f at x'/' /,and 8a at 1/8l/s. An additional oxygen ion, 0(3), would be present in 8b at %%% in a fluorite array, but the site is normally unoccupied in pyrochlore. This presents a relatively easily accessible interstitial site for the formation of a Frenkel defect.
Some of the first important work in understanding the factors that control ordering in the pyrochlore structure type was done on stannate [29] and titanate [30] pyrochlores by Francois Brisse and Osvald Knop. In their extensive analysis of the stannate series, A2Sn207, they found that the ratio of the ionic radii of the A3 ion to the Sn+4 ion, rather than the chemistry of the A 3 ion, determines whether or not the pyrochlore structure is stable. Specifically they found that the lower limit of the rA+3:rB+4 ratio was 1.40, set by rLu+3:rs,+4 (based on Shannon ionic radii [31,32]), and the upper limit was 1.71, set by rL+3:rsn+4. Additionally, the variable positional parameter, x, for 0(1) was found to
increase with the size of A 3. The A2Ti207 series gave slightly different stability limits for the pyrochlore phase. The lower titanate limit determined was 1.54, set by r(Lu0.6Sc.4)+3:rTi+4, and the upper limit was 1.80, set by rsm+3:rTi+4. Again the positional
We can see a significant difference between the these two stability ranges. Below rA+3:rB+4
= 1.54, the titanate crystallizes in a defect fluorite structure. That is, the cation and anion arrays disorder such that the two independent cation sites found in the pyrochlore superstructure are each statistically populated by the A+3 and B" cations, and the three independent anion sites become equivalent, where each is statistically populated by / 0.2 ion. The stannate, however, still prefers the pyrochlore structure until the radius ratio is less than 1.40. The stannate thus has a stronger preference for the ordered structure than the titanate. Vandenborre et al. have used infrared and RAMAN absorption spectra to probe the nature of the bonding in rare-earth stannate and titanate pyrochlores [33]. They find that the force constants for stretching tin-oxygen bonds are greater than for the titanium-oxygen bonds, and that this increased strength is transferred to the rare-earth to oxygen bonds. They attribute this difference to the greater electronegativity (according to Pauling [34]) of Sn4+ cations relative to that of Ti4+ cations. These observations serve to
indicate that despite the importance of ionic radii, we must not overlook the chemistry of the species when considering the design of a pyrochlore system.
A comprehensive analysis of the known pyrochlore structures was given in 1984 by Chakoumakos [35]. Chakoumakos used a ratio, R, of the average A'3-O2 to B+4-O-2 bond
lengths (as determined by the sum of ionic radii) to find an equation for the 0(1) coordinate x. The bond lengths, also called interatomic distances, relative to the lattice parameter are: AA = AB = BB = /2/4, [1.2] AO(1) = (x2 - x/2 + 3/32)0.5 , [1.3] AO(2)= 4/8, [1.4] BO(1) = (x2 - x + 9/32)0 .5 , [1.5] 0(1)O(1), = (2x2 - 3/2x + 11/32)0.s , [1.6] 0(1)0(1)2 = ,f2(5/8 - x), [1.7] 0(1)0(2) = x - 1/8 , [1.8] 0(1)0(3) = 5/8 - x, [1.9]
where the two distances between 0(1) sites are: 0(1)0(1), for sites sharing an AB edge of the coordination tetrahedra and O(1)O(1)2 for sites neighboring the same 0(3) site. Upon comparison with the crystallographic data for 21 normal pyrochlores, he found this equation to be systematically low by 0.005. We shall therefore add this value to his equation as an empirical factor giving:
x = -0.746846 + 3.63005R - 5.0323R2 + 3.57084R3 - 1.09316R4 + 0.051435R6 , [1.10] where R = (/4AO(1) + 4AO(2)) / BO(1). From this analysis one may now calculate
predicted values for the x coordinate of O(1). A hard-sphere model would suggest that x may be predicted by the AO(1) and BO(1) distances alone, but Chakoumakos reports that reasonable results are obtained only from the weighted average of the A3+-O bond lengths. In a structure field map (Fig. 1.5) he summarized the results of his study for known A2B207 pyrochlores. This map of the mean B+4 versus A+3 radius of structurally-characterized pyrochlores has contour lines of the statistical prediction for the lattice parameter and x coordinate. This is a very useful tool for predicting two important structural parameters for a pyrochlore yet to be characterized. Other useful stability field maps as a function of cation radii for A2B207 pyrochlores are found in several sources
[36,6,2,5,22]. The most extensive review of pyrochlore materials that we are aware of, that of Subramanian et al., includes a more comprehensive stability map [37].
Although the ideal pyrochlore phase has a 1:1 ratio of A3' to B4+ cations, small deviations from this stoichiometry do not generally result in complete disordering of this phase. Diffraction studies of quenched specimens from the yGdO1,5-(1-y)ZrO2 system have shown that the pyrochlore phase is stable at 15000C between y of 0.45 and 0.55 [38,39]. Some evidence for an extended region of pyrochlore stability to y of between 0.33 and 0.60 has been found. The samples displayed broad super-structure peaks [40,41,42], which have been attributed to domains of the pyrochlore phase with small dimensions.
2 0.85 b 0.80 *"-S0.75 oe - -o 0.70* 0 **0 go 0.35 O 0.8 0.9 1.0 1.1 1.2 1.3 1.4 . 1.5
Mean radius of A cations (X)
Figure 1. 5 Structure field map ofA3+ cation radius versus B4+ cation radius contoured with values of the lattice constant, a, 0(1) coordinate, x, and radius ratio, rA/rB. The ionic radii of Shannon [31] are used
[34].
1.4 Ionic Conductivity for the Y
2(SnyTily)
207, Gd
2(SnyTil-y)
20
7,
Y2(ZryTil-y)20 7, and (YlyCay)2Ti2O7 Pyrochlores
It is useful to review the results that have been obtained previously for the ionic conductivity, oi, of the systems of interest in the present thesis. In recent work by Tae-Hwan Yu the conductivities of the Y2(SnyTil.,)207 and Gd2(SnTi.y)207 phases have been thoroughly characterized [5,43,44]. The conductivities for the Y2(ZryTi1-y)207, and (Y,-yCay)2Ti20 7 were similarly characterized previously [3,6,22]. Impedance spectroscopy experiments were carried out on sintered bar samples at elevated-temperatures and in controlled oxygen partial-pressures, P02. The results were
interpreted by consideration of a defect model which predicted a P02 independent plateau in conductivity as a function of P0 2, that is due solely to ionic conduction.
The general expression for ionic conductivity is,
,
= exp :i[1.11]
T I kT
where ao =(4e 2od 2No exp[S,,/k]KF)2)/k, [1.12]
and y= geometrical factor e = elementary charge
v= ion-jump attempt frequency d= jump distance
NO = oxygen site concentration Sm = migration entropy
KFO = pre-exponential factor of the Frenkel constant
k = Boltzmann constant [45].
The activation energy term Ei includes both a contribution from the enthalpy of Frenkel defect formation and from the migration enthalpy in an intrinsic material: Ei = EF/2 +
Em. When an ionic conductor has been doped to a sufficiently high degree, the material
becomes an extrinsic conductor where Ei no longer has a contribution from the enthalpy of Frenkel defect formation. In this regime, defects compensating for the charge introduced by the aliovalent substitution of the dopant, oxygen vacancies [Vo"], overwhelm those produced by a Frenkel reaction: 00 = Oi" + Vo". At high levels of doping oxygen vacancies begin to associate with the dopant ions, effectively diminishing the concentration of oxygen vacancies involved in ionic conduction.
-2.0 -2.5 -3.0 -3.5 -4.0 -4.5 -5.0 * l I -I - I ] 0.58 0.60 0.62 0.64 0.66 0.68 0.70
Cation Radius Ratio rear A of A2B207
Figure 1. 6 Variation of the ionic conductivity of Y2(SnyTil.)207, Gd2(SnyTil.)207 and the Y2(ZrTil .,207 at 10000
C. The systems are plotted against the unified scale of cation radius ratio rA/rB of A2B207, where rB = yrSn + (1-y)*rTi for the stannate systems and rB = y-rZr + (1-y)'rTi for the zirconate system. The conductivity of the stannate systems is generally similar, while that of the zirconate is significantly greater.
0.58 0.60 0.62 0.64 0.66 0.68 0.70 Cation Radius Ratio rE/rA of A2B207
Figure 1. 7 Increase with temperature of the pre-exponential factor for ionic conductivity of the Y2(SnyTil-y)207, Gd2(SnyTil-y)207 and the Y2(ZryTil-y)207 at 1000*C. The systems are plotted against the unified scale of cation radius ratio rA/rB of A2B207, where rB = y'rSn +
(1-y)orTifor the stannate systems and rB = Y-rZr +
(1-y)*rTi for the zirconate system. The factor is reasoned to be greater for systems with a greater
degree of disorder. 1.6 1.4 1.2 1.0 0.8 0.58 0.60 0.62 0.64 0.66 0.68 0.70 Cation Radius Ratio r/rA of A2B207
Figure 1. 8 Increase with temperature of the activation energy for ionic conductivity of the Y2(SnyTil.y)207, Gd2(SnyTil-y)207 and Y2(ZryTil-y)207 systems. The systems are plotted against the unified scale of cation radius ratio rA/rB of A2B207, where rB = rSn + (1-y)*rTi for the stannate systems and rB = y*rZr + (1-y)rTi for the zirconate system. The activation energy of the stannate systems increases in a similar fashion, while that of the zirconate remains relatively constant.
The ionic conductivities determined for the stannate substitution series were qualitatively similar and generally less than those of for the zirconate substitution series. Figure 1.6 shows that the variation in ionic conductivity with Sn4' substitution at 10000C is not great for either the Y2(SnyTil-y)207 and Gd2(SnyTi.y,)2O,. It is maximum at an intermediate composition for both samples, and generally decreases at high Sn4 concentration. In both cases this has been rationalized by a concurrent increase in Ei and a0 with
increasing y (Figs. 1.7 and 1.8). The primary difference between the two solid-solution series is that ar0 is an order of magnitude greater for a given level of Sn4 substitution for the yttrium based system. Yu has attributed this difference to the greater disorder in the Y2(SnyTil.) 207 system. This was expected since the yttrium based system has rA+3:rB+4
closer to the lower limit for pyrochlore stability stated by Brisse and Knop [29], below which complete disorder is predicted. This prediction is born out for the Zr4+
substitution-series where the onset of complete disorder was set at y = 0.9 by Heremans [1,2]. As a result, ao is generally much greater for the zirconates than the stannates. The
increase in disorder with y is reasoned to manifest itself as an increase in [Vo"] at all temperatures, which is equivalent to an increase in KFO in equation 1.12, above. At high
Sn4+ concentrations, the systems display decreased r
i as a result of increased Ei, while for high Zr4+ concentrations, ai is approximately constant as a result of a more modest increase in Ei.This activation energy is believed to be dominated by Em for y > 0.4, thus the increase in Ei represents a decrease in oxygen vacancy mobility. It is further reasoned that the limited polarizability of the Sn4+ ions with respect to the highly polarizable Ti4+ ions is largely responsible for the decreased mobility of charge carrying Vo'" with Sn4+
content, with reference to simulations done by Catlow [46,47]. The more modest decrease in mobility of Vo'" with Zr4+ content is rationalized as resulting from defect association or loss of the optimal pathways caused by cation disorder [6]. At y < 0.3, the ionic conductivity for the Y2(ZrTi1.. )207 system is believed to result from extrinsic control.
1.5 Relationships Between Structure and Ionic Conductivity in
Pyrochlore Systems
Structure-property relations are at the heart of materials science. A particularly vivid illustration of such a relationship is that between crystal-structure and diffusivity or, in our particular case, between state of disorder and conductivity. A mental picture of oxygen-ions hopping into an equivalent vacant site through a bottle-neck arrangement of cations is easily visualized. Experimental measurements of conductivity may be rationalized by consideration of the vacancy population and the geometry of the relatively immobile cation array. An excellent example of such a correlation between structure and conductivity is given by Wuensch and Schioler for the NASICON system Na+yZr2SiyP3,Ol2 [48]. In this system, a window described by oxygen ions between neighboring sodium sites increases and then decreases in diameter with increasing sodium content. The maximum in ionic-conductivity coincides with the Na' content for which the window diameter exactly matches the ionic radius of sodium. An extensive account of other structure-to-conductivity correlations is given by Cava [49].
The oxygen ion conductivity, ao, is given by the sum of the oxygen vacancy and interstitial conductivities, however the 0(3) interstitial does not make a significant contribution in pyrochlores. Formally, oai is the product of the concentration of charge carriers [Vo"], their charge, 2q, and their mobility Rv. Thus cr, = [Vj" ]2q ,. We are
interested in tailoring the crystal structure to maximize [V*"] and jgv.
The oxygen vacancy concentration may result from the charge compensation of an aliovalent dopant, from oxidation or reduction, or from intrinsic Frenkel disorder. The Frenkel disorder is written as, Qo = + VJ', with an equilibrium constant K, = [Vj ][O
]
= KFo exp(-EF / kT). The Arrhenius constant, EF, is related primarily to the elastic strain and Coulombic energy introduced in the structure on formation of the vacancy/interstitial pair. Additionally, a vacancy bound to a static interstitial plays no role in conduction, thus a term for the binding energy of the pair may be included in the effective formation-energy, E, in consideration of the Frenkel-defect that may play a rolein ionic-conduction. One of the important early studies modeling this energy [50] predicted that the Gd2Zr20 7 Frenkel defect consisted of a pair vacancies on two
neighboring 48f sites plus an interstitial on the 8b site with E, = 1.76 eV. A more recent examination of this defect considered the probabilities of finding an oxygen ion or a vacancy occupying each type of tetrahedral cation-hole, the corners of which are defined
by four Zr+4, four Gd+3, two Zr+4 and two Gd+3, three Zr+4 and one Gd+3, and three Gd+3
and one Zr+4. This confirmed the 48f vacancy 8b interstitial pair as the most important
Frenkel defect, but also found that the probability of finding this defect correlates strongly with the degree of cation anti-site disorder [4]. As cation disorder increases in this system, so too should anion disorder. Clearly, a fully-disordered A2B207 defect
fluorite structure contains the greatest concentration of intrinsic oxygen vacancies.
The high level of oxygen vacancies in the defect fluorite structure comes at a price, however, in vacancy mobility. The thermal dependence of the mobility of the oxygen vacancy depends primarily on the enthalpy of migration. This is related to the size, stiffness, and coulombic repulsion at the bottle-neck in the conduction path. Van Dijk et al. also examined this problem using pair-potentials including a shell-model for ion-ion interactions [50]. The result of their calculations indicate that the primary oxygen conduction path is based on 48f-48f jumps through the A-B tetrahedral edge. The calculated barrier energy to this jump is 0.9 eV for the Gd2Zr20 7 system, which compares
very favorably with the barrier energy extracted from conductivity measurements [6]. Very recently Wilde and Catlow report static lattice energy minimization calculations and molecular dynamics simulations that confirm the previous results of Van Dijk et al. They find that gadolinium titanate, which is fully ordered, has a much lower migration enthalpy than the corresponding partially-disordered zirconate. But they also demonstrate that in
intrinsic systems the formation energy for Frenkel defects dominates the thermal dependence of conductivity [51,52]. Thus Gd2Zr20, is a better conductor than Gd2Ti20,.
Heremans has shown an excellent qualitative agreement between ionic-conductivity and vacancy concentration on the 0(1) site for the Y2(ZrTi-y)207 system (Fig. 1.9). Aside
composition, the magnitude of the conductivity should be proportional to the product of the charge-carrier density and the number of vacant sites to which the charge carriers may jump. This product is N(1-N) where N is the site occupancy of 0(1) determined by Heremans using Rietveld analysis of neutron-diffraction data. One key materials parameter, the activation energy for ionic conduction, remains relatively constant with zirconium substitution for this solid-solution series.
I
E
OCna
-1
m 00
O 010-2
10-4
10
- 6
10-8
0
0.2
0.4
0.6
0.8
1.0
y
in Y
2(ZryTil.y)2
07
Figure 1. 9 Ionic portion of the electrical conductivity of Y2(ZryTil-y)207 as a function of temperature and the atomic fraction, y, of Zr4+ substituted for Ti4+. The variation of the product of charge-carrier concentration and vacancy concentration N(1-N) is included in the plot, where N is taken as the site occupancy of the 0(1) site at 48f The change of this product with y provides a qualitative explanation for the relative dependence of conductivity on composition.
0
1c
1.6 Synthesis Routes: Liquid Mix (Pechini) and Solid-State Reaction
Two synthesis routes were used and compared in research described in this thesis: liquid-mix and solid-state reaction routes. In the solid-state reaction route, powders of oxide or carbonate precursors were mixed together in stoichiometric proportion. The mixture was then ground with an agate mortar and pestle until it was fine enough to pass through a 0.75gtm sieve. The resulting powder was heated in an alumina crucible to greater than
10000C for between 12 to 24 hours. Often the quality of the powder after one heating
was not satisfactory due to evidence from x-ray diffraction of either a small portion of a minor phase in addition to the pyrochlore phase or broad superstructure maxima. Thus the powders were typically ground again, and heated for another 12 to 24 hours. The
details for each system are given in the respective chapters.
The liquid-mix route was first developed by Pechini in 1967 [53]. It has been used for some years in the synthesis of pyrochlore compounds [6,22,5]. The Pechini process is believed to produce phases having multiple cations with relative homogeneity resulting from the near atomic-scale mixing. Metal-organic precursor compounds are dissolved in a citric acid-ethylene glycol mixture. Polybasic chelates are formed from the metal-organic compound and the citric acid. Stock solutions of metal-citrates were made for each component metal and assayed. The solutions were mixed together in appropriate proportions to produce the pyrochlore stoichiometry of interest, forming a new solution by mixing for several hours at -1000C. Upon modest heating below 2000C, excess
alcohol was driven from the solution and the chelates underwent polyestherification. The resulting polymer resin is believed to contain the metal atoms bonded through oxygen to organic radicals comprising a cross-linked network. The resin was charred at 5000C for 12 hours to burn off the organic material and form a powder. The resulting powder was typically comprised of sparkling flakes of about 1 mm in width, but very much thinner than 1 mm. This powder generally was within 10% of the expected mass, the excess assumed to be remaining organics. X-ray diffraction always showed that this powder was amorphous. The powder was calcined above 10000C to form pyrochlore. This heating