HAL Id: hal-02053144
https://hal-amu.archives-ouvertes.fr/hal-02053144
Submitted on 1 Mar 2019
HAL is a multi-disciplinary open access
archive for the deposit and dissemination of
sci-entific research documents, whether they are
pub-lished or not. The documents may come from
teaching and research institutions in France or
abroad, or from public or private research centers.
L’archive ouverte pluridisciplinaire HAL, est
destinée au dépôt et à la diffusion de documents
scientifiques de niveau recherche, publiés ou non,
émanant des établissements d’enseignement et de
recherche français ou étrangers, des laboratoires
publics ou privés.
Distributed under a Creative Commons Attribution| 4.0 International License
Sampling the protonation states: the pH-dependent UV
absorption spectrum of a polypeptide dyad
Elisa Pieri, Vincent Ledentu, Miquel Huix-Rotllant, Nicolas Ferré
To cite this version:
Elisa Pieri, Vincent Ledentu, Miquel Huix-Rotllant, Nicolas Ferré. Sampling the protonation states:
the pH-dependent UV absorption spectrum of a polypeptide dyad. Physical Chemistry Chemical
Physics, Royal Society of Chemistry, 2018, 20 (36), pp.23252-23261. �10.1039/cXCP00000x/�.
�hal-02053144�
Sampling the protonation states: pH-dependent UV
absorption spectrum of a polypeptide dyad
†
Elisa Pieri,∗aVincent Ledentu,aMiquel Huix-Rotllant,aand Nicolas Ferré∗a
When a chromophore interacts with several titratable molecular sites, the modeling of its photo-physical properties requires to take into account all their possible protonation states. We have developed a multi-scale protocol, based on constant-pH molecular dynamics simulations coupled to QM/MM excitation energy calculations, aimed at sampling both the phase space and protona-tion state space of a short polypeptide featuring a tyrosine–tryptophan dyad interacting with two aspartic acid residues. We show that such a protocol is accurate enough to help in the interpreta-tion of the experimental tyrosine UV absorpinterpreta-tion spectrum at both acidic and basic pH. Moreover, it is confirmed that radical tryptophan probably contributes to the peptide spectrum, thanks to a UV-induced electron transfer from tyrosine to tryptophan, ultimately shedding light on the complex pH-dependent behavior of the peptide spectrum.
1
Introduction
The classical atomistic modeling of a biological molecule like a polypeptide, a protein or a DNA double helix usually involves a converged sampling of its configuration space, i.e. atom po-sitions and velocities. Molecular dynamics (MD) simulations, in which trajectories are generated by solving classical Newton equations, are clearly among the most popular available methods and take benefit of continuous improvements on both the soft-ware (eg replica-exchange, accelerated MD) and hardsoft-ware sides (GPUs, Anton)1–4. A typical MD simulation starts with some
re-quired input parameters: the force-field defining the atom-atom interaction energy and a set of atom coordinates and velocities used as initial conditions. The latter geometrical parameters are commonly obtained from available experimentally derived structures, often by means of X-ray diffraction or NMR spectro-scopies5. However, no information is usually found regarding the distribution of the protonation states of titratable moieties like as-partic acid, lysine side-chains and similar in a protein. Hence the model needs to be complemented by an educated guess of these protonation states.
Most of the times, the protonation state of a titratable moiety is determined by comparing its pKa with the pH of the system.
Of course, experimental pKa are macroscopic values which can
barely be attributed to a given titratable site in a molecular system featuring several, and possibly interacting, sites. Hence empirical
aAix-Marseille Univ, CNRS, ICR, Marseille, France. Fax: +33 491288758; Tel: +33 413550532; E-mail: elisa.pieri@univ-amu.fr, nicolas.ferre@univ-amu.fr
† Electronic Supplementary Information (ESI) available: details of system setup and MD parameters. Simulation timings. Convergence of pKaand statistical analysis of
the trajectories. See DOI: 10.1039/cXCP00000x/
methods have been developed to give a quick and rough estima-tion of effective microscopic pKavalues for all the titratable sites
in a system. For instance, the PropKa approach6uses an available
3-dimensional structure to estimate amino-acidic pKavalues in a
protein. More accurate methods based on continuum electrostat-ics can routinely be applied to various biomolecular systems.7–10 On the other hand, the recently developed constant-pH molec-ular dynamics (CpHMD) method11–14 has been especially
de-signed to sample the protonation states of titratable amino-acids as a function of pH. Roughly speaking, this method introduces a Metropolis-based probability eventually allowing to change pro-tonation states during the course of a normal MD simulation. This method has been shown to efficiently sample both the phase space and the protonation state space at the same time, given that suf-ficiently long trajectories are produced. Ultimately, the CpHMD simulations result in accurate pKapredictions15.
Instead of using this information to decide on the most prob-able protonation states of the titratprob-able sites, the same CpHMD trajectories can be exploited to give access to an ensemble of structures featuring a probability distribution of the protonation states at a given pH value, in agreement with the computed pKa
values. Furthermore, this ensemble can be used to calculate in a second step any molecular property whose value depends on the pH. This is precisely the target of the present study, in which the pH-dependent UV absorption spectrum of a small polypep-tide is simulated for the first time. In such a case, the properties of interest (vertical excitation energies and oscillator strengths) have to be evaluated by a quantum mechanical method coupled to an approximate description of the interactions between the chromophore and its environment (QM/MM)16. To the best of
our knowledge, all the QM/MM models reported in the literature assume a single and constant (i.e. most probable) distribution of the protonation states (which will be called microstate in the following). In other words, the calculated molecular property is somehow biased towards this particular microstate.
The here-proposed CpHMD-then-QM/MM work-flow can be seen as the generalization of the routine MD-then-QM/MM ap-proach17–19, used when (classical) nuclear motion contributions to a given molecular property are needed. The successful applica-tion of such a work-flow relies on a statistically meaningful selec-tion of snapshots along the MD trajectory. Moreover the number of such snapshots has to be large enough to ensure the conver-gence of the property averaged value, i.e. with a reasonable stan-dard deviation. In the case of the CpHMD approach, reaching such a convergence is certainly more involved than in standard MD, since the phase space is complemented with the protonation state space13.
The subject of our study is a β -hairpin 18-mer, named Peptide M, designed by Barry et al.20 and containing two UV-absorbing chromophores: tyrosine (Y5) and tryptophan (W14). The ultra-violet absorption spectrum features a dependency upon the pH value: the trace obtained by subtracting the tryptophan spectrum (recorded in water) from that of Peptide M (i.e. the Y5 spectrum) is always dominated in the 250-to-350-nm region by the π − π∗
transitions of the phenol ring, but the λmaxundergoes a red-shift
from ∼ 283 nm at pH=5 to ∼ 292 nm at pH=11. There is also an additional red-shift of a few nm at pH=5 with respect to tyro-sine in water. Quoting20, "the red shift of the tyrosine ultraviolet spectrum in Peptide M is attributable to the close proximity of the cross-strand Y5 and W14 to form a Y5-W14 dyad." It is rightful,
Y5
W14
292 283 276D3
D11
Fig. 1 Peptide M structure and experimental UV absorption spectra (in
nm)20of Y5 in Peptide M at pH=5 (red) and pH=11 (blue).
being the experimental pKa of the tyrosine side chain in water
∼ 10.921, to attribute this behavior to the deprotonation occur-ring at basic pH; however, the presence of two other titratable residues, aspartic acids D3 and D11, contributes to the complex-ity of the protonation microstates landscape. The small size of the
peptide and the limited number of titratable amino-acids make this system the ideal case study for the development and testing of our method.
Besides the protonation states of the three titratable residues (D3, Y5 and D11), the proximity of the two chromophores (Y5 and W14) may result in complex interactions, e.g. charge trans-fer or excitonic coupling, which would also contribute to the pep-tide UV absorption spectrum. Hence, it is useful to summarize the experimental and theoretical results already available20,22.
In the former, several spectroscopic techniques have been used to characterize the peptide M. Besides the UV absorption spectra obtained at pH=5 and pH=11, NMR, ECD, EPR, UV Resonance Raman investigations have been also reported. The gathered in-formation suggest: (i) the persistence of a β -hairpin structure, featuring a co-facial alignment of Y5 and W14 side-chains and a hydrogen bond between Y5 and R16; (ii) the existence of an ex-citonic coupling via a dipole-dipole interaction; (iii) the presence of radical tyrosine resulting from an electron transfer from Y5 to W14; and (iv) the indication of a charge transfer involving the radical dyad.
On the theoretical side22, MD simulations of different, but very close, peptides have been reported. Actually, in the so-called peptide A and peptide C, either histidine (peptide A) or cyclo-hexalanine (peptide C) replace tryptophan at position 14. Pro-tonated (neutral), deproPro-tonated (anionic) and radical states of tyrosine have been considered thanks to different sets of atomic point charges. While the β -hairpin-like motif is conserved (2 to 4 hydrogen bonds) when tyrosine is protonated or deprotonated, it is no longer the case with radical tyrosine which evolves to a random coil after 70 ns of simulation. Changes in microsolvation around tyrosine radical having been suggested for being respon-sible for such a behavior. It should be noted that the reported partial charges used to parametrize the forcefield actually indi-cate a phenol C-O bond dipole reversed in the radical state, with respect to both the neutral and anionic forms.
In the following, we briefly present some details regarding the CpHMD and QM/MM models we used in the present study. Then we describe the procedure to obtain the spectrum of peptide M at different pH values. We analyze the effect of the populated microstates before to conclude on the tyrosine protonation and electronic states as the main responsible for the experimentally observed λmaxshifts.
2
Models and computational details
2.1 QM MethodQuantum mechanical investigations on the tyrosine-tryptophan heterodimer (as well as the corresponding monomers) have been performed at the B3LYP/6-31G* level of theory, using the Gaus-sian16 package.23The geometry of the dimer corresponds to the
average structure coming out of the NMR experiments by Pagba et al.20In the case of monomers, structures have been optimized to the minimum energy structure of the ground and the bright-est excited state, using Time-Dependent DFT (TDDFT) and the Tamm-Dancoff approximation (TDA) in the region from 240 nm to 300 nm in the gas phase. All minima have been confirmed
with normal mode analysis. In all cases, frequencies have been scaled by a factor of 0.96.24Vibrationally resolved spectra have been computed for monomers using the Herzberg-Teller approx-imation in the time-independent approach.25,26 The vibrational spectra have been broadened with a half-width at half-maximum of 500 cm−1.
2.2 CpHMD and MD Methods
We carried out the CpHMD method simulations in explicit solvent using a discrete protonation state model as presented by Roit-berg et al.13and implemented in the AMBER16 software suite27.
In this method, the standard molecular dynamics steps are per-formed in explicit solvent, and periodically interspersed with at-tempts to change the protonation state in GB implicit solvent, which avoids the problem of the solvent molecule orientation; these attempts are regulated by a Metropolis Monte Carlo ap-proach. After a successful protonation state change, which is handled by changing the charges on each atom of the residue according to the designed force field (AMBER ff14SB28), the sol-vent molecules and non-structural ions are restored and relaxed, keeping the solute frozen; then, the velocities of the solute atoms are recovered, allowing the standard dynamics to continue.
For this type of calculation, we made use of the replica ex-change technique applied along the pH-dimension (pH-REMD), in order to enhance the sampling capabilities and get an accept-able convergence12,29 in the given time. Our simulations were carried out using periodic boundary conditions and with a total length of 40 ns, which we considered a good compromise be-tween accuracy in the convergence and computational time; we used 8 pH-replicas, spanning from pH 3 to pH 6 and from pH 9 to pH 12 with one pH unit as interval. More details are provided in Supplementary Informations.
For the single microstates trajectories, we used the tempera-ture replica exchange technique (T-REMD), aiming at overcoming small energy barriers and therefore exploring exhaustively the po-tential energy surface; we chose 6 temperature values from 260 and 360 K, with a 20 K interval.
Finally, in order to further sample the configuration space, we performed a regular MD simulation of peptide M in its most prob-able protonation state at pH=5 for half a microsecond and ex-tracted 250000 snapshots for analysis purposes.
2.3 QM/MM Method
We extracted 10000 equally spaced snapshots from the trajecto-ries at pH 5 and 11, and coupled each frame to the corresponding protonation microstate (either protonated or deprotonated). This data allowed us to get a spatial distribution of point charges. We chose the tyrosine phenol as QM subsystem, inserting a hy-drogen link-atom between Cβ and Cγ, and calculated the elec-trostatic potential acting on each QM atom using a direct sum approach over regularly spaced images of the primitive cell used in the MD simulations. 73image boxes ensure the convergence of
the electrostatic potential. In the case of an electrically charged system with total charge qt, we neutralized each image by
plac-ing a −qt charge at its center. In other words, the electrostatic
potential experienced by the QM subsystem originates from the (charged) primitive cell and from neutralized images. Electro-static embedding of the QM subsystem is realized thanks to the ESPF method30, as implemented into our local version of Gaus-sian0931.
The λmax and oscillator strengths for the first four excited
states were calculated using the Gaussian09 package31 at the TDDFT/TDA B3LYP/6-31G* level of theory; this choice is justified by the aim of seeking qualitative and not necessarily quantita-tive accordance with the experimental data. More involved calcu-lations using multi-configurational multi-reference wavefunction theory for QM or polarizable forcefield for MM would improve the accuracy of the pH-dependent simulated spectra, however at a computational cost which would be prohibitive for tens of thou-sands of vertical excitation energy calculations.
2.4 Spectrum Elaboration
The absorption spectra were generated at room temperature with normalized Lorentzian functions from the excitation energies for the first four excited states and the corresponding oscillator strengths using Newton-X 2.032,33, which adopts the nuclear
en-semble approach34. Data of the experimental spectra published in20have been kindly provided by Prof. Barry35.
3
Results
3.1 The tyrosine-tryptophan dyad
In their report, Barry et al20indicate that Y5 and W14 are inter-acting: "the red shift of the tyrosine ultraviolet spectrum in Peptide M is attributable to the close proximity of the cross-strand Y5 and W14 to form a Y5-W14 dyad." As a matter of fact, the UV absorp-tion spectrum of Y5 is perturbed at pH=5, but not at pH=11, with respect to the reference spectrum in water. Together with other spectroscopic arguments, these perturbations are interpreted as the signature of the formation of a dyad. Actually, their close proximity may promote a photoinduced electron transfer between tyrosine and transient radical tryptophan,36,37which pK
ais below
5.38Assuming that W14 can be oxidized by the UV laser used in the experiment20to form the radical form that we will denote W·+ in the following, it can then react with protonated Y5
(de-noted Y−OH in chemical reaction 1) at pH=5 or deprotonated Y5 (denoted Y−O– in chemical reaction 2) at pH=11.
W·++ Y−OH −−*)−− W + Y−O·+ H+ (1)
W·++ Y−O−−−*)−− W + Y−O· (2)
Whatever the pH value, these chemical reactions result in the gen-eration of radical tyrosine which spectroscopic signature may be significantly different not only from the neutral (protonated) Y5 one, but also from the anionic (deprotonated) Y5 one.
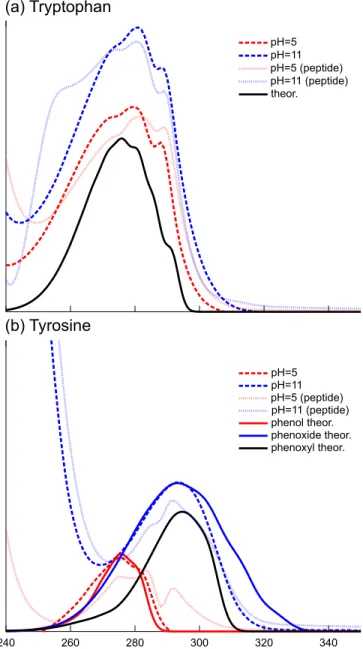
In order to disentangle pH effects from Y5–W14 interaction ones, we first report results from the absorption spectra of the chromophoric moieties of tryptophan and tyrosine in different protonation states in the 240 to 340 nm energy window as re-ported experimentally20 (see Figure 2.) The experimental
theoretical spectra of indole and phenol, either protonated (tyro-sine most abundant form at pH=5), deprotonated (tyro(tyro-sine most abundant form at pH=11) or radical.
Theoretical spectra qualitatively reproduce the order and shape of the main transitions, although they are displaced by 6-33 nm with respect to experiments. This is because the theoreti-cal simulations do not include solvent effects or the side chain of aminoacids. For the sake of comparison, the band maxima for the theoretical spectra has been shifted to match the exper-imental maxima of aminoacids. The spectrum of indole (253 nm) has been shifted by 23 nm (tryptophan, exp. 276 nm), the spectrum of phenol (242 nm) has been shifted 33 nm (tyrosine pH=5, exp. 275 nm) and the spectrum of phenoxide anion (287 nm) has been shifted 6 nm (tyrosine pH=11, exp. 293 nm). The spectrum of the phenoxyl radical (266 nm) has been shifted 29 nm to the experimental value of phenoxyl at cryogenic tempera-tures (exp. 295 nm),39as information of tyrosyl radical in solu-tion is not available. The intensities of all theoretical spectra have been decreased (keeping the ratio between the different peaks) to match the experimental intensity of tyrosine spectrum in solution at pH=11.
The vibrationally resolved theoretical spectrum of indole matches well the three peak structure of experimental tryptophan spectra, both at acidic and basic pH. Indeed, the indole ring re-mains protonated in both cases. The three peak structure involve in-plane vibrations involving the N1-C7a stretching (729, 1158 and 1407 cm−1). The tryptophan spectra in the peptide is
essen-tially equivalent to its spectrum in water. Accordingly, the cou-pling with the tyrosine residue is weak enough to remain hidden in the vibrational broadening.
At variance with tryptophan, the tyrosine absorption spectra features strong dependence on the pH. At pH=11, the tyrosine is deprotonated in water. The corresponding absorption spectrum matches well with the theoretical spectrum of the phenoxide an-ion, with a single broadened peak with little vibrational structure. The spectrum of tyrosine in the peptide M shows essentially the same band maximum, with a larger vibrational resolution. We cannot exclude the involvement of the radical phenoxyl form. However its contribution would be probably hidden in the phe-noxide spectrum, due to the very similar absorption maxima. At acidic pH, the phenolic form can also coexist with the phenoxyl radical. The theoretical spectrum of phenol matches the spectrum of tyrosine at pH=5, showing a double peak vibrational shape, which origins from in-plane stretchings of C−O(H) and the ben-zene ring (810 and 981 cm−1). However, the tyrosine spectrum in the peptide features a dissimilar structure, showing a peak at 292 nm. In Ref.20, this peak was attributed to excitonic coupling. From our simulations, we cannot exclude that this peak origins from the presence of a non-negligible concentration of phenoxyl radical at acidic pH.
In order to determine the excitonic coupling strength between tryptophan and tyrosine, we compare the theoretical absorption spectrum of the dimer with respect to the monomers (see Tab. 1). We consider three dimers consisting of either phenol, phenoxide anion or phenoxyle radical with tryptophan. In this comparison, we only take the vertical electronic transition, as the vibrationally
240 260 280 300 320 340 pH=5 pH=11 phenol theor. phenoxide theor. phenoxyl theor. pH=5 (peptide) pH=11 (peptide) pH=5 pH=11 theor. pH=5 (peptide) pH=11 (peptide)
(a) Tryptophan
(b) Tyrosine
Fig. 2 Vibrationally resolved theoretical spectra for phenoxyl, phenoxide,
phenol and indole, together with the experimental spectra at different pH values20. Theoretical spectra (full lines) has been shifted to match the
experimental band maxima. Dashed lines: spectra in water. Dotted lines: spectra in peptide M
resolved approach cannot simply be applied to the dimer due to a lack of excited state structural reference close enough to the ground state. From these results, we can infer that the excitonic couplings remain small, introducing shifts of 5 nm on average. Therefore, we suggest that the extra peak appearing in the tyro-sine spectrum in the peptide M at pH=5 is due to the presence of tyrosyl radical. At pH=11, the same peak would strongly overlap with the anionic one. Of course, these results essentially come out of gas phase calculations. This is the reason why we now pro-ceed with results obtained i) tyrosine in water and ii) tyrosine in peptide M in water.
Trp-Phenol Trp-Phenoxide Trp-Phenoxyl
Trp 271 (265) 270 (265) 275 (265)
Tyr 242 (244) 348 (353) 264 (269)
Table 1 Excitation energies for the three heterodimers (in nm) compared
to the same monomer excitations (in parenthesis).
3.2 Aqueous tyrosine absorption spectrum
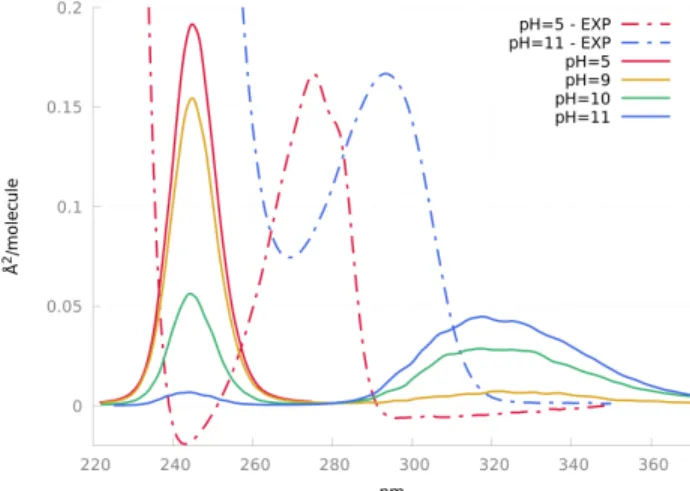
As a first test of our CpHMD-then-QM/MM protocol, we have cal-culated the absorption spectra of tyrosine amino-acid in water at pH=5, 9, 10 and 11. The experimental pKaof tyrosine side-chain
is about 10. Accordingly, the calculated spectra change from a single band around 245 nm, corresponding to neutral tyrosine, to two bands with maxima at 245 nm and 318 nm, the latter being the signature of the tyrosine anionic form, which inten-sity increases with the pH. Conversely, the inteninten-sity of the neutral spectrum decreases with the pH. Of course, the calculated spectra
Fig. 3 Experimental20 and calculated spectra of tyrosine in water at
different pH values
are shifted with respect to the experimental ones, similarly to the gas phase vibrationally-resolved spectra reported in Section 3.1. Again, these shifts are mainly due to the low level of theory used to describe the tyrosine vertical excitations. There is now a 30 nm blue-shift for neutral tyrosine and a 27 nm red-shift for its anionic form. Even if exaggerated, the neutral-to-ionic red-shift is repro-duced by our calculations. It demonstrates that the protonation state populations produced by CpHMD simulations are converged enough to catch the principal trend.
3.3 The peptide M structure
According to Pagba’s RMN analysis20, the peptide M adopts a sta-ble β -hairpin structure at pH=5. We first tested the ability of the chosen forcefield to reproduce this preferred conformation by an-alyzing a 500 ns long MD trajectory of peptide M (D3 and D11 deprotonated, Y5 protonated) in explicit water solvent. Accord-ing to Figure 4, the peptide M structure is characterized by a turn involving residues N9, G10 and D11, which is connected to an anti-parallel β -sheet that expands to Y5 and I15 most of the time. Even if the β -sheet sometimes expands until R16, this event
re-mains quite scarce. Indeed, the average distance between R16 (NεH) and Y5 (O) is 15.2 Å with a standard deviation lower than 3 Å. This distance is much larger than the value reported exper-imentally (8.2 Å). On the other hand, the experimental distance (6.4 Å) between Y5 (O) and W14 (NH) is correctly reproduced in our simulation (7.1 ± 2.0 Å on average, 6.3 Å in the case of the most abundant cluster centroid, see Figure 5).
Fig. 4 Secondary structure analysis of the 500 ns trajectory (S: bend; T:
turn; I: π(3-14) helix; H: α-helix; G: 3-10 helix; B: anti-parallel β -sheet; E: parallel β -sheet; C: random coil).
Fig. 5 Centroid structure of the principal cluster, highlighting the Y5–W14
distance.
The nature of peptide M principal secondary structure can be assessed by the number of hydrogen bonds connecting its com-posing residues. As shown in Figure 6, 3 to 4 hydrogen bonds exist on average, taking place mainly in R4–I15, R6–I13, R8–D11
pairs of residues. The resulting structural information clearly
in-Fig. 6 Histogram analysis of the number of hydrogen bonds structuring
the peptide M.
dicates that the simulated peptide M keeps a β -hairpin geometry, even if the peptide tails are somehow randomly oriented, at vari-ance with the available NMR data20.
3.4 Microstate populations
Titration curves for all titratable residues in the system are the first useful information coming out from CpHMD simula-tions. Their shapes not only give qualitative informations re-garding the convergence of the simulations, it also may indicate non-Henderson-Hasselbalch40,41behaviors possibly arising when
titratable sites are strongly interacting. In the case of Peptide M (Figure 7), we first produced 12 ns long trajectories for pH ranges 3–6 and 9–12. The smooth sigmoidal shape of the 3 titration curves corresponding to D3, Y5 and D11 is a good indication of a converged exploration of both the phase and protonation state spaces. Because the sigmoidal shape does not always imply that
Fig. 7 Titration curves (deprotonated fraction as a function of pH) from
CpHMD trajectories for the three titratable residues D3, Y5 and D11 in Peptide M.
the corresponding titratable sites are non-interacting with other ones42, we have performed Hill fitting40,43of the titration curves, resulting in Hill factor nhequal to 0.96, 1.07 and 0.93 for D3, Y5
and D11 respectively. In other words, these titratable residues are interacting negligibly in the protonation state space. The subse-quent analysis of the fitted curves allows to determine the micro-scopic pKavalue of each titratable residue. As expected, the pKa
value of Y5, close to 10 and not far from the reference pKaof
ty-rosine (in water), is higher than the aspartic acids ones (about 4). This result implies that at pH=5, the pH value at which the Pep-tide M absorption spectrum has been experimentally determined, the deprotonated form of both D3 and D11 dominates. Of course, at this pH value, Y5 is always protonated. On the other hand, at pH=11, corresponding to the second experimental absorption spectrum value, both D3 and D11 are always deprotonated while Y5 is predominantly in the deprotonated form.
After having established qualitatively the relative populations of the various microstates, we have expanded to 40 ns the trajec-tories corresponding to the same pH ranges 3–6 and 9–12. The D3 pKa value converges to 4.11, while D11 pKa is evaluated to
4.27. The detailed analysis of the microstates is reported in Fig-ure 8. First, it should be noted that, in principle, the position
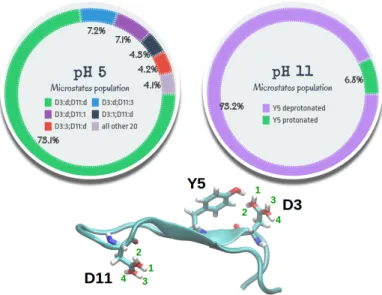
Fig. 8 D3, Y5 and D11 microstate populations at pH=5 and pH=11. At
pH=5, Y5 is always protonated. At pH=11, D3 and D11 are always de-protonated. "d" stands for deprotonated while a number 1–4 stands for protonated in the corresponding position in Peptide M as indicated in the lower part).
of the acidic proton on one or the other oxygen atom of D3 (or D11) are equivalent. However, the small difference in the corre-sponding populations (Figure 8), about 0.1%, indicates that the trajectories are sufficiently converged to obtain reliable popula-tion estimates. Y5 is always protonated at pH=5 while D3 and D11 are predominantly (73%) deprotonated. On the other hand, there exists a noticeable population (14%) in which D11 is pro-tonated on one of the two oxygen atoms. The same occurs with D3, but to a lower extent (8%). All other 20 possible micro-states population amounts to 4%.
is 93% deprotonated. Accordingly, only 2 micro-states are popu-lated. Compared to pH=5 populations, this situation looks easier to handle.
With respect to the pKavalue of isolated aspartic acid in water
(3.9), D3 closer pKavalue implies a slightly larger stabilization of
D11 protonated form which may be attributed to enhanced inter-actions between D11 and other components of Peptide M. Figure 9 (complemented with Table 2) reports a selected set of average distances at pH=5 and pH=11. First, it should be noted that the
Fig. 9 Selected average distances (in Å) at pH=5 (in red) and pH=11 (in
blue) between D3 (blue, bottom left), Y5 (purple), D11 (blue, top right), W14 (orange) and R16 (green).
pH does not seem to modify the average distance (9.1 Å) between Y5 and W14. However, the corresponding fluctuations are larger at acidic pH than at basic one. Regarding the distances between the two aspartic acids (D3 and D11) and the members of the dyad (Y5 and W14), they show different behaviors with respect to the pH. While Y5 is always closer to D3 than D11, the distance be-tween Y5 and D3 decreases with increasing pH while the distance between Y5 and D11 increases at the same time. On the other hand, W14 is always much closer to D3 than D11. When going to acidic to basic pH, the distance between W14 and D3 slightly increases while the the distance between W14 and D11 decreases by 2 Å. Finally, at variance with results indicated by Pagba et al20, our simulations do not show evidence of strong (hydrogen-bond) interactions between Y5 and R16, the corresponding distance be-ing always larger than 17 Å.
3.5 Analyzing Y5 spectrum at pH=5
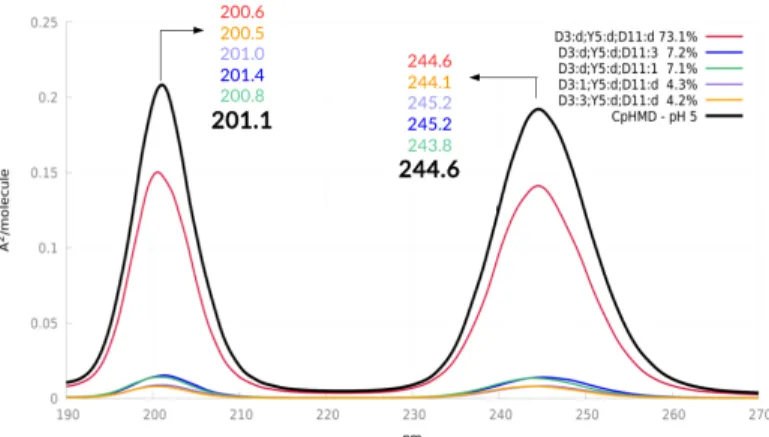
The computed UV absorption spectrum of Y5 in Peptide M at pH=5 is reported in Figure 10. It includes 2 bands between 200 and 300 nm, with λmaxvalues equal to 244.6 and 201.1 nm.
Given the TDDFT 33 nm blue-shift already documented in Section 3.1, the shifted λmaxvalue corresponding to the first absorption
reproduces almost quantitatively the 276 to 283 nm experimental value. Similarly, the second maximum is in agreement with the experimental λmaxat 227 nm.
Fig. 10 Computed UV absorption spectrum for Y5 in Peptide M and
individual contributions from each important microstate at pH=5 weighted by their respective population, obtained by means of CpHMD simulations.
In order to disentangle the contribution of each microstate, we have performed single microstates MD simulations with T-REMD, i.e. with a fixed distribution of protonation states, and calcu-lated the corresponding UV spectra (Figure 10). Obviously, the main contributions originate from the most abundant microstate in which D3 and D11 are deprotonated, while Y5 is protonated. Accordingly, the pH=5 spectrum of Y5 could be satisfactorily modeled using this single microstate. However, it is interesting to have a look to the other contributions, i.e. the microstates in which either D3 or D11 are protonated. When considering the first absorption band, D3 protonation is responsible for either a 0.8 nm blue-shift or a 0.6 nm red-shift, depending on the location of the proton. Similarly, D11 protonation comes together with a ±0.5 shift, depending on which D11 oxygen atom the proton is located on. In the case of the second absorption band, three protonation possibilities induce a 0.2 to 0.8 red-shift with respect to the most probable microstate. When considered all together, these small contributions just cancel out (first absorption band) or add a 0.5 red-shift (second band).
Variations of λmax between different protonation microstates
remain small. However they demonstrate that the present CpHMD-then-QM/MM protocol is able to capture subtle λmax
changes caused by modifications of the protonation states. The distance between Y5 and D3 increases when D3 becomes pro-tonated (0.6 to 1 Å, depending on the oxygen atom where the proton is bonded to). The same result gets out when D11 is protonated, with a 0.8 Å lengthening (see Table 2). Of course, other interactions between Y5 and the rest of the peptide and/or the solvent are also modified when a titratable residue changes its protonation state at a given pH. Therefore it is very difficult to find qualitative relations between structural modifications and variations of λmax.
3.6 Comparing Y5 spectra at pH=5 and pH=11
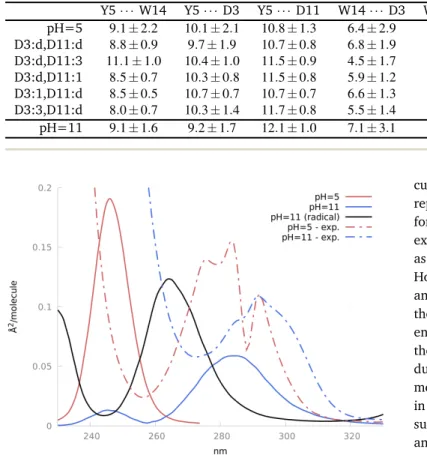
The computed UV absorption spectra of Y5 in Peptide M at pH=5 and pH=11 are reported in Figure 3.6 in the range 230-320 nm, together with the experimental spectra reproduced from20. For
Table 2 Selected average distances and standard deviations (in Å) at pH=5 (also decomposed according to the most important microstates, see Figure
8 for notation) and pH=11 between D3 (Cγ), Y5 (O) , D11 (Cγ), W14 (Nε) and R16 (Nε).
Y5 · · · W14 Y5 · · · D3 Y5 · · · D11 W14 · · · D3 W14 · · · D11 Y5 · · · R16 pH=5 9.1 ± 2.2 10.1 ± 2.1 10.8 ± 1.3 6.4 ± 2.9 12.6 ± 1.6 17.1 ± 2.3 D3:d,D11:d 8.8 ± 0.9 9.7 ± 1.9 10.7 ± 0.8 6.8 ± 1.9 10.5 ± 0.7 19.2 ± 2.1 D3:d,D11:3 11.1 ± 1.0 10.4 ± 1.0 11.5 ± 0.9 4.5 ± 1.7 13.6 ± 1.5 18.3 ± 0.9 D3:d,D11:1 8.5 ± 0.7 10.3 ± 0.8 11.5 ± 0.8 5.9 ± 1.2 11.1 ± 0.8 15.0 ± 1.5 D3:1,D11:d 8.5 ± 0.5 10.7 ± 0.7 10.7 ± 0.7 6.6 ± 1.3 10.6 ± 0.6 20.4 ± 1.6 D3:3,D11:d 8.0 ± 0.7 10.3 ± 1.4 11.7 ± 0.8 5.5 ± 1.4 10.4 ± 0.7 17.5 ± 1.9 pH=11 9.1 ± 1.6 9.2 ± 1.7 12.1 ± 1.0 7.1 ± 3.1 10.6 ± 1.4 17.0 ± 2.5
Fig. 11 Y5 spectra in Peptide M at pH=5 and pH=11 (anionic and radical
Y5), both calculated and experimental20.
must first be noted that we needed to apply a rigid shift to the raw spectra. Indeed, the electron density localized in the phenol moiety is interacting strongly with the closest water molecules. Their MM point charges may, in turn, induce an overpolarization of the Y5 electron density. As a matter of fact, we have com-pared QM/MM and QM-only vertical excitation energies obtained from 10 selected snapshots, treating the closest water molecules (within a 3 Å distance from Y5 oxygen atom) either with point charges or quantum-mechanically. Inspection of Table 3 shows that i) the QM/MM approach works well when Y5 is protonated or radical, ii) an average 16 nm blue-shift has to be applied when Y5 is deprotonated. Accordingly, the spectra reported in Figure
Table 3 Influence of the level of theory (fully QM or QM polarized by water
point charges (QM+q)) describing the Y5 – water interactions on the first vertical transition (averaged over 10 snapshots, in nm).
QM QM+q ∆
Protonated Y5 237.7 236.3 -1.4 Deprotonated Y5 278.4 294.0 15.6 Radical Y5 251.8 250.3 -1.5
have been obtained by rigidly shifting the calculated bands using the values in Table 3. The radical spectrum has been obtained us-ing the hypothesis that the Y5 anion form is transformed into the radical one, thanks to an electron transfer from Y5 to W14, as
dis-cussed above. Going from pH=5 to pH=11, the experimentally reported red-shift is reproduced by our calculations, whatever the form of Y5 at pH=11 (anionic or radical). With respect to the experimental spectra, all the theoretical spectra are blue-shifted, as expected from the gas phase results already discussed in 3.1. However, at variance with these gas phase spectra, now the anion and radical spectra λmaxare separated by 20 nm. Moreover, while
the gas phase spectra take into account the homogeneous broad-ening due to the Y5 vibrational motion, the ones obtained for the peptide M take into account the inhomogeneous broadening due to the interaction between the chromophore and its environ-ment. For this very reason, we can’t apply the shifts discussed in 3.1. Nevertheless, comparison with the experimental spectra suggests that the Y5 radical form may contribute to both pH=5 and pH=11 spectra, in amounts which obviously depend on the experimental conditions (laser intensities, number of scans, ... ) that our calculations cannot account for.
4
Conclusions
In this article, we have reported a new multi-scale protocol de-veloped for simulating the pH-dependent photophysical proper-ties of a peptide featuring a tyrosine-tryptophan dyad in inter-action with two titratable aspartic acid residues. The modeling work-flow features two main steps: (i) the sampling of both the phase space and the protonation state space of the peptide by CpHMD simulations, (ii) the calculation of the tyrosine UV ab-sorption spectrum by means of QM/MM calculations.
Using the replica-exchange approach, CpHMD-based pKa
val-ues of the three titratable residval-ues are converged in tenths of ns, with uncorrelated snapshots separated by 1 ps. Using the ESPF method, the QM/MM calculations can be achieved on thousands of protonated or deprotonated tyrosine side-chains polarized elec-trostatically by their environment (peptide and water molecules). At pH=5, if tyrosine in Peptide M is protonated (neutral), its interaction with aspartic acid or aspartate residues in various nor microstates induces small deviations from the principal mi-crostate. At pH=11, tyrosine in Peptide M is mostly deprotonated, while interacting with deprotonated aspartate residues. However, peptide M experimental UV absorption spectrum cannot be ex-plained without assuming that (i) tryptophan can be ionized, eg by the UV-light source and (ii) radical tryptophan is reduced by an electron transferred from tyrosine which UV spectrum signature reflects its radical nature, ultimately confirming the existence of the tryptophan–tyrosine dyad.
Experimentally, it may be possible to estimate the radical con-centration by modifying it (changing the laser intensity or gener-ating the tyrosyl radical by other chemical reactions, e.g. using an organometallic species44) and recording the corresponding ab-sorption spectra. It may be also possible to use the spin-trapping technique45: the quantity of trapping agent, e.g. a nitrone which
would transform into a nitroxide, would be directly proportional to the tyrosyl concentration.
In principle, the reported modeling protocol can be applied to the calculation of any pH-dependent molecular property, espe-cially when it depends on a larger protonation state space, as it is the case in proteins which may feature a very large number of titratable residues.
Conflicts of interest
There are no conflicts to declare.
Acknowledgements
The authors thank the French Agence Nationale de la Recherche for funding (grant ANR-14-CE35-0015-02, project FEMTO-ASR). Mésocentre of Aix-Marseille Université and GENCI (CINES Grant 2017-A0010710063) are acknowledged for allocated HPC re-sources.
References
1 J. D. Durrant and J. A. McCammon, BMC Biology, 2011,9, 71.
2 S. L. Grand, A. W. Götz and R. C. Walker, Comput. Phys. Com-mun., 2013,184, 374 – 380.
3 J. R. Perilla, B. C. Goh, C. K. Cassidy, B. Liu, R. C. Bernardi, T. Rudack, H. Yu, Z. Wu and K. Schulten, Current Opinion in Structural Biology, 2015,31, 64 – 74.
4 T. Mori, N. Miyashita, W. Im, M. Feig and Y. Sugita, Biochimica et Biophysica Acta (BBA) - Biomembranes, 2016,1858, 1635 –
1651.
5 M. Schneider, X. Fu and A. E. Keating, Proteins: Struct., Funct., Bioinf., 2009,77, 97–110.
6 M. H. M. Olsson, C. R. Søndergaard, M. Rostkowski and J. H. Jensen, J. Chem. Theory Comput., 2011,7, 525–537.
7 G. M. Ullmann and E. Bombarda, Protein Modelling, Springer International Publishing, 2014, pp. 135–163.
8 L. Wang, L. Li and E. Alexov, Proteins: Struct., Funct., Bioinf., 2015,83, 2186–2197.
9 M. Gunner and N. Baker, Methods in Enzymology, Elsevier, 2016, pp. 1–20.
10 E. Bombarda and G. M. Ullmann, Photochem. Photobiol., 2017,93, 1388–1398.
11 G. B. Goh, J. L. Knight and C. L. Brooks, J. Chem. Theory Com-put., 2012,8, 36–46.
12 J. M. Swails and A. E. Roitberg, J. Chem. Theory Comput., 2012,8, 4393–4404.
13 J. M. Swails, D. M. York and A. E. Roitberg, J. Chem. Theory Comput., 2014,10, 1341–1352.
14 Y. Huang, W. Chen, J. A. Wallace and J. Shen, J. Chem. Theory Comput., 2016,12, 5411–5421.
15 J. Lee, B. T. Miller, A. Damjanovi´c and B. R. Brooks, J. Chem. Theory Comput., 2014,10, 2738–2750.
16 H. M. Senn and W. Thiel, Angew. Chem. Int. Ed., 2009, 48,
1198–1229.
17 C. Houriez, N. Ferré, M. Masella and D. Siri, J. Chem. Phys., 2008,128, 244504.
18 C. Houriez, N. Ferré, D. Siri, P. Tordo and M. Masella, J. Phys. Chem. B, 2010,114, 13616.
19 J. M. Olsen, K. Aidas, K. V. Mikkelsen and J. Kongsted, J. Chem. Theory Comput., 2010,6, 249–256.
20 C. V. Pagba, T. G. McCaslin, G. Veglia, F. Porcelli, J. Yohannan, Z. Guo, M. McDaniel and B. A. Barry, Nature Communications, 2015,6, 10010.
21 C. R. Cantor and P. R. Schimmel, Biophysical Chemistry, Part I, W. H. Freeman, 1980, p. 49.
22 H. Hwang, T. G. McCaslin, A. Hazel, C. V. Pagba, C. M. Nevin, A. Pavlova, B. A. Barry and J. C. Gumbart, J. Phys. Chem. B, 2017,121, 3536–3545.
23 M. J. Frisch, G. W. Trucks, H. B. Schlegel, G. E. Scuseria, M. A. Robb, J. R. Cheeseman, G. Scalmani, V. Barone, G. A. Peters-son, H. Nakatsuji, X. Li, M. Caricato, A. V. Marenich, J. Bloino, B. G. Janesko, R. Gomperts, B. Mennucci, H. P. Hratchian, J. V. Ortiz, A. F. Izmaylov, J. L. Sonnenberg, D. Williams-Young, F. Ding, F. Lipparini, F. Egidi, J. Goings, B. Peng, A. Petrone, T. Henderson, D. Ranasinghe, V. G. Zakrzewski, J. Gao, N. Rega, G. Zheng, W. Liang, M. Hada, M. Ehara, K. Toyota, R. Fukuda, J. Hasegawa, M. Ishida, T. Nakajima, Y. Honda, O. Kitao, H. Nakai, T. Vreven, K. Throssell, J. A. Montgomery, Jr., J. E. Peralta, F. Ogliaro, M. J. Bearpark, J. J. Heyd, E. N. Brothers, K. N. Kudin, V. N. Staroverov, T. A. Keith, R. Kobayashi, J. Normand, K. Raghavachari, A. P. Ren-dell, J. C. Burant, S. S. Iyengar, J. Tomasi, M. Cossi, J. M. Millam, M. Klene, C. Adamo, R. Cammi, J. W. Ochterski, R. L. Martin, K. Morokuma, O. Farkas, J. B. Foresman and D. J. Fox, GaussianËIJ16 Revision A.01, 2016, Gaussian Inc. Wallingford CT.
24 GaussianËIJ16 Revision A.01, 2018.
25 F. Santoro, R. Improta, A. Lami, J. Bloino and V. Barone, J. Chem. Phys, 2007,126, 084509.
26 F. Santoro, A. Lami, R. Improta, J. Bloino and V. Barone, J. Chem. Phys., 2008,128, 224311.
27 D. A. Case, R. M. Betz, D. S. Cerutti, T. E. Cheatham, T. A. Dar-den, R. E. Duke, T. J. Giese, H. Gohlke, A. W. Goetz, N. Home-yer, S. Izadi, P. Janowski, J. Kaus, A. Kovalenko, T. S. Lee, S. LeGrand, P. Li, C. Lin, T. Luchko, R. Luo, B. Madej, D. Mer-melstein, K. M. Merz, G. Monard, H. Nguyen, H. T. Nguyen, I. Omelyan, A. Onufriev, D. R. Roe, A. Roitberg, C. Sagui, C. L. Simmerling, W. M. Botello-Smith, J. Swails, R. C. Walker, J. Wang, R. Wolf, X. Wu, L. Xiao and P. Kollman, AMBER 2016, University of California, San Francisco, 2016.
28 J. A. Maier, C. Martinez, K. Kasavajhala, L. Wickstrom, K. E. Hauser and C. Simmerling, Journal of Chemical Theory and Computation, 2015,11, 3696–3713.
29 S. G. Itoh, A. Damjanovi´c and B. R. Brooks, Proteins: Struc-ture, Function, and Bioinformatics, 2011,79, 3420–3436.
30 N. Ferré and J. G. Ángyán, Chem. Phys. Lett., 2002,356, 331–
339.
31 M. J. Frisch, G. W. Trucks, H. B. Schlegel, G. E. Scuse-ria, M. A. Robb, J. R. Cheeseman, G. Scalmani, V. Barone, B. Mennucci, G. A. Petersson, H. Nakatsuji, M. Caricato, X. Li, H. P. Hratchian, A. F. Izmaylov, J. Bloino, G. Zheng, J. L. Sonnenberg, M. Hada, M. Ehara, K. Toyota, R. Fukuda, J. Hasegawa, M. Ishida, T. Nakajima, Y. Honda, O. Kitao, H. Nakai, T. Vreven, J. A. Montgomery, Jr., J. E. Peralta, F. Ogliaro, M. Bearpark, J. J. Heyd, E. Brothers, K. N. Kudin, V. N. Staroverov, R. Kobayashi, J. Normand, K. Raghavachari, A. R. anld J. C. Burant, S. S. Iyengar, J. Tomasi, M. Cossi, N. Rega, J. M. Millam, M. Klene, J. E. Knox, J. B. Cross, V. Bakken, C. Adamo, J. Jaramillo, R. Gomperts, R. E. Strat-mann, O. Yazyev, A. J. Austin, R. Cammi, C. Pomelli, J. W. Ochterski, R. L. Martin, K. Morokuma, V. G. Zakrzewski, G. A. Voth, P. Salvador, J. J. Dannenberg, S. Dapprich, A. D. Daniels, O. Farkas, J. B. Foresman, J. V. Ortiz, J. Cioslowski and D. J. Fox, Gaussian 09 Revision D.01, 2009, Gaussian Inc. Walling-ford CT 2009.
32 M. Barbatti, M. Ruckenbauer, F. Plasser, J. Pittner, G. Granucci, M. Persico and H. Lischka, Wiley Interdisciplinary Reviews: Computational Molecular Science, 2014,4, 26–33.
33 M. Barbatti, G. Granucci, M. Ruckenbauer, F. Plasser, R. Crespo-Otero, J. Pittner, M. Persico and H. Lischka, NEWTON-X: a package for Newtonian dynamics close to the
crossing seam. www.newtonx.org, 2015.
34 M. Barbatti, G. Granucci, M. Persico, M. Ruckenbauer, M. Vaz-dar, M. Eckert-Maksi´c and H. Lischka, J. Photochem. Photobiol. A, 2007,190, 228–240.
35 B. A. Barry, Personal communication, 2017.
36 O. B. Morozova, A. V. Yurkovskaya, H.-M. Vieth and R. Z. Sagdeev, J. Phys. Chem. B, 2003,107, 1088–1096.
37 S. Y. Reece, J. Stubbe and D. G. Nocera, Biochimica et Biophys-ica Acta (BBA) - Bioenergetics, 2005,1706, 232 – 238.
38 M. Mangold, L. Rolland, F. Costanzo, M. Sprik, M. Sulpizi and J. Blumberger, J. Chem. Theory Comput., 2011,7, 1951–1961.
39 J. G. Radziszewski, M. Gil, A. Gorski, J. Spanget-Larsen, J. Waluk and B. J. Mrøsz, J. Chem. Phys., 2001,115, 9733–
9738.
40 A. Onufriev, D. A. Case and G. M. Ullmann, Biochemistry, 2001,40, 3413–3419.
41 H. N. Po and N. M. Senozan, J. Chem. Educ., 2001,78, 1499.
42 E. Bombarda and G. M. Ullmann, J. Phys. Chem. B, 2010,114,
1994–2003.
43 A. Onufriev and G. M. Ullmann, J. Phys. Chem. B, 2004,108,
11157–11169.
44 R. Ghanem, Y. Xu, J. Pan, T. Hoffmann, J. Andersson, T. Polívka, T. Pascher, S. Styring, L. Sun and V. Sundström, Inorganic Chemistry, 2002,41, 6258–6266.