HAL Id: hal-01158240
https://hal.archives-ouvertes.fr/hal-01158240
Preprint submitted on 30 May 2015HAL is a multi-disciplinary open access archive for the deposit and dissemination of sci-entific research documents, whether they are pub-lished or not. The documents may come from teaching and research institutions in France or abroad, or from public or private research centers.
L’archive ouverte pluridisciplinaire HAL, est destinée au dépôt et à la diffusion de documents scientifiques de niveau recherche, publiés ou non, émanant des établissements d’enseignement et de recherche français ou étrangers, des laboratoires publics ou privés.
Income Inequality and Foreign Aid
Thi Hong Hanh Pham
To cite this version:
Dale Squires
EA 4272
Income Inequality and Foreign Aid
Thi Hong Hanh Pham*
2015/13
(*) LEMNA, Université de Nantes
Laboratoire d’Economie et de Management Nantes-Atlantique Université de Nantes
Chemin de la Censive du Tertre – BP 52231 44322 Nantes cedex 3 – France www.univ-nantes.fr/iemn-iae/recherche Tél. +33 (0)2 40 14 17 17 – Fax +33 (0)2 40 14 17 49
D
o
cu
m
en
t
d
e
T
ra
va
il
W
o
rk
in
g
P
ap
er
1
Income inequality and foreign aid
PHAM Thi Hong Hanh
LEMNA, Institute of Economics and Management, University of Nantes Chemin de la Censive du Tertre, BP 52231, 44322 Nantes Cedex 3, FRANCE
Phone: +33 (0)2 40 14 17 33 Fax: +33 (0)2 40 14 16 50
E-mail: [email protected]
Abstract: The aid effectiveness has become a long-lasting and controversial debate in the literature. To complement the concerned literature, this paper aims to address the question of whether foreign aid plays a crucial role in widening or narrowing income inequality. To do so, we employ a large dataset covering twenty-seven countries in Sub-Saharan Africa over the period 1990-2011. We find evidence of an inequality increasing effect of foreign aid in Sub-Saharan Africa. However, this effect can reverse when the corruption is controlled.
Keywords: foreign aid; income inequality; Sub-Saharan Africa JEL: F35; I31; O15
2
1. Introduction
Foreign aid, in particular Official Development Assistance (ODA), has been regarded as a key for the achievement of the Millennium Development Goals (MDGs). Over the last decade, net ODA grew by 63% (almost US$ 50 billion), reaching a peak of US$ 128.5 billion in 2010. Despite a slight fall due to the global economic recession, at the end of 2011, ODA constitutes 7% (an estimated minimum of US$1.7 trillion) of international resource flows to developing countries. The main objective of giving ODA is to promote the economic development of developing countries. In other words, ODA has been considered as one of the most important factors, which can resolve the poverty and income inequality problem by fostering sustained economic growth in the developing world.
However, so many countries register low per capita income after receiving enormous amounts of foreign aid (Ali and Isse, 2004). That is why the role of foreign aid in fostering economic growth has become a relevant issue in the literature. Despite of the vast theoretical and empirical literature, the effectiveness of foreign aid has been still a long debated and controversial issue. For instance, Burnside and Dollar (2000) find evidence of the positive impacts of foreign aid on the economic growth of a country with a sound institutional environment. By contrast, Easterly (2003) shows that foreign aid does not have any significant effect on growth, even if the recipient countries implement good policies. Furthermore, the relationship between foreign aid and economic growth is inclusive in other studies (e.g. Mosley et al., 1987; 1992).
Unlike an extensive literature, which seeks to examine the impacts of foreign aid on economic growth, the direct link between foreign aid and income inequality has been still underdeveloped. So that, to complement the concerned literature, this paper tends to investigate the aid – income inequality nexus, by using a wide dataset of Sub-Saharan Africa (SSA) countries over the period 1990 – 2011. In fact, over the last decade, Sub-Saharan Africa receives more ODA than any other region. ODA flow to this region reached $80 billion and $125 billion in 2008 and 2010, respectively with ODA per poor person averaging $97 per year over the period 2008-2010. While SSA countries have experienced a vast volume of foreign aid inflow, the expected positive impacts of ODA on their economic performance have not been clear-cut. Mosley et al. (1987) argues that in contrast to such an important value of ODA inflow, SSA countries have continually showed high levels of unemployment and absolute poverty, low GDP per capita level, high mortality rates, low level of education, and lack of access to health care facilities. Thus, SSA region seems to be a counterexample to the positive impacts of ODA on economic growth. In detail, when ODA inflows reduced to 28 percent, economic growth rate became positive from its declining state and grew to 1.1 per cent. By
3
contrast, when ODA into SSA countries increased, economic growth rate declined, implying that aid has not been effective in SSA countries. On the other hand, the authors also show that together with an increase in ODA, GDP per capita figures declined across most of SSA countries. More recently, Moyo (2009) indicates that the billions of dollars in aid sent from wealthy countries to developing Africa nations, in particular SSA region, has not helped to reduce poverty and increase growth. Accordingly, poverty levels continue to escalate and growth rates have steadily declined and millions continue to suffer. In this context, the welfare impacts of foreign aid in SSA countries, more than ever, should be questioned in the rigorous studies. Therefore, in this study, we tend to address the question of whether foreign aid plays a crucial role in widening or narrowing income inequality in SSA countries.
The reminder of this paper is organized as follows. Section 2 outlines the concerned literature. Section 3 provides an overview on the trends of ODA and income inequality in SSA countries. Section 4 explains the econometric approach. This is followed by the data description. Sections 6 presents and analyzes the empirical results. Concluding remarks are in Section 7.
2. Literature framework
The question about the effectiveness of foreign aid has been addressed in an extensive literature. The first strand focuses on the impacts of foreign aid on economic growth. Taking into account a “two-gap” model, Chenery and Strout (1966) argue that foreign aid can eliminate the investment – saving gap and exports – imports gap in less developed countries. This allows dissolving the “vicious circle of poverty” and connecting poor countries to the virtuous circle of productivity and growth.
Burnside and Dollar (2000) challenge the literature on the aid effectiveness when they suggest that aid has a positive impact on growth in developing countries with good fiscal, monetary, and trade policies, while with the presence of poor policies, aid has no positive effect on growth. Moreover, the authors find no evidence that aid has systematically affected policies - either for good or for ill. The Burnside – Dollar result is first supported by Collier and Dollar (2002) and also launches the debate on the conditional impacts of foreign aid. In an empirical study, Easterly et al. (2004) revisit the relationship between aid and growth. The authors support the view of Burnside and Dollar (2000) that the impact of aid depends on the quality of state institutions and policies. Accordingly, there is no evidence that aid has the same positive effect everywhere. They also show that in the 1990s the allocation of aid to the less developed world favored countries with better institutional quality. Similarly, Ali and Isee (2004) confirm Burnside-Dollar finding on the one hand, and indicate a nonlinear
4
relationship between aid and growth on the other hand. In addition, they conclude that the relationship between aid and growth is sequential: more and more aid leads to lower economic growth. By contrast, foreign aid, according to Agénor and Aizenman (2010), is also very volatile and pro-cyclical in nature. Consequently, increased aid volatility can have a cataclysmic effect on macroeconomic shocks and contribute to the creation of output and poverty traps.
On the other hand, a large number of empirical studies fail to establish a link between aid and economic growth. For instance, Mosley et al. (1987) find no evidence of a statistically significant correlation between aid and growth. This is due to the possible leakage of aid to non-productive expenditures in the public sector, and the transmission of negative price effects to the private sector. Consequently, the authors recommend that donor should allocate aid on countries with certain criteria for high effectiveness of aid. In a follow-up paper, Mosey et al. (1992) support a positive and significant association between aid and growth for the whole sample, while regressions for regional subgroups yielded no statistically significant relation. The authors conclude that the effect of aid on growth is country specific. More importantly, they suggest four stages of aid effectiveness: i) low aid - low growth: ii) high aid - low growth; iii) high aid – high growth; and iv) low aid – high growth. In a seminal contribution basing on a simple game-theoretic rent-seeking model, Svensson (2000) also mentions that the macroeconomic effects of ODA are ambiguous even though it contributes to an important part of revenue in various recipient countries. On one hand, under certain circumstances, ODA inflows lead to an increase in government revenue, which in turn lowers the provision of public goods. On the other hand, aid may increase rent dissipation and reduce productive public spending. In sum, increased aid does not necessarily lead to increased welfare.
Despite the lack of a robust positive correlation between aid and growth, the economists and policymakers start shifting their focus on the direct impacts of foreign aid on income inequality in recipient countries. Bourguignon et al. (2008) find that the distributional impact of aid is equality enhancing. Moreover, foreign aid has quite small impact on aggregate inequality indices, while more important effect is revealed on a decile by decile basis. The authors also argue that some of the favorable impacts of aid are decimated by the negative impact of trade restrictions imposed by high-income countries on potential income in the developing world.
In another empirical study basing on the dataset over 1971-2002, Calderon et al. (2009) only find some weak evidence that foreign aid contributes to the improvement of income
5
distribution when the institutional quality is taken into account, however, this result is not robust.
Unlike two above cited studies, Layton and Lielson (2008) find that foreign aid’s impact on income inequality is somewhere between zero and weakly positive. According to these authors, foreign aid potentially causes inequality to increase in the developing world, in which income inequality is already a huge problem. It means that the expected goal of foreign aid, which is to improve income distribution and living standards for the poor, is not being met, even worse is the fact that the opposite trend is potentially occurring. Using a sample of 88 developing countries, Bjørnskov (2010) also support the role of foreign aid in deteriorating income distribution in recipient countries. In detail, foreign aid in conjunction with democracy is associated with a higher share of income held by the upper quintile. It means that foreign aid leads to a more skewed income distribution in democratic developing countries, while the effects are negligible in autocratic countries. More recently, Herzer and Nunnenkamp (2012) support the result of Bjørnskov (2010) for a sample of 21 countries over the period 1970-1995. They indicate that aid exerts an inequality increasing effect on income distribution. In addition, this result is robust to different estimation methods, potential structural breaks, different inequality data sets, and possible outliers.
Regarding the case study of SSA, Gomanee et al. (2005) tend to study the mechanisms via which aid should affect growth. They point out a highly significant positive effect of foreign aid on economic growth of SSA countries, accounting for the effect via investment. On average, each one percentage point increase in the aid/GNP ratio adds one-third of one percentage point to the growth rate. In the same vein of Gomanee et al. (2005), Armah and Nelson (2008) provide an empirical analysis on the growth effects of foreign aid for a sample of twenty-one SSA countries spanning 1995-2003. They also support a significant foreign aid-growth relationship. It suggests that increased aid to SSA region is one way to achieve the MDGs. To sum up, the effectiveness of foreign aid in SSA countries has been recently questioned. However the existing literature seems to only focus on the growth effect of foreign aid, but has not paid much attention to the aid – income inequality nexus. To contribute to the existing literature, the present paper aims to address the question of whether foreign aid widens or narrows income inequality in SSA countries.
3. ODA and income inequality in SSA countries
This section provides a set of stylized facts on the evolution of ODA inflows as well as income inequality in SSA countries.
6
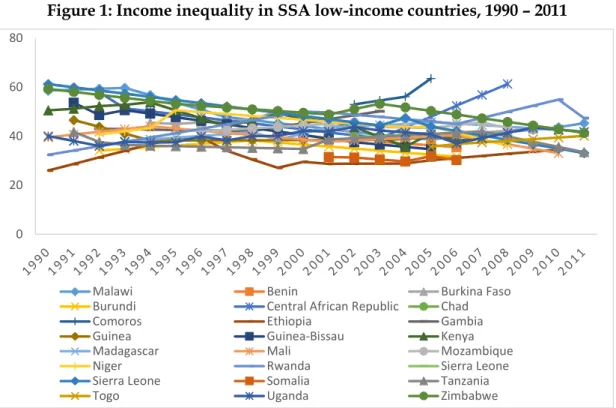
3.1. Income inequality trends
In terms of income distribution, and using traditional Gini measures,1 Sub-Saharan Africa is
one of the most inequitable regions in the world. By 2010, six of the ten countries in the world with the most unequal income distribution were in SSA region (African Development Bank Group, 2012). SSA region has experienced a striking concentration of countries which suffer from remarkably high income inequality levels, such as Namibia, Comoros, South Africa, Angola, Botswana, Lesotho and Swaziland. As suggested by Bastagli et al. (2012), in SSA region, the average income inequality, as measured by the Gini, has fallen. However, income inequality levels in SSA are heterogeneous and vary across countries with different levels of income.
<Insert Figure 1>
As shown in Figure 1, a decreasing trend seems to be clearer for the case of low-income countries. For instance, over the period 1990-2011, we can observe a large decrease in income inequality in Zimbabwe, Tanzania, Kenya, Sierra Leone, Guinea-Bissau and so on. By contrast, other countries, such as Ethiopia and Central Africa, have experienced an increasing trend in income inequality.
<Insert Figure 2>
Regarding lower-middle income countries, Figure 2 shows that there is a consistent and clear trend towards increasing inequality in Ghana, Côte d’Ivoire and Zambia. Particularly, in Ghana, the rising income inequality is having a drag effect on poverty reduction. As suggested in Africa Progress Report (APP, 2013), in Ghana, poverty fell between 1998 and 2005, but due to income inequality rising, poverty fell by less than it should have. Precisely, the top 10% of national income has been getting richer while the bottom 40% has been getting poorer. Similarly, in Zambia, income inequality has been consistently rising since 2003. Zambia’s Gini coefficient now stands at the extremely high level of 55%, measured in 2010. However, in the rest of lower-middle income countries, the Gini coefficient remained high until the early 1990s and then started a downward trend. Among others, Nigeria has experienced a positive progress in reducing income inequality since 2009.
<Insert Figure 3>
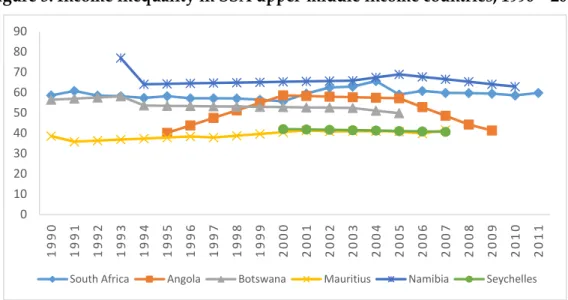
In the case of upper-middle income countries, we observe a slight decline of Gini coefficient in Botswana and Namibia. However, in these countries, income inequality level is still high. Other countries, such as South Africa, Seychelles and Mauritius, show the stability in
1 In Todaro and Smith (2011, p. 208), the Gini coefficient is an aggregate numerical measure of income inequality
ranging from 0 (perfect equality) to 1 (perfect inequality). The Gini coefficient for countries with highly unequal income distributions typically lies between 0.50 and 0.70, while for countries with relatively equal distributions, it is on the order of 0.20 to 0.35.
7
inequality level since the last of 1990s. Only Angola has evidenced a remarkable decline of Gini coefficient since 2005. Figure 3 shows that the Gini coefficient of Angola at a starting level of around 40% in 1995, rising steadily throughout the 1990s to reach a peak of 58.5% in 2000, and then falling to 41.3% in 2009.
In general, SSA countries have experienced some positive indications of progress but inequality is still at a very high level. On the other hand, as suggested by APP (2013), high inequality seems to be the main reason for the disappointing overall record on reducing poverty in Sub-Saharan Africa. Global research confirms the view that levels of income inequality matter significantly in determining global poverty projections. In other words, “economic growth is driving an increasingly unequal pattern of wealth distribution and weakening the link between growth and poverty reduction” in SSA region (APP, 2013, p.29).
3.2. ODA trends
Sub-Saharan Africa is known as the region where most LDCs are located and where most countries “off-track” towards the MDGs can be found. Thus, needless to say the poorest region in the world receives the largest volume of ODA relative to other regions. Since 2000, given a substantial increase in ODA from OECD countries, SSA region has received historically unprecedented volumes of aid. Of a total ODA envelope of $192.5 billion in 2013 (at current price), SSA region received $45.2 billion (23.47% of the world ODA). In particular, SSA countries have received roughly the same amount of ODA (around 23% of the world ODA) since 1985.
<Insert Figure 4>
As shown in Figure 4, the largest proportion of ODA is channeled to sub-Saharan Africa. It also means that SSA countries would be more vulnerable to any eventual sharp decreases in development aid. Moreover, the share of aid in national budget has maintained an upward surge in 2000. For instance, ODA flows contribute to more than 50% of the government expenses in several SSA countries (Figure 5).
<Insert Figure 5>
At the extreme end of the scale, Liberia’s ODA/GNI ratio exceeded 130% in 2013. Relative to the size of SSA economies, the data shows that, once again, several SSA countries are most dependent on development aid. On the other hand, in 2012, among 30 countries registered ODA levels in excess of 10 percent of GNI, there are 17 SSA countries (Figure 6). On the other hand, ODA is heavily concentrated in a much smaller number of countries. For example, in 2012, a large proportion of ODA in SSA came to Cape Verde (12.4%) and Seychelles (9.9%). In spite of being the largest ODA recipient, SSA has recorded the lowest performance in
8
ODA per capita. In 2010, in terms of ODA per capita, Oceania receives ODA five times more than sub-Saharan Africa (OECD-DAC, 2010).
<Insert Figure 6>
4. Empirical strategy
The present paper aims to examine the relationship between foreign aid and income inequality in SSA region. Given this aim, our empirical strategy tries to make maximum use of both time and cross-country dimensions of available annual data set. Using annual data for any econometric estimation, we should assume that the annual observations on income inequality cannot represent long-run equilibrium values in any given year, because of slow adjustment to changes in other variables. To account for the possibility of partial adjustment, we specify a dynamic log-linear equation for income inequality, which includes a lagged dependent variable. We first estimate the following bivariate model, which is also considered in Herzer and Nunnenkamp (2012):
= + + + + (1)
Where Inequalityitis an indicator of income inequality of country i in year t, Aidit represents
foreign aid flows to country i in year t, is a disturbance term assumed to satisfy the Gauss–Markov conditions, and is a trend term allowing for a shift of the intercept over time. Equation 1 assumes that there is a possible relationship running from foreign aid to inequality and that no other variables are required to produce unbiased estimates of this relationship. However, there are several factors (such as economic growth, trade, foreign investment, and redistribution policies) that can affect inequality. Thus, following Tanzi (1998) and Roine et al. (2007), we introduce in the second income inequality’s model a large set of explanatory variables. The empirical model is formulated as follows:
= + + + + !"
+ 5%& −1+ 6 "*1 −1+ 7!&, −1+ 7 "*2 −1+ + (2)
Where is a broad set of macroeconomic variables, !" represents different indicators measuring the openness level of a country, %& is the financial development level, "*1 captures the impacts of labor market’s institutions, !&, represents different indicators of human capital, "*2 evaluates the role of institutional quality. However, several econometric problems may arise from Equations 1-2:
9
- The independent variables are assumed to be endogenous. Because causality may run in both directions – from independent variables to dependent variable and also these regressors may be correlated with the error term.
- Time-invariant individual characteristics (fixed effects) can be correlated with the explanatory variables.
- Introducing lagged dependent variable gives rise to the correlation between the regressors and the error term. Because of this correlation, dynamic panel data estimation of Equation 3 suffers from the Nickell (1981) bias, which disappears only if T tends to infinity.
In addition, heteroscedasticity is expected to be present because, in the panel data, heterogeneous errors might exist with different panel members. To resolve these problems, the GMM method developed by Arellano and Bond (1991) seems to produce more efficient and consistent estimators compared with other procedures. This method also eliminates any endogeneity that may be due to the correlation of these country specific effects and the right hand side regressors. If we first difference Equations 1-2, we get:
∆ = / ∆ + / ∆ + / ∆0 ℎ 2 3 2 4 56 + ∆ (3)
Equation 3 has removed group effects and time trend. Arellano and Bond (1991) also develop the serial correlation test, in which the null hypothesis assumes no serial correlation in error term. Arellano and Bond (1991) introduce the tests for serial correlation, often labelled “m1” for first-order and “m2” for second-order serial correlation. We expect to find the first-order serial correlation in the first differenced residuals. The key problem arises if there is the second or a higher order serial correlation, suggesting that some of the moment conditions are invalid.
5. Data issues
Our empirical study is based on an unbalanced annual panel dataset covering various individual indicators for thirty-seven selected countries in the Sub-Saharan Africa over the period 1990-2011. All these indicators are transformed in the natural logarithm. The sources of data sample as well as the list of selected countries are presented in Appendix A. Regarding income inequality, several previous studies in the concerned literature use the Gini index provided by the World Income Inequality Database (WIID), which are based on household surveys. In the WIID, the population and income coverage are comprehensive, and different criteria from various sources are homogenized in order to avoid problems of
10
definition (Atkinson and Brandolini, 2001).2 In addition, another limit of this data set is the
lack of continuous and consistent inequality data over time (Galbraith, 2009). For these reasons, our empirical analysis employs the Gini coefficient (based on net income) from the Standardized World Income Inequality Database (SWIID, 2014) developed by Solt (2009). The SWIID combines information from Luxembourg Income Study (LIS) and WIID data to create a dataset with greater coverage than the LIS data and greater comparability than the WIID data.
With respect to the foreign aid data, we use the share of ODA to GNI. According to the ODA definition of WDI, this indicator covers loans and grants from DAC member countries, multilateral organizations, and non-DAC donors. It does not reflect aid given by recipient countries to other developing countries. As a result, some countries, which are net donors, are shown as aid recipients. The indicator does not distinguish types of aid (program, project, or food aid; emergency assistance; or post-conflict peacekeeping assistance), which may have different effects on the economy. Ratio of aid to gross national income (GNI) provides measures of recipient country's dependency on aid. Together with ODA indicator, we also introduce in our empirical models six groups of different explanatory variables that can affect income inequality.
- First, we employ two indicators, GDP per capita and its quadratic term, to capture the impacts of economic development level. In fact, the link between income inequality and economic growth has been widely discussed in the literature, either theoretical or empirical. So that, introducing these indicators should be required in all estimated regressions. Furthermore, using the quadratic GDP per capita allows us to consider the possible presence of an invested-U relationship between economic growth and income inequality described by the Kuznets curve. In addition, we use another variable to consider the impacts of macroeconomic stability on income inequality, notably the annual inflation (INF).
- Second, in order to account for the possible effects of economic integration, we use two alternative indicators. The first one involves the financial integration level that is defined and measured as total stock of inward FDI over GDP, which is defined as “the value of the share of their capital and reserves (including retained profits attributable to the parent enterprise, plus the net indebtedness of affiliates to the parent enterprises” (World Investment Report, 2009). Including FDI inflows allows us to revisit the impacts of FDI on income inequality. This issue has also discussed in
2 Problems of definition result from the calculation method of Gini coefficient: whether a category applies to
household or individuals, whether income is measured gross or net of taxes, and whether expenditure or income is used.
11
many theoretical works. For instance, presenting a model of technology transfers through the FDI channel, Wang and Blomstrom (1992) suggest that workers with more human capital will appropriate more of the beneficial effects of FDI than unskilled workers. Focusing on the firm specific nature of FDI, Zhao (1998) examines the impact of FDI on wages and employment more directly. According to Zhao, inward FDI benefits the workers with greater bargaining power. The second one is a standard de facto measure of trade integration – the sum of exports and imports as a share of GDP.
- Third, we take into consideration the relationship between financial development and income inequality by introducing in all regressions the ratio between banking credits to the private sectors and GDP. This indicator, which measures the development of banking sector, allows us to capture the relative importance of private external finance in the evolution of income inequality.
- Fourth, according to Acemoglu (2003a), labor market’s institutions can affect the overall level of inequality. To control for this impact, we include in the estimated models two variables, notably the minimum wages and the labor market regulations. - Fifth, we assume that income inequality of a country depends on its human capital
factors. For this reason, we should control for the supply side of the labor market by using the share of total number of students enrolled in secondary education in total population. Nevertheless, the major deficiency is the lack of continuous and consistent school enrolment indicators for SSA countries. Therefore, instead of using school enrolment indicator, we employ the ratio between education expenditure and GNI. We would expect that, higher the education expenditure ratio is, higher the investment in education is, that can increase the supply of skilled labor. An increase in the skilled labor supply, in turn, can reduce income inequality.
- Lastly, to capture the possible impact of institutional quality, we introduce a set of five alternative variables. The first one (LEG dummies) considers the impact of legal origin on financial structure. This dummy (LEG1 through LEG5) takes into consideration five different legal origins: British origin, French origin, socialist origin, German origin and Scandinavian origin. The second one POLITY2 is the democracy index that reflects government type and institutional quality based on freedom of suffrage, operational constraints and balances on executives, and respect for other basic political rights and civil liberties. POLITY2 ranges from–10 to 10 with higher values representing more democratic regimes. The third one DURABLE is the political stability index, using the number of years since the last regime transition or
12
independence. The fourth one COX narrowly measures the constraints on the executive. All of these three indexes POLITY2, DURABLE and PCI are derived by Marshall and Taeggers (2003). The fifth one is a widely used indicator of government quality (GQ) in a broader sense, which is suggested by Kaufmann et al. (2010), derived by averaging six measures of GQ: voice and accountability, political stability and absence of violence, government effectiveness, light regulatory burden, rule of law and freedom from graft. The last one involves the level of corruption. We consider that the effectiveness of foreign aid strongly depends on the corruption level of a country. In other words, corruption can change the nature of the relationship between foreign aid and income inequality. For this reason, we introduce in all estimated regressions the interactive term between foreign aid and corruption.
<Insert Table 1>
Table 1 summarized the dataset and provides means and standard-errors of dependent and independent key variables. Additionally, Table 1 reports the correlation coefficients between income inequality and all covariates. It can be seen that income inequality variable displays considerable variation both between and within countries, justifying the use of panel estimation techniques. As shown in Table 1, most of correlation coefficients are significant. This result aids the modelling and helps to confirm the choice of dependent variables. However, the values of correlation coefficient are diverse, ranging from negative to positive, from small to important. For instance, we find a negative and significant value of correlation coefficient between Gini coefficient and ODA flows, while that between Gini coefficient and GDP per capita is significantly positive. On the other hand, income inequality seems to be positively correlated to economic integration in terms of both trade and finance. The empirical results show that the magnitudes, the statistical significance even the sign of correlation coefficient have been more or less altered. Thus, we should not be surprised to see different empirical results on the relationship between income inequality and macroeconomic variables.
6. Empirical results
This section reports the empirical results of the GMM estimator and robustness tests. It also outlines the results’ implications for the considered theoretical hypotheses and discuses policy recommendations. First of all, Table 2 represents the empirical results using the GMM estimator with robust standard errors for four different models:
13
- Model 2 considers only the relationship between aid and income inequality and controls for the impact of corruption on this relationship.
- Model 3 includes other macroeconomic variables.
- Model 4 includes other macroeconomic variables and controls for the impact of corruption on the relationship between aid and income inequality.
<Insert Table 2>
Table 2 reports all econometrical results in two parts. The upper shows the estimated coefficients for each GMM regression. The lower presents the serial correlation test. Accordingly, the first order serial correlations (m1) are expected because of first differencing, p-values obtained suggest no significant second order serial correlation (m2). Thus, we should reject the null of the absence of first order serial correlation and not reject the absence of second order serial correlation. This result implies that our estimated models satisfy the required orthogonal conditions.
Impact of foreign aid. Going straight to the hypothesis of interest, we note that in the bivariate models, the estimated coefficients of foreign aid are positive and statistically significant. This result supports an inequality increasing effect of foreign aid on income distribution. In addition, this impact is quantitatively weak: an increase in the share of aid in GNI by 1 unit leads to an increase in the Gini coefficient by 0.027 unit. The unwanted impact of aid on inequality can be explained in several ways. First, donors may be motivated by other considerations, such as strategic interest, retribution of allies or even colonial past, which are not necessarily in conformity with MDGs. Second, the excessive monitoring of aid can disturb the implementation of inequality reduction strategies (Easterly, 2007). Third, the ineffectiveness of aid programs can be damageable due to the failure of coordination between a large number of aid agencies in SSA (van de Walle, 2003). On the other hand, the failure of aid programs seems to be the consequence of rent seeking by local elites in SSA countries and spending foreign aid for personal benefit. In this context, international donors should: (i) control the distribution of aid resources in each recipient country by themselves;
(ii) focus on countries in which institutions restrict rent seeking (Hodler, 2007) and aid is used in favor of the poor (OECD, 2006); and (iii) strengthen the conditions of giving aid (Boone, 1996).
However, the positive impact of foreign aid reverses when it is interacted with the level of corruption control. The economic implication is that corruption and rent seeking may bear major responsibility for the inequality increasing effects of aid in SSA countries. Accordingly,
14
when SSA countries improve their control of corruption, the unexpected redistributive impact of foreign aid will be reduced.
Recalling the discussion in Section 4 that income inequality can be influenced by other macroeconomic factors, it should be stressed that the positive relationship between aid and Gini coefficient could be over-evaluated in a bivariate model. Nevertheless, in the multivariate models with the presence of a wide set of different macroeconomic variables, the positive relationship between aid and income inequality tends to be persistent. It means that the interaction between aid and inequality has not been altered by the presence of macroeconomic environment in the model. On the one hand, ODA flows enter in Model 3, in which we do not control for the impact of corruption, with a positive and significant estimated coefficient. On the other hand, in Model 4 accounting for the impact of corruption, the link between aid and inequality is still positive but becomes statistically insignificant. This result allows us to conclude that a good control of corruption can change the nature of the aid – income inequality nexus. In other words, an increase in ODA flows can widen income inequality in a country without controlling for corruption, while the opposite trend can be true in a country with a high level of corruption control.
We now turn our attention to the impact of other macroeconomic factors on income inequality in SSA countries.
Impacts of economic development. GDP per capita enters in all estimated models with a positive and significant coefficient, meaning that the Gini value increases with an increase in economic growth. Unlike the positive effect of GDP per capita, its quadratic term exerts a negative and significant impact on income inequality. These two results support the hypothesis of Kuznets (1955, p. 18) “… a long swing in the inequality characterizing the secular income structure: widening in the early phases of economic growth when the transition from the pre-industrial to the industrial civilization was most rapid; becoming stabilized for a while; and then narrowing in the later phases". However, if we consider that SSA countries have been in the early phase of economic growth, the empirical result is not consistent with the pro-poor growth hypothesis that economic growth is good for the poor. In other words, economic growth does not contribute to improving the lives of the poor and to causing favorable changes in the distribution of income. Another independent variable, inflation rate, shows a non-statistically significant coefficient, meaning that income inequality does not depend on the price stability in SSA region.
15
Impacts of economic integration. Regarding the impact of financial integration, FDI coefficients are positive but statistically insignificant in all regressions. The positive sign of FDI implies that inward FDI flows could be associated with widening within-income inequalities in SSA. In fact, the new technology has been transferred from developed countries to developing countries through the FDI channel. As the multinational firms have successfully implemented the new technology in the host country, only skilled labor will be required. Consequently, demand for skilled labor steeply increases, thus leading to an increase in wage of skilled labor and income inequalities between skilled and unskilled labor. This link has been also supported in other earlier empirical studies (e.g. Gopinath and Chen, 2003; Basu and Guariglia, 2006). Contrary to what is often asserted trade openness,3
the trade to GDP ratio is negative but insignificant. It means that trade openness is not associated with the changes in income distribution in SSA countries.
Impacts of financial development. Financial development is measured by the share of credit to private sectors in GDP. In all regressions, this indicator has such a negative but statistically insignificant coefficient. On one hand, the negative sign of financial development does not support the basic theoretical assumption of Banerjee and Newman (1993) and Galor and Zeira (1993). According to these authors, financial market imperfections (financial asymmetries, transaction cost, and contract enforcement costs) could be especially binding on the poor, who lack collaterals, credit histories and network relationships. Consequently, even when the poor has projects with high returns, they may still be credit rationed. Under such circumstances, the efficiency of capital allocation is reduced and the social mobility of the poor is limited. Thus, income inequality rises with the development of financial markets. Thankfully, this theoretical hypothesis is not confirmed in the case of SSA countries. The statistically insignificant of the credit-GDP ratio can be explained by the fact that the domestic financial markets in SSA have not been enough developed to enable the significant consequences for the overall distribution of income.
3 In the concerned literature, developing countries’ imports from developed countries bring more sophisticated technology and create a gap between the importing firms, which able to upgrade their assets then increase the skilled labor demand, and the rest of firms. This mechanism has been explained by Feenstra and Hanson (1997) in the case of trade between Mexico and the USA. In an opposite situation, the exporting firms in developing countries are not required to improve the technological level of exporting goods, given that most of them are primary commodities. Thus, a stable or even increasing demand for unskilled labor in exporting firms and a rising demand for skilled labor demand in importing firms may adversely affect income inequality. In general, when a developing country opens to trade, they become more exposed to technologies and innovations produced in more advanced countries. Hence, trade integration, which should involve technological upgrading, leads to a general shift of labor demand towards more skilled workers, a consequent increase in wage differentials and a subsequent increase in inequality.
16
Impacts of human capital. As mentioned in Section 4, one of the hypotheses of interest involves the impacts of human capital on income inequality in SSA. We consider that an increase in education expenditures can improve the quality of human capital in SSA, which in turn reduce the Gini coefficient. As reported in Table 2, the sign of education expenditures variable is negative as expected but econometrically insignificant. This result argues that social expenditure, such as education expenditure, is not a relevant determinant of income inequality reduction in SSA.
Impacts of labor market’s institutions. Labor market’s institutions are measured by minimum wages and labor market regulations index. Both these indicators enter in all regressions with a positive coefficient, but only the coefficient of labor market regulations is statistically significant. This unattended result can be explained by the fact that any improvement in labor market regulations can create a greater gap between the formal and informal sectors in SSA countries, in which the informal economy plays a quite important role. In other words, better labor market regulations seems to only favor activities and wages of the formal sectors, and consequently widen income inequality between formal and informal labor.
Impacts of institutional quality. Institutional quality is captured by a broad set of indicators: democracy index; political stability index; constraints on the executive; government quality; and control of corruption. On one hand, we find no evidence of the impact political stability and executive constraint on income inequality. On the other hand, the coefficients associated to other institutional quality indicators show a negative value but once again insignificant. It means that institutional quality does not play any role in changing income inequality in SSA. This result seems to be consistent with the aid literature, which argues that the quality of institutions does not necessarily reduce inequality and poverty (e.g. Easterly, 2007; Calderon et al., 2009).
Sensitivity of empirical results
This sub-section carries out a set of robustness checks to examine the results’ sensitivity to alternative estimation strategies and data sub-samples. It is needless to say that ODA flows also depend on the historical factors, such as colonial link. If the strategic interests of many colonial powers and their colonies are closely linked, former colonial powers tend to provide large amounts of aid to former colonies. Another important historical factor is the legal
17
origin of ODA recipient countries. Taking into consideration the potential impact of historical factors on the aid-inequality nexus, our first robustness test involves re-estimating all regression of interest for two data sub-sample: (i) SSA countries with French legal origin; and (ii) SSA countries with British legal origin. The results of GMM estimator with robust standard error reported in Table 3-4 show that accounting for the legal origin does not alter the conclusion on the impacts of aid in income inequality, only the magnitudes of estimated coefficients are little affected. Otherwise, the new empirical results provide two complementary results. First, the positive impact of labor institutions is reinforced in the case of French legal origin sub-sample, as the coefficient of minimum wage enters in all regression with a positive and significant value. Second, the role of economic integration as well as democracy in reducing income inequality is confirmed in the case of British legal origin countries. However, the Kuznets curve hypothesis is not confirmed in British legal origin countries when the estimated coefficients of GDP per capita are not statistically significant. This result should be taken with caution, because the absence of a statistically significant coefficient does not mean that economic growth is harmful or irrelevant in SSA British legal origin countries. This can be explained by the fact that economic growth in these countries has not been enough to have significant effects on income inequality, which is so high.
<Insert Table 3-4>
The second referred robustness check is the system-GMM estimator developed by Blundell and Bond (1998). It is because a problem with the original Arellano-Bond estimator is that lagged levels are often weak instruments for first differences, in particular for variables that are close to a random walk. As reported in Table 5, the system-GMM results are, by and large, similar to those of the GMM estimator in terms of sign and significance, but the magnitudes are different as would be expected. In addition, the system-GMM results confirm the significant role of democracy in narrowing income inequality in SSA countries.
<Insert Table 5>
7. Conclusion
Using a large sample of twenty-seven SSA countries over the period 1990-2011, the present paper investigates the potential aid - inequality nexus. Our empirical findings on the impacts of aid as well as other covariates on income inequality are insensitive to a range of datasets and estimation methods. On the one hand, considering the difference in legal origin does not alter the conclusions. The main results on the link between aid and income inequality hold, while others results are affected but qualitatively not too dissimilar. On the other hand, employing the system-GMM estimator gives similar results to those of GMM estimator.
18
Our empirical results reveal that aid flows have an inequality increasing effect in SSA countries, thankfully it is quite small. This unattended impact can be explained in two ways. The first and most popular argument is that foreign aid has ended up in the wrong hands. Second, the main motivations of aid donors may involve economic and politic interests, which are not necessarily in conformity with reducing income inequality in the less-developed world. Overall, we expect that aid does not undermine political and economic initiatives in recipient countries. However, if national policymakers as well as international donors have perverted incentives, aid will be used on less productive and efficient purposes (Bräutigam and Knack, 2004).
On the other hand, we also find that the corruption control can alter the nature of the link between aid and income inequality. It means that foreign aid can foster income equality in SSA countries in the presence of good corruption control. In other words, the nature of redistributive impact of aid, positive or negative, on income inequality effectively depends on the level of corruption control in SSA countries.
To conclude, this study complements the relevant and controversial debate on the inequality impact of foreign aid. Our empirical results offer an important implication for policymakers, who aspire to reduce income inequality by spurring foreign aid in SSA countries. The fact is that foreign aid can only exert an inequality decreasing effect if the corruption is controlled in SSA region. In this context, the effectiveness of aid in terms of fostering income equality, more than ever, should be enhanced.
References
Acemoglu, D., 2003a. “Cross-Country Inequality Trends”, Economic Journal, 113(2), pp.121-49.
African Development Bank Group, 2012. Income Inequality in Africa, Briefing Note 5, Briefing Notes for AfDB’s Long-Term Strategy.
Africa Progress Report, 2013. “Equity in Extractives: Stewarding Africa’s natural resources for all”, Africa Progress Panel, Geneva, Switzerland.
Agénor, P-R., Aizenman, J., 2010. “Aid Volatility and Poverty Traps”, Journal of
Development Economics, 91, pp. 1-7.
Ali, A.M, and Isse, H.S., 2004. “An Empirical Analysis of the effect of Aid on Growth”,
International Advances in Economics Research, 11, pp. 1–11.
Arellano, M., and Bond, S.R., 1991. “Some Tests of Specification for Panel Data: Monte Carlo Evidence and an Application to Employment Equations”, Review of Economic Studies, 58, pp. 277-297.
Armah, S., and Nelson, C., 2008. “Is foreign aid beneficial for Sub-Saharan Africa? A panel Analysis”, Paper presented at American Agricultural Economics Association Annual Meeting, Orlando, FL, July 27-29.
Atkinson, A.B., and Brandolini, A., 2001. “Promise and pitfalls in the use of secondary data sets: Income inequality in OECD countries as a case study”, Journal of Economic
19
Banerjee, A.V., and Newman, A.F., 1993. “Occupational Choice and the Process of Development”, Journal of Political Economy, 101, pp. 274-298.
Basu, P., and Guariglia, A., 2007. “Foreign Direct Investment, Inequality and Growth”,
Journal of Macroeconomics, 29(4), pp. 824-39.
Bjørnskov, C., 2010. “Do elites benefit from democracy and foreign aid in developing countries?”, Journal of Development Economics, 93, pp. 115-124.
Blundell, R., and Bond, S., 1998. “Initial conditions and Moment Restrictions in Dynamic Panel Data”, Journal of Econometrics, 87, pp. 115-144.
Boone, P., 1996. “Politics and the effectiveness of foreign aid”, European Economic Review, 40, pp. 289-329.
Bourguignon, F., Levin, V., and Rosenblatt, D., 2009. “International Redistribution of Income”, World Development, 37(1), pp. 1-10.
Bräutigam, D.A., and Knack, S., 2004. “Foreign Aid, Institutions, and Governance in Sub‐ Saharan Africa”. Economic Development and Cultural Change, 52, pp. 255‐285.
Burnside, C., and Dollar, D., 2000. “Aid, policies, and growth”, American Economic Review, 90(4), pp. 847–868.
Calderon, C., Chong, A., and Gradstein, M., 2009. “Can foreign aid reduce income inequality and poverty?”, Public Choice, 140, pp. 59-84.
Chenery, H., and Strout, A., 1966. “Foreign assistance and economic development”,
American Economic Review, 56, pp. 679–733.
Collier, P., and Dollar, D., 2002. “Aid allocation and poverty reduction”, European
Economic Review, 46(8), pp. 1475 – 1500.
Easterly, W., Levine, R., and Roodman, D., 2004. “Aid, policies and growth: A comment”,
American Economic Review, 94(3), pp. 774–780.
Feenstra, R.C., and Hanson, G.H., 1997. “Foreign Direct Investment and relative wages: evidence from Mexico’s maquiladoras”, Journal of International Economics, 42(3-4), pp. 371-93.
Bastagli, F., Coady, D., and Gupta, S., 2012. “Income Inequality and Fiscal Policy”, IMF
Staff Discussion Note, SDN/12/08.
Galbraith, J.K., 2009. “Inequality, unemployment and growth: New measures for old controversies”, Journal of Economic Inequality, 7, pp. 189-206.
Galor, O., and Zeira, J., 1993. “Income Distribution and Macroeconomics”, Review of
Economic Studies, 60, pp. 35-52.
Easterly, W., 2007. “Are Aid Agencies Improving?”, Economic Policy, 52, pp. 633-68. Gopinath, M., and Chen, W., 2003. “Foreign Direct Investment and Wages: a Cross-Country Analysis”, Journal of International Trade and Economic Development, 12(3), pp. 285-309. Goumanee, M., and Girma, S., and Morrissey, O., 2005. “Aid and Growth in SSA: Accounting for Transmission Mechanisms”, Journal of International Development, 17, pp. 1055 – 1075.
Herzer, D., and Nunnenkamp, P., 2012. “The effect of foreign aid on income inequality: Evidence from panel cointegration”, Kiel Working Paper, No. 1762, Kiel Institute for the World Economy.
Hodler, R., 2007. “Rent seeking and aid effectiveness”, International Tax and Public Finance, 14, pp. 525-541.
Kaufmann, D., Kraay, A., and Massimo, M., 2010. “The Worldwide governance indicators: a summary of methodology, data and analytical issues”, World Bank Policy Research Working Paper, No. 5430.
Kuznets, S., 1955. "Economic Growth and Income Inequality", American Economic Review, XLV(1), pp. 1-28.
Layton, T., and Nielson, D., 2008. “Aiding Inequality: The Effect of Foreign Aid on Income Inequality”, Mimeo, Brigham Young University.
Marshall, M. G. and Taeggers, K. J., 2003. Polity IV project country Reports, CIDUM, University of Maryland.
20
Mosley, P., Hudson, J., and Horrell, S., 1987. “Aid, the public sector and the market in less developed countries”, The Economic Journal, 97, pp. 616 – 641.
Mosley, P., Hudson, J., and Horrell, S., 1992. ““Aid, the public sector and the market in less developed countries: A return to the scene of the crime”, Journal of International
Development, 4(2), pp. 139 – 150.
Moyo, D., 2009. “Dead Aid: Why Aid is not working and How There is Another Way for Africa”, New-York: Farrar, Straus and Giroux.
Nickell, S. 1981. “Biases in dynamic models with fixed effects”, Econometrica, 49, pp.1417-1426.
OECD, 2006. Promoting Pro-poor Growth. Key Policy Messages. Paris, Organization for Economic Co-operation and Development.
Roine, J., Vlachos, J., Waldenstrom, D., 2007. “What determines Top income shares? Evidence from twentieth Century”, IFN Working Paper, No. 721, Research Institute of Industrial Economics.
Solt, F., 2009. "Standardizing the World Income Inequality Database", Social Science
Quarterly, 90(2), pp. 231-242.
Svensson, J., 2000. “Foreign aid and rent-seeking”, Journal of International Economics, 51, pp. 437-461.
Tanzi, V., 1998. “Fundamental determinants of inequality and the role of Government”, IMF Working Paper, WP/98/178.
Todaro, M.P., and Smith, S.C., 2011. Economic Development, 11/E, Pearson.
Van de Walle, N., 2001. African economies and the politics of permanent crisis, 1979-1999. Cambridge: Cambridge University Press.
Wang, J.Y., and Blomstrom, M., 1992. “Foreign Investment and Technology Transfer: A Simple Model”, European Economic Review, 36, pp.137-55.
World Investment Report, 2009. “Transnational Corporations, Agricultural Production and Development”, United Nations Conference on Trade and Development.
Zhao, L., 1998. “The Impact of Foreign Direct Investment on Wages and Employment”,
21 Appendix A: Data description
Selected countries
Low-income (22) Benin; Burkina Faso; Burundi; Central African Republic; Chad; Comoros; Ethiopia; Gambia; Guinea; Guinea-Bissau; Kenya; Madagascar; Malawi; Mali; Mozambique; Niger; Rwanda; Sierra Leone; Tanzania; Togo; Uganda; Zimbabwe
Lower middle income (10) Cabo Verde; Cameroon; Cote d’Ivoire; Ghana; Lesotho; Mauritania; Nigeria; Senegal; Swaziland; Zambia;
Upper middle income (5) Angola; Botswana; Mauritius; Namibia; South Africa;
Variables Definition Sources
Gini Coefficient Income inequality indicator Standardized World Income
Inequality Database (SWIID v.5)
ODA Share of ODA in GNI (%) World Development Indicators
FDI Inflows of FDI as a share of
GDP (%)
World Development Indicators
OPEN Share of total exports and
imports in GDP (%)
World Development Indicators
GDPp GDP per capita (constant 2005
US$)
World Development Indicators
INF Inflation rate (%) World Development Indicators
FD Share of banking credit to
private sectors in GDP (%)
World Development Indicators
MW Minimum wages Fraser Institute, Economic
Freedom of the World (2008)
LMR Labor market regulations Fraser Institute, Economic
Freedom of the World (2008)
HC Education expenditures (%
GNI)
World Development Indicators
LEG (1-5) Legal origin dummies Global Development Network
Database (GDN)
POLITY2 Index of democracy PolityIV Database (Marshall
and Taeggers, 2003)
DURABLE Index of political stability PolityIV Database (Marshall
and Taeggers, 2003)
COX Constraints on the executive PolityIV Database (Marshall
and Taeggers, 2003)
GQ Government quality Author’s calculation from
Worldwide Governance
Indicators, Kaufmann et al. (2010)
COR Control of corruption Worldwide Governance
Indicators, Kaufmann et al. (2010)
22
Figure 1: Income inequality in SSA low-income countries, 1990 – 2011
Source: Author’s creation from SWIID database, version 5
Figure 2: Income inequality in SSA lower-middle income countries, 1990 – 2011
Source: Author’s creation from SWIID database, version 5
0 20 40 60 80
Malawi Benin Burkina Faso
Burundi Central African Republic Chad
Comoros Ethiopia Gambia
Guinea Guinea-Bissau Kenya
Madagascar Mali Mozambique
Niger Rwanda Sierra Leone
Sierra Leone Somalia Tanzania
Togo Uganda Zimbabwe
0 10 20 30 40 50 60 70
Nigeria Cameroon Cape Verde Cote d'Ivoire Ghana
23
Figure 3: Income inequality in SSA upper-middle income countries, 1990 – 2011
Source: Author’s creation from SWIID database, version 5
Figure 4: ODA recipients 1960-2013 (US$ Million)
Source: Author’s creation from OECD-DAC database
0 10 20 30 40 50 60 70 80 90 1 9 9 0 1 9 9 1 1 9 9 2 1 9 9 3 1 9 9 4 1 9 9 5 1 9 9 6 1 9 9 7 1 9 9 8 1 9 9 9 2 0 0 0 2 0 0 1 2 0 0 2 2 0 0 3 2 0 0 4 2 0 0 5 2 0 0 6 2 0 0 7 2 0 0 8 2 0 0 9 2 0 1 0 2 0 1 1
South Africa Angola Botswana Mauritius Namibia Seychelles
0 50000 100000 150000 200000 250000 1 9 6 0 1 9 7 0 1 9 8 0 1 9 9 0 2 0 0 0 2 0 1 3
All Recipients Africa - North of Sahara Sub-Saharan Africa
America Asia Europe
2 4 F ig u re 5 : S S A C o u n tr ie s w ith O D A e xc es s o f 5 0% o f g o v er n m en t e xp en se s, 20 13 S ou rc e: A u th or ’s c re at io n fr om W D I d at ab as e F ig u re 6 : C o u n tr ie s w ith O D A e xc es s o f 1 0% o f G N I, 20 13 S ou rc e: A u th or ’s c re at io n fr om W D I d at ab as e 0 20 40 60 80 1 0 0 1 2 0 1 4 0 0 5 10 15 20 52 30 35 40 45 Tuvalu Liberia Marshall Islands Solomon Islands Micronesia, Fed. Sts. Afghanistan Malawi Kiribati Burundi Sao Tome and Principe West Bank and Gaza Tonga Haiti South Sudan Samoa Gambia, The Cabo Verde Mozambique Niger Vanuatu Sierra Leone Rwanda Comoros Mauritania Burkina Faso Central African Republic Congo, Dem. Rep. Tanzania Mali Cote d'Ivoire
25
Table 1: Summary statistics and Correlation coefficients (615 observations)
Variable
Mean
Standard Deviation
Min Max Cor.
coef
Overall Between Within
GINI 3.80 0.18 0.16 0.09 3.26 4.34 1.00
ODA (% of GNI) 2.02 1.24 1.08 0.49 -2.30 4.55 -0.30*
FDI (% of GDP) 0.07 1.91 1.33 1.48 -13.55 3.84 0.14*
OPEN (Trade/GDP) 4.12 0.46 0.43 0.19 2.37 5.35 0.34*
Credit to private sectors 2.50 0.84 0.74 0.40 -0.22 4.43 0.19*
GDP per capita 6.37 0.94 0.90 0.15 4.74 8.67 0.52*
Quadratic GDP per capita 41.41 12.86 12.28 2.01 22.42 75.15 0.51*
Inflation rate 1.94 1.28 0.84 0.98 -3.50 8.33 0.14*
Education expenditures 1.20 0.56 0.47 0.28 -0.16 4.22 0.26*
Minimum wage 5.82 3.08 2.84 1.23 0.00 10.00 0.19*
Labor market regulations 5.95 1.67 1.62 0.48 2.43 9.10 0.05
Index of democracy 1.20 5.58 4.58 3.26 -9.00 10.00 0.10*
Index of political stability 10.39 11.47 7.92 8.41 0.00 81.00 0.04
Constraints on the
executive -1.57 21.52 11.09 18.53 -88.00 7.00 0.07*
British legal origin 0.46 0.50 0.50 0.00 0.00 1.00 0.41*
French legal origin 0.54 0.50 0.50 0.00 0.00 1.00 -0.41*
Government quality -0.57 0.61 0.59 0.18 -1.82 0.84 0.25*
Control of corruption -0.51 0.56 0.52 0.23 -1.52 1.25 0.26*
26
Table 2: GMM estimator’s results
Independent variables Model 1 Model 2 Model 3 Model 4
Lagged GINI 0.754*** (0.041) 0.745*** (0.043) 0.687*** (0.050) 0.683*** (0.051)
ODA 0.027*** (0.011) 0.014* (0.007) 0.015*** (0.005) 0.011* (0.006)
ODA×Corruption - -0.011* (0.005) - -0.012** (0.005)
FDI - - 0.001 (0.001) 0.001 (0.001)
OPEN (Trade/GDP) - - -0.008 (0.013) -0.008 (0.013)
Credit to private sectors - - -0.006 (0.013) -0.005 (0.013)
GDP per capita - - 0.369* (0.199) 0.348* (0.188)
Quadratic GDP per capita - - -0.030* (0.016) -0.028* (0.015)
Inflation rate - - -0.002 (0.00(2) -0.002 (0.002)
Education expenditures - - -0.010 (0.011) -0.011 (0.011)
Minimum wage - - 0.002 (0.002) 0.002 (0.002)
Labor market regulations - - 0.017** (0.007) 0.017** (0.007)
Index of democracy - - -0.001 (0.001) -0.001 (0.001) Political stability - - 0.000 (0.000) 0.000 (0.000) Executive Constraints - - 0.000 (0.000) 0.000 (0.000) Government quality - - -0.006 (0.019) 0.001 (0.021) Control of corruption - - -0.024(0.016) - Constant 0.924*** (0.151) 0.933*** (0.161) -0.034(0.647) 0.069 (0.613)
Serial Corr. (m1) P-value -2.902 (0.002) -2.936 (0.004) -2.951 (0.003) -2.953 (0.003) Serial Corr. (m2) P-value 1.615 (0.125) 1.507 (0.134) 0 .986 (0.323) 0.886 (0.375) Note: Values in parentheses are robust standard errors. Values in brackets are P-values. *** (**; *): Significant at 1%, 5% and 10% level respectively.
27
Table 3: GMM estimator’s results for country with French legal origin
Independent variables Model 1 Model 2 Model 3 Model 4
Lagged GINI 0.787*** (0.052) 0.790*** (0.047) 0.773*** (0.059) 0.765*** (0.062)
ODA 0.027** (0.010) 0.019* (0.010) 0.020*** (0.006) 0.015* (0.008)
ODA×Corruption - - -0.006 (0.005)
FDI - - 0.000 (0.002) 0.000 (0.002)
OPEN (Trade/GDP) - - 0.014 (0.018) 0.013 (0.018)
Credit to private sectors - - -0.007 (0.016) -0.007 (0.017)
GDP per capita - - 0.413** (0.138) 0.400** (0.151)
Quadratic GDP per capita - - -0.031** (0.011) -0.030** (0.012)
Inflation rate - - 0.001 (0.002) 0.001 (0.002)
Education expenditures - - -0.011 (0.013) -0.013 (0.013)
Minimum wage - - 0.004* (0.002) 0.004* (0.002)
Labor market regulations - - 0.012* (0.007) 0.013* (0.007)
Index of democracy - - 0.000 (0.002) 0.000 (0.002) Political stability - - 0.000 (0.001 0.000 (0.001) Executive Constraints - - 0.000* (0.000) 0.000* (0.000) Government quality - - -0.018 (0.020) -0.010 (0.018) Control of corruption - - -0.003 (0.016) - Constant 0.733*** (0.185) 0.729*** (0.166) -0.647 (0.374) -0.584 (0.388)
Serial Corr. (m1) P-value -2.548 (0.011) -2.592 (0.001) -2.447 (0.014) -2.447 (0.014) Serial Corr. (m2) P-value 2.946 (0.349) 2.621 (0.534) 0.470 (0.637) 0.471 (0.637)
Note: Values in parentheses are robust standard errors. Values in brackets are P-values. *** (**; *): Significant at 1%, 5% and 10% level respectively.
28
Table 4: GMM estimator’s results for country with British legal origin
Independent variables Model 1 Model 2 Model 3 Model 4
Lagged GINI 0.867*** (0.060) 0.843*** (0.058) 0.724 (0.076) 0.724*** (0.076)
ODA 0.005 (0.007) 0.012 (0.009) 0.022 (0.006) 0.022*** (0.008)
ODA×Corruption - - - 0.009 (0.006)
FDI - - -0.003* (0.002) -0.003* (0.002)
OPEN (Trade/GDP) - - -0.038* (0.023) -0.037* (0.022)
Credit to private sectors - - 0.005 (0.013) 0.004 (0.013)
GDP per capita - - 0.031 (0.195) -0.028 (0.212)
Quadratic GDP per capita - - 0.004 (0.013) 0.008 (0.015)
Inflation rate - - -0.003 (0.003) -0.003 (0.003)
Education expenditures - - -0.008 (0.010) -0.010 (0.010)
Minimum wage - - -0.003 (0.004) -0.001 (0.004)
Labor market regulations - - 0.014** (0.007) 0.014** (0.007)
Index of democracy - - -0.003* (0.002) -0.003* (0.002) Political stability - - 0.000 (0.000) 0.000 (0.000) Executive Constraints - - 0.000 (0.000) 0.000 (0.000) Government quality - - -0.037 (0.042) -0.043 (0.041) Control of corruption - - 0.002 (0.014) - Constant 0.503** (0.237) 0.593** (0.230) 0.688 (0.663) 0.921 (0.753)
Serial Corr. (m1) P-value -2.254 (0.023) -2.215 (0.020) -2.439 (0.014) -2.424 (0.015) Serial Corr. (m2) P-value 1.481 (0.148) 1.421 (0.156) 1.084 (0.278) 1.032 (0.302)
Note: Values in parentheses are robust standard errors. Values in brackets are P-values. *** (**; *): Significant at 1%, 5% and 10% level respectively.
29
Table 5: Results of dynamic-GMM estimator
Independent variables Model 1 Model 2 Model 3 Model 4
Lagged GINI 0.853*** (0.041) 0.859*** (0.041) 0.757*** (0.046) 0.763*** (0.047)
ODA 0.020*** (0.007) 0.014* (0.008) 0.024*** (0.007) 0.016*** (0.006)
ODA×Corruption - - -0.012** (0.006)
FDI - - 0.002 (0.002) 0.002 (0.002)
OPEN (Trade/GDP) - - -0.030** (0.015) -0.031** (0.014)
Credit to private sectors - - -0.011 (0.011) -0.010 (0.012)
GDP per capita - - 0.123* (0.069) 0.159** (0.063)
Quadratic GDP per capita - - -0.004** (0.002) -0.007** (0.003)
Inflation rate - - 0.000 (0.002) 0.000 (0.002)
Education expenditures - - -0.023 (0.014) -0.023 (0.014)
Minimum wage - - 0.002 (0.002) 0.002 (0.002)
Labor market regulations - - 0.021*** (0.006) 0.022*** (0.006)
Index of democracy - - -0.003* (0.001) -0.003* (0.001) Political stability - - 0.000 (0.000) 0.000 (0.000) Executive Constraints - - 0.000 (0.000) 0.000 (0.000) Government quality - - -0.021 (0.025) 0.009 (0.023) Control of corruption - - 0.009 (0.017) - Constant 0.515*** (0.159) 0.496*** (0.158) 0.290 (0.613) 0.183 (0.587)
Serial Corr. (m1) P-value -3.041 (0.001) -3.06 (0.004) -3.246 (0.001) -3.310 (0.001) Serial Corr. (m2) P-value 1.567 (0.128) 1.498 (0.176) 0.401 (0.688) 0.308 (0.757)
Note: Values in parentheses are robust standard errors. Values in brackets are P-values. *** (**; *): Significant at 1%, 5% and 10% level respectively.