HAL Id: hal-01005344
https://hal-enpc.archives-ouvertes.fr/hal-01005344
Submitted on 12 Jun 2014HAL is a multi-disciplinary open access archive for the deposit and dissemination of sci-entific research documents, whether they are pub-lished or not. The documents may come from teaching and research institutions in France or abroad, or from public or private research centers.
L’archive ouverte pluridisciplinaire HAL, est destinée au dépôt et à la diffusion de documents scientifiques de niveau recherche, publiés ou non, émanant des établissements d’enseignement et de recherche français ou étrangers, des laboratoires publics ou privés.
Experimental study on the mechanical behaviour of a
heat exchanger pile using physical modelling
Neda Yavari, Anh Minh Tang, Jean-Michel Pereira, Ghazi Hassen
To cite this version:
Neda Yavari, Anh Minh Tang, Jean-Michel Pereira, Ghazi Hassen. Experimental study on the me-chanical behaviour of a heat exchanger pile using physical modelling. Acta Geotechnica, Springer Verlag, 2014, 9 (3), pp.385-398. �10.1007/s11440-014-0310-7�. �hal-01005344�
1
Written date: August 26, 2013
Experimental study on the mechanical behaviour of a heat
exchanger pile using physical modelling
Neda YAVARI, Anh Minh TANG, Jean-Michel PEREIRA, Ghazi HASSEN Université Paris-Est, Laboratoire Navier (UMR 8205), CNRS, ENC, IFSTTAR, F-77420
Marne-la-Vallée
Corresponding author Dr. Anh Minh TANG Université Paris-Est
Laboratoire Navier/Géotechnique (CERMES) Ecole des Ponts ParisTech
6-8 avenue Blaise Pascal, Cité Descartes, Champs-sur-Marne 77455 Marne-la-Vallée France Email : [email protected] Phone : +33 1 64 15 35 63 Fax : +33 1 64 15 35 62
2
Abstract:
This study aims to provide knowledge on the thermo-mechanical behaviour of heat exchanger piles, through a laboratory scale model. The model pile (20 mm in external diameter) was embedded in dry sand. The behaviour of the axially loaded pile under thermal cycles was investigated. After applying the axial load on the pile head, the pile‟s temperature was varied between 5 °C and 30 °C. Seven tests, corresponding to various axial loads ranging from 0 to 70 % of the pile estimated bearing capacity, were performed. The results on pile head displacement show that heating under low axial load induced heave and cooling induced settlement; the pile temperature-displacement curve was found to be reversible and compatible with the thermal expansion curve of the pile. However, at higher axial loads, irreversible settlement of the pile head was observed after a few thermal cycles. The axial load profile measured by the strain gauges evidenced that the pile head load was mainly transferred to the pile toe. Nevertheless, thermal cycles modified significantly the mobilised skin friction along the pile. The total pressure measured at various locations in the soil mass was also slightly influenced by the thermal cycles.
Key words: energy pile, small-scale test, thermo-mechanical loading, settlement, temperature, axial force profile.
3
1. Introduction
Energy piles are among construction technologies that are compatible with the principles of sustainable development. They transfer the load of a building to the soil and work at the same time as thermal boreholes and exchange heat between the building as a source whose temperature changes along with different seasons and the ground as a source of constant temperature throughout the year. Thermal effects added up to mechanical ones could modify the design criteria which are stated in common foundation design codes. Many studies could be found in the literature, which justify the feasibility of this technology from an economic and energy point of view [5, 6, 8, 22]. However, there is little research on geotechnical aspects of heat exchanger piles. Only limited amount of data are available via some in-situ tests [5, 13]. Over recent years laboratory scale tests have also been performed to study the geotechnical aspects of energy piles.
Laloui et al. [12] have conducted in-situ tests on one of the piles of a four-story building under construction at Lausanne. The pile toe was founded on a sandstone layer and its head was blocked by the weight of the building that gradually increased by adding on each floor (from 0 to 1300 kN). One U-shaped polyethylene tube, which was fixed in the pile during casting, let the water circulate along the pile as a heat carrying fluid. The pile was equipped with vibrating strain gauges and fibre optic extensometers as well as a load cell at pile toe for measuring vertical and radial strains, temperature and load. At each stage of construction, a temperature change was imposed to the pile, which was equal to 22 °C in the first test and 15 °C in the other ones. Observation showed changes of axial strain along the pile under thermo-mechanical loads. Axial force at pile toe was more influenced and could be twice as great as that in the case of purely mechanical loading. Results also confirm the elastic behaviour during thermal cycles. These experimental results were then analysed numerically using a thermo-hydro-mechanical model [13].
In another work, conducted by Bourne-Webb et al. [4], one of the test working piles, which were used for verifying the foundation design as well as a heat sink pile, were chosen. Piles were installed in London clay while their heads were free to move. The heat sink pile was not loaded mechanically; it was only subjected to thermal cycles. The main test pile, instrumented by strain gauges and thermistors, was loaded by 1200 N of axial load prior to being subjected to temperature changes between -6 °C and 40 °C. The experimental results show that the axial load along the pile increased by heating and decreased by cooling while pile toe was less
4
affected. While heating, the shaft resistance increased in the upper part of the pile and decreased in the lower part. The trend was reversed while cooling.
Amatya et al. [2] analysed the mentioned in situ experiments and concluded that the induced effects of thermo-mechanical loading depended on the duration and intensity of thermal loads, end restraint (at head and toe) and also geotechnical characteristics of successive soil layers. In the tests presented by Laloui et al [12] where pile head was blocked and its end stayed on a stiff soil, the axial forces at both head and toe were influenced by thermo mechanical loading and axial force increase was uniform. While in the test presented by Bourne-Webb et al. [4], where pile was installed in stiff clay and its head was free to move, the induced thermal stresses at pile head and toe were negligible and axial force changes were not uniform.
In situ tests are powerful experimental tools as they give an insight into real conditions under real scales. However they are expensive and rather time consuming.
Some authors attempted to develop numerical codes that could predict the behaviour of operational energy piles [13, 18]. These models need field data for validation and parameter definition. Therefore, this approach can be difficult to be applied considering the remarkable influence of pile installation and geological profile, which is different from one site to another. Centrifuge modelling could simulate the linear increase of effective stress with depth [19] when simulating general foundation piles and permits the evaluation of the variables affecting the deformation and failure response of energy pile foundations. McCartney and Rosenberg [18] used this method to study the response of thermo-active foundations. Four concrete piles with 379-mm length and 76-mm diameter were pre-casted in a cylindrical aluminium container with a height of 500 mm and a diameter of 381 mm. A U-shaped aluminium tube was installed in the piles to conduct the heat exchanger fluid (which was a silicone fluid). Silty soil was compacted in the container until the maximum dry density, 17.2 kN/m3. A loading frame was made around the container and loads between 0 and 1000 kN were applied to the top of the foundations. The tests were performed at a g-level of 24 in order to represent 24-times greater piles (9.1 m length and 1.8 m diameter). Loading under controlled displacement rate of 0.2 mm/min were performed until a displacement of 5 mm. One test was conducted at the ambient temperature of 15 °C. In the two other experiments pile was first heated to 50 °C and 60 °C and then it was loaded. Three tests were performed at constant temperatures of 15 °C, 50 °C and 60 °C. The results show that by heating the pile, its
5
bearing capacity increased. The authors explain this increase by the increase of drained shear distribution along the pile due to soil compression during the heating phase.
Through a laboratory scale model, Wang et al. [21] evaluated the effect of temperature change on shaft resistance. The model pile, an empty steel tube, was embedded in sand. Loading and unloading cycles were applied to the pile at a rate of 0.08 mm/min until stabilize behaviour was observed. The pile was then heated up to 40 °C for 20 hours. The loading/unloading cycles continued afterwards. The results show that the shaft resistance decreased as the pile was heated.
In another small-scale experiment, Kalantidou et al. [11] used an aluminium tube with a diameter of 20 mm and a length of 800 mm as a model pile. The surrounding soil was the Fontainebleau sand and compaction was performed manually. The pile was first heated from 25 °C to 50 °C by means of a heating bath, and then it was allowed to cool down. Two thermal cycles, as described, under different head loads were conducted. Pile head displacement versus the imposed temperature was monitored. Under low values of load (about 40 % of the pile final resistance) pile behaviour was found to be thermo-elastic. On the contrary, under greater loads irreversible settlement was observed after thermal cycles.
Small-scale tests are valuable tools especially for research purposes as they can be repeated and are inexpensive. Like any other experimental method they have some disadvantages, such as staying in low stress ranges and lack of scale factors for generalizing the results obtained via a little model to a prototype.
In this study, a laboratory scale test, similar to that presented by Kalantidou et al [11], was used. Their physical model was completed by adding up strain gauges to the pile surface for the measurement of axial load at various levels along the pile. Total pressure and temperature were also measured at various locations in the soil surrounding the pile. To perform a test, a constant axial load was first applied to the pile head and the pile temperature was then varied from 5 °C to 30 °C; two temperature cycles were applied for each tests. Various tests have been performed with an axial head load ranging from 0 % to 70 % of pile estimated bearing capacity. The results allow to show the mechanical behaviour of an energy pile under coupled thermo-mechanical loadings in terms of pile head settlement, pile axial load profile, total pressure in soil, and temperature in soil and along the pile.
6
2. Experimental setup
The experimental set-up is presented in Figure 1 and more details are shown in Figure 2. Dry Fontainebleau sand (with mean size D50 = 0.23 mm), was compacted at a dry density of 15.1 kN/m3 (50 % of relative density) inside a cylinder container with a diameter of 548 mm and a height of 880 mm. Three layers of 100, 100 and 50 mm were first compacted; pile was then installed and fixed to its final position by means of a metal holder. Compaction of the soil around the pile was then continued in 6 layers of 100 mm. Such a compaction procedure by layer allows to control the mean value of soil density at each layer. At the end of the compaction process the fixation system was removed and the pile was ready for loading. The model pile is a closed ended aluminium tube. The length of the pile is 800 mm and its outer and inner diameters are 20 mm and 18 mm respectively. It has to be noted that the dimension of the soil container (compared to the pile dimension) was chosen so that the size effect became negligible. According to Parkin and Lunne [17] a ratio of the container diameter to the pile diameter of 20 is sufficient. In this work, the distance from the pile toe to the bottom of the container was 12.5 times greater than the pile diameter. The ratio of 10 was used in the works of Le Kouby et al. [15]. To minimize the scale effect, Fioravante [9] suggested a minimum ratio of pile diameter to D50 of the soil of 50, which was about 87 in the present study.
To monitor the pile behaviour, five strain gauges (G1 to G5) and three temperature gauges (T1 to T3) were stuck to its external surface (Figure 2). In order to increase the pile surface roughness, a coat of sand was stuck to the pile, covering its entire external surface including the mentioned gauges. It is noteworthy that the strain and temperature gauges are 8 mm by 8 mm thin metal foils within a thickness of few μm. The diameter of the wires connecting these gauges is smaller than 0.5 mm. The coat of sand covers all the gauges and the wires. As a consequence, the effect of these gauges on the pile/soil interaction can be ignored. Next, one temperature sensor was placed inside the pile. One displacement transducer was fixed at its head. The pile was then filled with water to facilitate heat transfer inside it. A U-shaped thin aluminium tube containing water was installed inside the pile and connected to the heating/cooling circulator. The loading system was composed of a water container that could be gradually filled with (or in case of unloading emptied from) water (Figure 1). To follow the induced effects of thermo-mechanical loading in soil, eleven temperature transducers (S2 to S12) were distributed at different positions (as can be seen in Figure 2). At depths of 100-mm, 300-mm and 500-100-mm, three temperature sensors could be found at each level, one was
7
fixed close to the pile, the second one was placed close to the container wall and the third was installed in the middle. Ten positions were also defined for total pressure transducers. The sensing surface of the utilized transducers could be turned in order to measure the value of the normal stress in different directions. Thus, P1, P2, P4 and P7 measure the vertical stress at depths of 850, 650, 500 and 300 mm. Moreover, P3 measures horizontal stress at a depth of 650 mm (below the pile), P5, P6, P8 and P9 measure the horizontal stress in two perpendicular directions at depths of 500 and 300 mm. P10 which was stuck to the container wall measures the horizontal stress applied to the soil boundaries at 300-mm depth.
3. Experimental procedure and test program
Two sets of experiments were conducted: purely mechanical tests and thermo-mechanical ones. The test program is shown in Figure 3. In the mechanical test (test E1), the pile was loaded axially until failure, which is conventionally taken as the vertical displacement equal to 10 % of the pile diameter (2 mm in this case), under ambient temperature. For this part, incremental loading according to the procedure recommended by the French code for static axial loading of piles [1] was adopted. Loading started with a preparation phase when the pile was loaded to 0.1Qmax just for 15 minutes, where Qmax is the maximum force at which the test pile is expected to reach failure. Subjecting the pile first to a small load, disturbances caused during pile installation should be removed. At the first main phase that follows, the pile was loaded up to 0.5Qmax by the increments of 0.1Qmax which were maintained for 60 minutes. The pile was unloaded afterwards. During the second phase, loading started with exactly the same increments of 0.1Qmax but this time the steps were kept for 30 minutes until 0.5Qmax. After that load was increased by the increments of 0.1Qmax maintained for 60 minutes until failure. According to test E1 and some other similar mechanical tests, Qmax was estimated to be equal to 450 N. Thus during the first phase, the pile was loaded until 200 N. Considering the loading system, the minimum load that could be applied to the pile is the weight of the empty container. For this reason, in the preparation phase, the pile was subjected to 100 N. In the thermo-mechanical tests (tests E2 to E7), the pile was first loaded up to a defined value. The axial load was then kept constant and two thermal cycles between 5 °C and 35 °C were started. Thermal loading is conducted by increments of 5°C. At each thermal loading step, a temperature change of +5°C in the case of heating and -5°C in the case of cooling was applied to the pile with a rate of about 5°C/h. Once the target temperature reached, it was kept constant for at least two hours. In this work, the thermo-mechanical tests were conducted under different loads of 0, 100, 150, 200, 250 and 300 N (see Figure 3).
8
It should be noted that after each test, head load was removed, the pile was extracted and the soil container was emptied. The soil was compacted again for the following test and the procedure mentioned above was resumed.
4. Experimental results
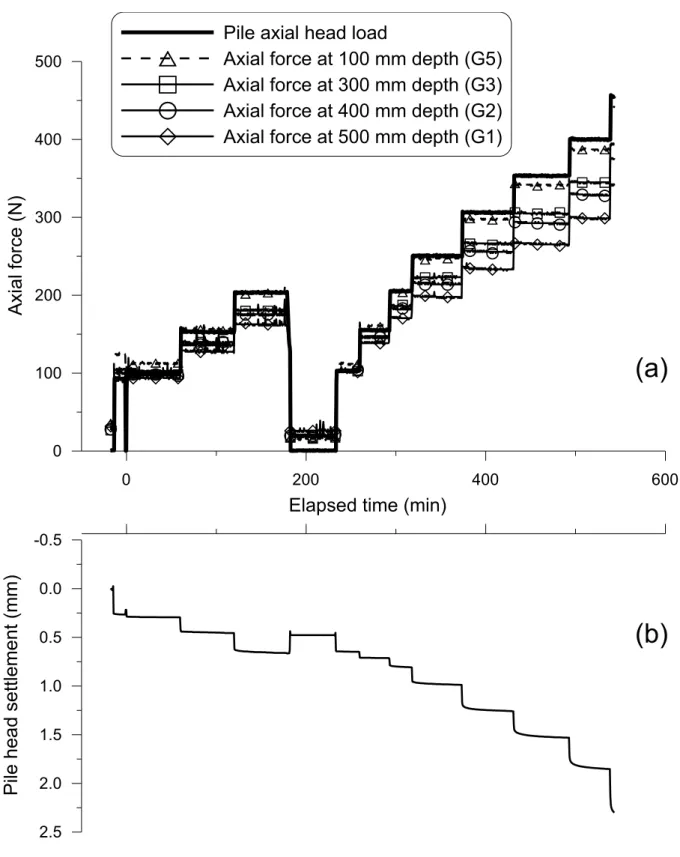
The results of test E1 are shown in Figure 4 to Figure 8. The axial forces measured at the pile head and at various locations along the pile (measured by strain gauges) are shown versus elapsed time in Figure 4a. Note that the strain gauge G4 has failed and data from this gauge was not available. The pile head displacement measured is shown in Figure 4b. The test was stopped when the pile head displacement reached 2 mm, which correspond to a pile head load of 450 N. It can be noted that the displacement transducer reacted immediately to load changes.
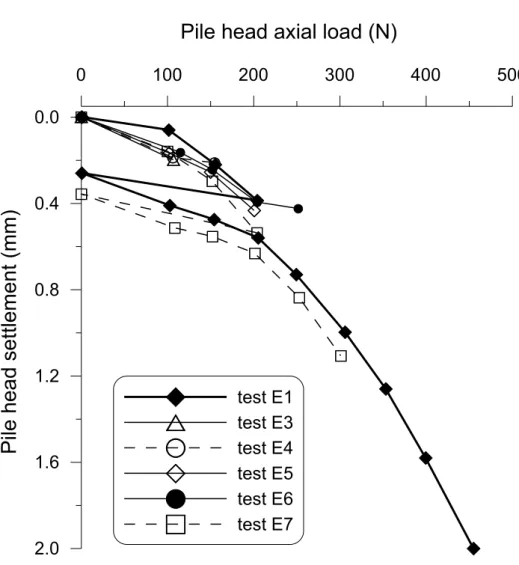
Figure 5 presents the curves of pile head displacement versus load obtained from test E1 and the mechanical part of the other tests. In the tests E3 to E6, pile was loaded to 100 N, 150 N, 200 N and 250 N respectively. Considering the ultimate load of 450 N, 50% of the maximum load was 225 N, which is close to 250 N. Thus, in test E6, the unloading/reloading phase was neglected. On the contrary for test E7, as the target value of 300 N is definitely higher than 50 % of the maximum load, the pile was unloaded after 200 N and the second phase of loading with exactly the same increments of the purely mechanical test was performed. The results show that the experimental procedure leads to a good repeatability of the pile head displacement/axial load curve.
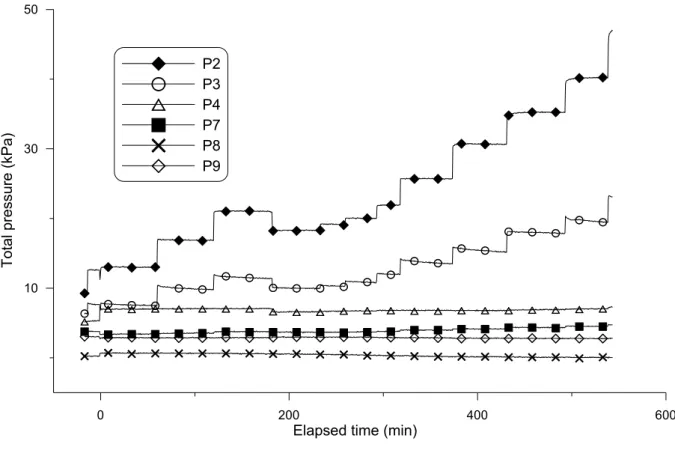
In Figure 6, changes in soil pressure at different positions in the soil during test E1 could be observed. Ten pressure transducers were used during the test, among which six have operated. The pressure measured at the initial point of each curve is the value of stress just after the compaction of the sand layers in the container. It can then be compared to the conventional values γz for vertical stress and K0γz for horizontal stress at rest (where γ is the soil unit weight, γ = 15 kN/m3; z is the depth; and K0 is the coefficient of lateral earth pressure at rest, K0 = 0.5). For example, the initial measured and calculated stress at P2 are almost the same and equal to 10 kPa. The measured value at P3, about 7 kPa, is comparable to the theoretical value of 5 kPa. During the mechanical loading of test E1, only the soil pressures measured at P2 and P3, that were situated 50 mm below the pile, were significantly modified; pressure at
9
P2 increased from 10 kPa to 45 kPa at the end of the test. The changes in soil pressure measured by other sensors were not significant.
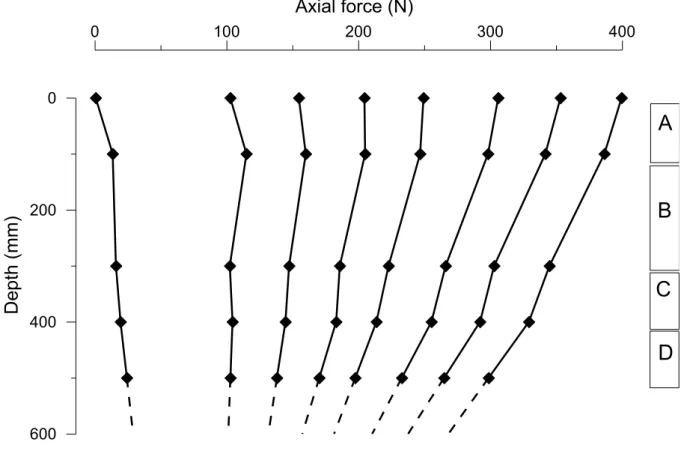
In Figure 7, axial force distributions along the pile obtained at the end of each loading step in test E1 (Figure 4a) are plotted. One axial force profile was also derived before applying the loading steps started to be carried out. This profile could indicate the pre-stress existing in the pile due to the effects of installation. As a partially linear decrease of the load with depth could be observed, the value of load at pile toe, where no gauges were installed, could be estimated by extrapolation from the two last measured loads at G1 (500-mm depth) and G2 (400-mm depth). The extrapolated part is shown in dashed lines. Under 100 N, the same force value (of 100 N) could be observed throughout the pile. In other words, no friction was yet mobilized at the soil/pile interface. As the load increases, the effect of mobilized friction became more significant; at 400 N of axial head load, about 70% of the head load was transmitted to the pile toe. From Figure 7, fours zone A, B, C, D could be defined to calculate the mobilized friction along the pile.
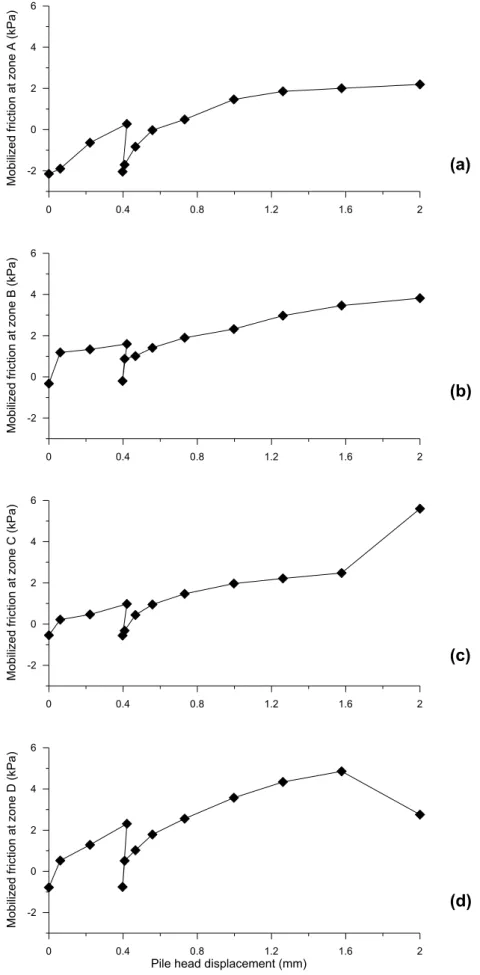
Figure 8 shows the mobilized friction along the pile versus pile head settlement for zones A, B, C and D (see Figure 7). Mobilized friction corresponds to the loss of axial load divided by the total area of the soil/pile interface at each zone. The results show that mobilized friction increased progressively with the pile head displacement during the first loading phase. When the pile was unloaded, the mobilized friction decreased and reached the initial value. By the second loading phase, it increased again. During the first loading steps this increase was much more significant but as failure approached the slope of the curve became smaller. A sudden change in the friction values at higher depths (zones C and D) could be observed as failure was approaching.
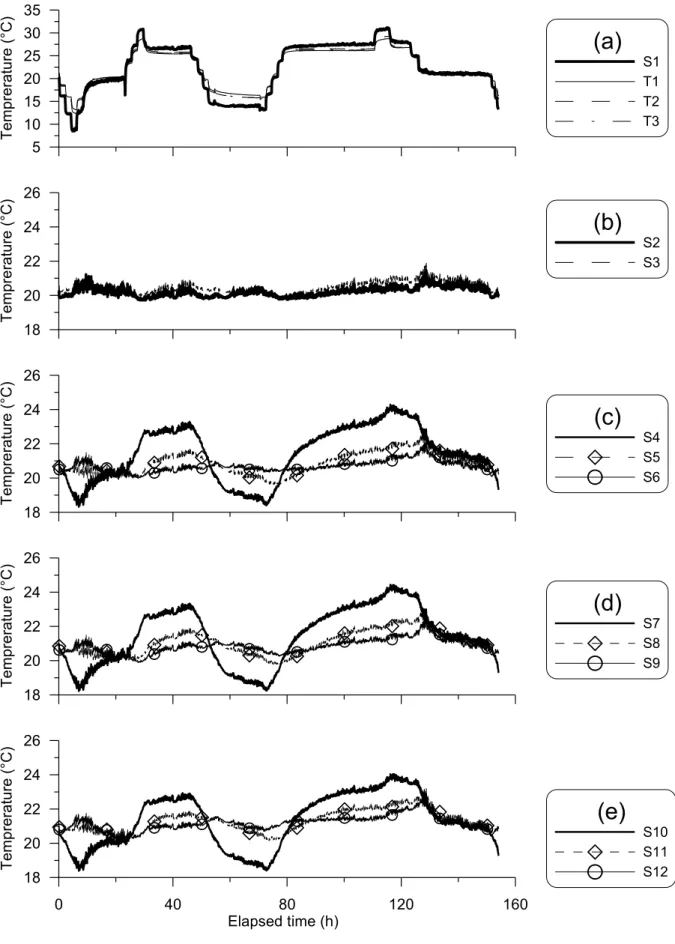
In Figure 9, the temperature measured at various locations in test E2 is shown. The results obtained from the other tests were similar. Figure 9a show the measurements of temperature along the pile. As mentioned above, T1 to T3 are the temperature sensors stuck to the pile and S1 is the one placed inside the pile. Two thermal cycles were applied as follows: a cooling phase down to 5 °C was first conducted by increments of 5 °C. Heating then started by the same increments up to 35 °C. The minimum temperature recorded by S1 was 8 °C and the maximum was 30 °C. The T1 to T3 measurements, which are similar, varied from 12 °C to 28 °C. The temperature changes seemed to stabilize by the end of two hours during which the temperature remains unchanged. The data recorded by the other sensors distributed in the soil
10
are presented in Figure 9b to Figure 9e. S2 was fixed to the bottom of the container while S3 situated 100 mm below the pile toe. At these levels temperature seemed not to be influenced by the pile temperature changes. Sensors S4, S7 and S10 which were placed nearby the pile but at the depths of 500-mm, 300-mm and 100-mm show a total temperature change of about 5 °C between the end of cooling and the end of the heating phases. The changes of temperature measured at the others sensors were less significant. In addition, it can be noted that the temperature changes measured at three depths and at the same distance from the pile were quite similar; S4, S7, S10 recorded the same temperatures during the test. This is also the case for the sets of S5, S8, S11 and S6, S9, S12.
Pile head displacement variations versus elapsed time are shown in Figure 10 (a, c, e, g, i, k) for the tests E2, E3, E4, E5, E6, E7, respectively during the thermal cycles. In Figure 10 (b, d, f, h, j, l), the results of these tests are shown in terms of pile head settlement versus pile temperature (measured by the temperature gauges stuck on the pile surface). In these figures, the pile thermal expansion curve, which expresses the deformation of a pile restrained at toe, but free in other directions under a temperature change, is also plotted. The slope of the
theoretical curve is then equal to α (linear expansion coefficient, α = 22×10-6
°C-1 for aluminium). For test E2 where the pile was not loaded axially, the results show pile head heave during heating and settlement while cooling. The relationship between pile head settlement and the pile temperature is reversible and follows the pile thermal expansion curve (Figure 10b).
In Figure 10c pile head displacement under a small value of load (100 N, almost 20 % of the ultimate resistance of the pile) is shown (test E3). During the first cooling phase, the pile settled. It heaved as it was subjected to heating but did not retrieve the settlement due to the last cooling phase. Exactly the same trend could be observed in the second cycle. The cumulated settlement also could be detected in the temperature-settlement curve in Figure 10d. Larger displacements were encountered in the first cycle (especially by the first cooling). The magnitude of the settlement became smaller in the following cycle, but the trend remained similar. The slope of the first cooling phase was steeper than that of the second cooling phase. The latter was similar to the slope of the pile thermal expansion curve. The slopes of the two heating phases were similar and smaller than that of the cooling phases. The same observations could be made from the results of the other tests (E4, E5, E6, and E7).
11
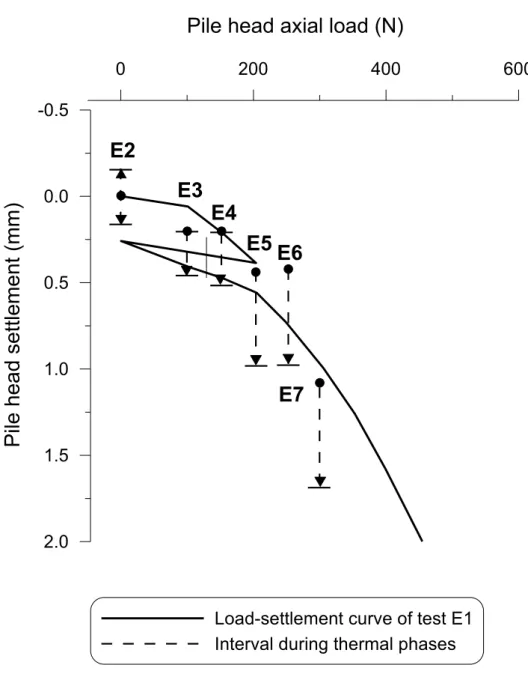
In Figure 11, the interval of the pile head displacement obtained during the thermal phase (shown in Figure 10) is plotted together with the load-settlement curve of test E1 as a reference curve. Initial points are shown by circles and pile head displacement variation during thermal loading is shown by arrows. Note that the initial points can be different from the load-settlement curve due to the variation of the load-settlement curve between various tests (see Figure 5). For the three tests at low axial load (E2, E3, and E4), the interval of pile head settlement remained smaller than 0.3 mm. For the tests at higher axial load (E5, E6, and E7), the intervals of pile head settlement obtained during thermal cycles were much larger (close to 0.6 mm).
In Figure 12a, soil pressure and pile temperature are plotted versus elapsed time for the thermal phase of test E2. For P2 and P3, the pressure decreased by the first cooling (this decrease was about 5 kPa at P2 and 1.5 kPa at P3). In the other positions (P4 to P9) which measure the soil pressure around the pile, pressure increased by cooling, decreased by heating and was slightly reduced during the period for which the temperature was maintained constant. In Figure 12b, soil pressures and pile temperature are plotted versus elapsed time in the thermal phase of the test E6. For P2 (situated below the pile toe), the results show that heating increased the soil pressure and the effect of the cooling phase was not significant. For the other sensors, the effect of the heating/cooling phases was not clear but soil pressure at all levels increased slightly while cooling and decreased with subsequent heating. The same observations can be noted from other tests with an axial load at the pile head during the thermal cycles.
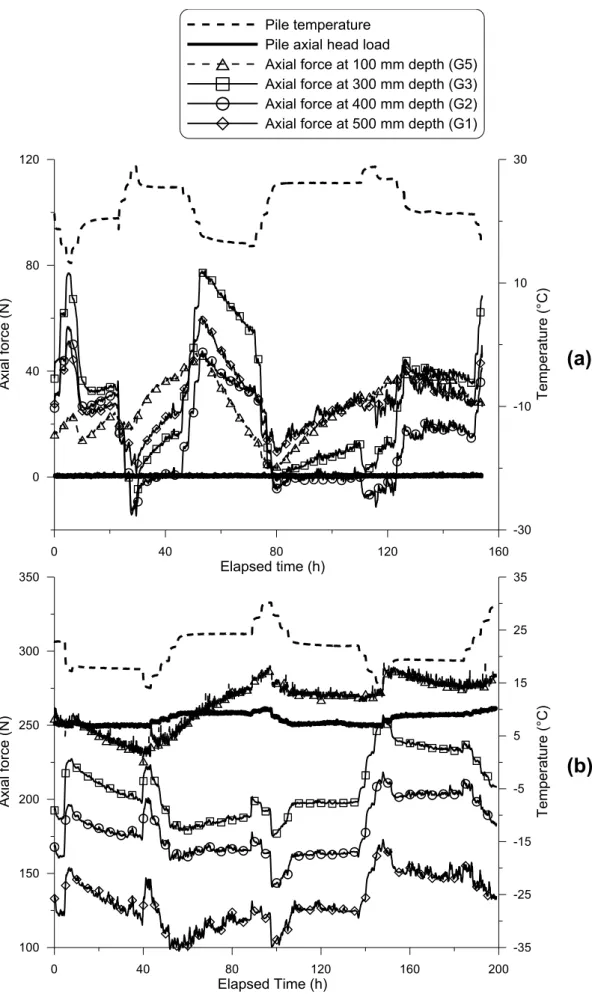
The axial forces and pile temperature measured along the pile are shown in Figure 13a for the test E2 during the thermal phase. It can be noted that cooling increased the axial force at all levels and the latter decreased during heating. In addition, significant changes in axial load were observed during some phases where the temperature was kept constant for a long time (35 h – 45 h; 55 h – 75 h; 85 h – 95 h). The results of test E6 are plotted in Figure 13b. By cooling the pile at t = 5 h the axial forces at all levels increased. Between t = 10 h and t = 40 h the temperature was not changed but the axial forces decreased. After this period, when the pile was cooled again, the axial forces increased again. During the subsequent heating, until t = 60 h, the axial forces decreased incrementally. The results of other tests were similar and two conclusions could be drawn: (i) cooling increases the axial force and heating decreases the axial force; (ii) in some cases, where the pile temperature was kept constant for a long
12
time, significant changes in axial forces can be observed (a strong time dependency can be seen).
In Figure 14 the axial force profiles along the pile are plotted for all the thermo-mechanical
tests. The profile mentioned as „mechanical‟ in the figures was obtained just before that the
thermal cycles started. There were four other profiles measured at the end of the cooling and heating processes. According to Figure 14a,b,c, under small axial loads (0 N to 150 N, tests E2, E3, and E4) by the end of the first cooling the axial forces along the pile were higher than that at the end of the mechanical phase. Subsequent heating decreased the axial forces. The latter were smaller than those measured initially on the mechanical profile. The same trend was visible during the second thermal cycle. In addition, for the tests E2 and E4, it seems that the pile lost all the additional axial force it has gained while cooling during subsequent heating. For the tests at higher axial loads (E5, E6, E7), the first cooling phase led to axial force increase along the pile, which was followed by a decrease during subsequent heating. Nevertheless, axial forces remained higher than that of the initial mechanical profile. In other words axial forces continued to increase permanently during the thermal cycles.
On the basis of axial forces calculated along the pile, the curves of mobilized friction versus pile head displacement during thermal phases were plotted. The results of tests E2 and E6 are represented in Figure 15. As can be seen in Figures 15a to 15d (test E2), the curves obtained in successive cooling and heating phases form a loop, which is compatible with the axial load profiles shown in Figure 15a. The same reversibility has been observed in Figure 10b, where the thermal displacements were plotted versus pile temperature. The thermo-elastic behaviour of the pile under nil axial load could also be seen in mobilized friction curves. Conversely, no visible regularity was noted in the results of test E6, where the axial head load was 250 N (Figure 15e to Figure 15h). Only at zone B (Figure 15f) a clear tendency could be observed: mobilised friction decreased by cooling and increased by heating. Obviously mobilized friction was sensitive to the pile temperature and changed with thermal cycles.
5. Discussion
In physical modelling, the soil specimen is usually prepared by sand pluviation. This method is applied in calibration chambers in order to achieve the best homogeneity [3, 7, 14]. In this paper, considering the dimensions of the frame (see Figure 1), which accommodates the totality of the system components, it was not possible to use a pluviation method to prepare
13
the soil sample. By the way, good repeatability of the load-settlement curves was found (Figure 5) confirming that controlling dry density by layer was good enough.
As mentioned in previous studies [10, 20], utilizing pressure transducers in sand could not always lead to satisfactory measurements. The tiny fragile structure of the total pressure transducers makes set up difficult while pouring sand on the existing layer to compact the next layer. That is why among the ten soil pressure transducers only six have operated throughout the test. In both the mechanical and thermo-mechanical phases, P2 and P3 were the most affected ones. Actually, considering the position of P2 and P3 (both 50 mm below the pile, one oriented vertically and the other oriented horizontally), one could conclude that a large part of the head load was transmitted to its toe. This statement could be confirmed via the axial force profiles of test E1 (Figure 7), where the axial force at pile toe represents more than 70 % of the axial head load.
In thermo-mechanical tests indicated by the curves of pile head displacement-pile temperature changes, only under nil axial load a perfectly thermo-elastic behaviour could be noted (Figure 10). Once a load began to be applied at the pile head irreversible settlement began to appear. That led to the accumulation of pile settlement. Continuous settlement is compatible with the trend observed in soil pressure measurements at P2 and P3 (50 mm below the pile toe) in
Figure 12. The vertical pressure increased at these points, especially during heating, which confirms the restrained longitudinal expansion of the pile at its toe. Other pressure transducers, installed close to the pile, showed an increase of pressure during heating and a decrease while cooling. The same governing pattern could be seen in the measurements of axial force along the pile under thermo-mechanical loading (the axial force increased by cooling and decreased by heating in Figure 15). As the temperature sensors show (Figure 9), the temperature of the soil around the pile changed with the pile temperature. The soil pressures measured at this region (measurement of all the pressure transducers except P2 and P3) are therefore dependant on the volume changes of the pile and the soil. As no homogeneous stress was applied on the top of the soil specimen, the soil is free to deform at its surface. Reduction of soil pressure could be explained by the fact that the soil column around the pile was free to expand at its surface. Considering the pile, its radial expansions while heating would not therefore be restrained by the expanding soil around. In that way stress in the pile were released.
14
To summarize, it seems that until 150 N of head load (0.3Qmax) the behaviour of the pile remains thermo-elastic. From 0 N up to 150 N of pile head load, a kind of thermo-elasticity could be observed in the axial force profiles. Considering the mechanical (initial) profile as the reference curve, the profiles obtained after thermal phases oscillate around this curve. As a consequence, the variation of axial forces induced by cooling was compensated by heating. The interval of the pile head displacement during thermal cycles at an axial load higher than 150 N was twice as high as that at a lower axial head load (Figure 11). However, under rather larger loads irreversible displacements appear and increase as the load becomes larger. The axial force profiles changes also become larger under more significant loads. The irreversible settlement at the pile head after thermal cycles can be then attributed to irreversible strain of soil surrounding the pile toe and of soil/pile interface. At higher axial force, the stress state at these zones is closer to the failure state. Thermal cycles modify the stress state at these zones and may induce plastic strain (due to grains rearrangements). As a consequence, irreversible settlement can be observed.
As mentioned above, the effects of temperature cycles on the mechanical behaviour of energy pile can be considered using two aspects: (i) thermal expansion of the pile; (ii) thermo-hydro-mechanical coupling in the surrounding soil. In the present study where dry sand was used, the thermo-hydro-mechanical coupling can be ignored assuming that temperature changes have no effect on the mechanical properties of sand. In this case, only the thermal expansion of the pile can be used to explain the observed phenomenon. From this idea, in the work of Yavari et al. [23], a numerical code was used to simulate the mechanical behaviour of energy pile. The thermal load was simulated by simply imposing to the pile a volumetric strain (calculated from the coefficient of thermal expansion of the pile material). The results show that using this mechanism, the behaviour of pile under thermo-mechanical loading can be correctly predicted. It should be noted that this validation was performed based on comparisons between numerical simulations and experimental results on a physical model similar to the present study ([11]) and on full-scale in situ experiments presented by Laloui et al. [12] and Bourne-Webb et al. [4]. This validation confirms that main mechanisms observed in small-scale physical models may be representative of observations in full-scale experiments.
15
The mechanical behaviour of energy pile was investigated through a physical model. At the first stage to simplify the problem, dry sand was used as the surrounding soil. Different thermo-mechanical tests were performed following the same procedure: loading the pile incrementally until a target value, keeping the load constant at this stage and applying two thermal cycles to the pile. Different transducers located in the soil and on the pile surface monitored the induced thermal effects. The following conclusions can be drawn:
- Under the conditions of the present work, more than 70 % of the axial head load was transferred to the pile toe.
- Soil pressures measured just below the pile toe were significantly influenced by the mechanical and thermal loadings. The changes of total pressures at other positions were negligible.
- Mobilized friction at the pile/soil interface gradually increased with the initial mechanical loading and was significantly modified during the subsequent thermal cycles.
- During thermal cycles under constant axial head load, for a head load lower than 30 % of the pile resistance, thermo-elastic behaviour of the pile could also be observed. For higher head load, significant cumulative settlement can be observed and axial force at pile toe gradually increases.
Acknowledgments
The authors would like to express their great appreciation to the French National Research Agency for funding the present study, which is part of the project PiNRJ “Geotechnical
aspects of foundation energy piles” – ANR 2010 JCJC 0908 01.
References
1. Afnor (1999) Essai statique de pieu sous effort axial. NF P 94 -150.
2. Amatya B, Soga K, Bourne-Webb P, Amis T, Laloui L (2012) Thermo-mechanical behaviour of energy piles. Géotechnique 62(6): 503–519
16
3. Baudouin G, (2010) Sols renforcés par inclusions rigides: modélisation physique en centrifugeuse de remblais et de dallage. PhD thesis, Université de Nantes, France.
4. Bourne-Webb P, Amatya B, Soga K, Amis T, Davidson C, Payne P (2009) Energy pile test at Lambeth College, London: geotechnical and thermodynamic aspects of pile response to heat cycles. Géotechnique 59(3): 237–248.
5. De Moel M, Bach PM, Bouazza A, Singh RM, Sun JLO (2010) Technological advances and applications of geothermal energy pile foundations and their feasibility in Australia. Renew Sust Enetg Rev 14(9): 2683-2696.
6. Diao N, Li Q, Fang Z (2004) Heat transfer in ground heat exchangers with groundwater advection. Int J Therm Sci 43: 1203–1211
7. Dupla JC, Canou J, Dinh AQ (2008) Caractérisation de mélanges de sables d'Hostun. rapport PN ASIRI n°2.08.3.07.
8. Esen H, Inalli M, Esen Y (2009) Temperature distributions in boreholes of a vertical
ground-coupled heat pump system. Renew Energ 34: 2672–2679.
9. Fioravante V (2002) On the shaft friction modelling of non displacement piles in sand. Soils and Foundations 42(2): pp. 23–33.
10. Jardine RJ, Zhu B, Foray P, Dalton CP (2009) Experimental arrangement for
investigation of soil stresses developed around a displacement pile. Soils and Foundations 49(5): 661-673.
11. Kalantidou A, Tang AM, Pereira JM, Hassen G (2012) Preliminary study on the mechanical behaviour of heat exchanger pile in physical model, Géotechnique 62, doi: 10.1680/geot.11.T.013
12. Laloui L, Moreni M, Vulliet L (2003) Comportement d‟un pieu bi-fonction, fondation et échangeur de chaleur. Can Geotech J 40(2) : 388 – 402.
13. Laloui L, Nuth M, Vulliet L (2006) Experimental and numerical investigation of the behaviour of a heat exchanger pile. Int J Numer Anal Met 30(8): 763 – 781.
17
14. Le Kouby A (2003) Comportement de micropieux modèles en chambre d‟étalonnage.
Application aux effets de groupe et aux sollicitations cycliques. PhD thesis, Ecole Nationale des Ponts et Chaussées, France.
15. Le Kouby A, Canou J, Dupla JC (2004) Behaviour of model piles subjected to cyclic axial loading, Cyclic Behaviour of Soils and Liquefaction Phenomena. Triantafyllidis (ed), Taylor & Francis Group, London: 159 – 166.
16. McCartney JS, Rosenberg J (2011) Impact of Heat Exchange on Side Shear in Thermo-Active Foundations. In: Proceedings of the Geo-Frontiers 2011 Conference, Jie H., Daniel E.,
Alzamora P.E. ASTM, Geotechnical Special Publications (GSP) 211: 488 – 498.
17. Parkin AK, Lunne T (1982) Boundary Effects in the Laboratory Calibration of a Cone Penetrometer for Sand. In: Proceedings of the 2nd European Symposium on Penetration Testing 2: 761–768.
18. Peron H, Knellwolf C, Laloui L (2011) A method for the geotechnical design of heat exchanger piles. In: Proceedings of the Geo-Frontiers 2011 Conference, Jie H., Daniel E., Alzamora, P.E. ASTM, Geotechnical Special Publications (GSP) 211: 470-479.
19. Sakr M, El Naggar MH (2003) Centrifuge Modelling of Tapered Piles in Sand. Geotech Test J 26(1).
20. Talesnick ML (2012) A different approach and result to the measurement of K0 of granular soils. Géotechnique 62, doi: 10.1680/geot.11.P.009
21. Wang B, Bouazza A, Haberfield C (2011) Preliminary observations from laboratory scale model geothermal pile subjected to thermo-mechanical loading. In: Proceedings of the Geo-Frontiers 2011 Conference, Jie H., Daniel E., Alzamora, P.E.. ASCE, pp 430-439.
22. Yari M, Javani N (2007) Performance assessment of a horizontal-coil geothermal heat pump. Int J Energ Res 31(3): 288–99.
23. Yavari N, Tang AM, Pereira JM, Hassen G (2013) A simple method for numerical
modelling of energy pile‟s mechanical behaviour. Géotechnique Letters, doi:
18
List of figure captions
Figure 1. Experimental setup ... 19 Figure 2. Sensors distribution ... 20 Figure 3. Test program ... 21 Figure 4. Results of test E1 : (a) Pile head axial load and the axial forces measured by different levels along the pile (b) Pile head displacement ... 22 Figure 5. Load-settlement curves obtained from various tests ... 23 Figure 6. Results of test E1: Total pressure changes versus elapsed time at different
locations ... 24 Figure 7. Results of test E1 : Axial force distribution along the pile ... 25 Figure 8. Results of test E1: Mobilized friction along the pile ... 26 Figure 9. Temperature changes in test E2 : (a) at the pile surface and inside the pile; (b) at the bottom of the container and 50 mm below the pile; (c) at 500-mm depth; (d) at 300-mm depth; (e) at 100-mm depth ... 27 Figure 10. Pile thermal settlement versus elapsed time during tests E2 (a), E3 (c), E4 (e), E5 (g), E6 (i), and E7 (k); Pile head settlement versus pile temperature in tests E2(b), E3 (d), E4 (f), E5 (h), E6(j), and E7 (l). ... 29 Figure 11. Interval of pile head settlement during thermal phase ... 30 Figure 12. Total pressure and temperature versus elapsed time during thermal phase : (a) test E2; (b) test E6 ... 31 Figure 13. Axial forces and temperature during thermal phase: (a) test E2; (b) test E6 ... 32 Figure 14. Axial force distribution along the pile (a) in test E2 (b) in test E3 (c) in test E4 (d) in test E5 (e) in test E6 (f) in test E7 ... 33 Figure 15. Mobilized friction along the pile during thermal phase: (a, b, c, d) test E2; (e, f, g, h) test E6 ... 34
19
20
21
22 Elapsed time (min)
2.5 2.0 1.5 1.0 0.5 0.0 -0.5 P ile h e a d s e tt le m e n t (m m )
(a)
(b)
0 200 400 600 0 100 200 300 400 500 A x ia l fo rc e ( N )Pile axial head load
Axial force at 100 mm depth (G5) Axial force at 300 mm depth (G3) Axial force at 400 mm depth (G2) Axial force at 500 mm depth (G1)
Figure 4. Results of test E1 : (a) Pile head axial load and the axial forces measured by different levels along the pile (b) Pile head displacement
23
0 100 200 300 400 500
Pile head axial load (N)
2.0 1.6 1.2 0.8 0.4 0.0
P
ile
h
e
a
d
s
e
tt
le
m
e
n
t
(m
m
)
test E1 test E3 test E4 test E5 test E6 test E724
0 200 400 600
Elapsed time (min) 10 30 50 T o ta l p re s s u re ( k P a ) P2 P3 P4 P7 P8 P9
25 0 100 200 300 400 Axial force (N) 600 400 200 0 D e p th ( m m )
A
B
C
D
26 0 0.4 0.8 1.2 1.6 2 -2 0 2 4 6 M o b ili z e d f ri c ti o n a t z o n e A ( k P a ) 0 0.4 0.8 1.2 1.6 2 -2 0 2 4 6 M o b ili z e d f ri c ti o n a t z o n e B ( k P a ) 0 0.4 0.8 1.2 1.6 2 -2 0 2 4 6 M o b ili z e d f ri c ti o n a t z o n e C ( k P a ) 0 0.4 0.8 1.2 1.6 2
Pile head displacement (mm)
-2 0 2 4 6 M o b ili z e d f ri c ti o n a t z o n e D ( k P a ) (a) (b) (c) (d)
27 5 10 15 20 25 30 35 T e m p re ra tu re ( °C )
(a)
S1 T1 T2 T3 18 20 22 24 26 T e m p re ra tu re ( °C )(b)
S2 S3 18 20 22 24 26 T e m p re ra tu re ( °C )(c)
S4 S5 S6 18 20 22 24 26 T e m p re ra tu re ( °C )(d)
S7 S8 S9 0 40 80 120 160 Elapsed time (h) 18 20 22 24 26 T e m p re ra tu re ( °C )(e)
S10 S11 S12Figure 9. Temperature changes in test E2 : (a) at the pile surface and inside the pile; (b) at the bottom of the container and 50 mm below the pile; (c) at 500-mm depth; (d) at 300-mm depth; (e) at 100-mm depth
28
-12 -8 -4 0 4 8 12
Pile temperature change (°C)
0.8 0.6 0.4 0.2 0.0 -0.2 P ile h e a d t h e rm a l s e tt le m e n t (m m ) Thermal cycles
Pile thermal expansion curve
0.8 0.6 0.4 0.2 0 -0.2 C u m u la ti v e s e tt le m e n t (m m ) 12 16 20 24 Pile temperature (°C) -12 -8 -4 0 4 8 12
Pile temperature change (°C)
0.8 0.6 0.4 0.2 0.0 -0.2 P ile h e a d t h e rm a l s e tt le m e n t (m m ) 1 0.8 0.6 0.4 0.2 0 C u m u la ti v e s e tt le m e n t (m m ) 10 15 20 25 30 Pile temperature (°C) -12 -8 -4 0 4 8 12
Pile temperature change (°C)
0.8 0.6 0.4 0.2 0.0 -0.2 P ile h e a d t h e rm a l s e tt le m e n t (m m ) 1 0.8 0.6 0.4 0.2 C u m u la ti v e s e tt le m e n t (m m ) 10 20 30 Pile temperature (°C) 0 40 80 120 160 200 Time (h) 0.8 0.6 0.4 0.2 0 -0.2 P ile h e a d t h e rm a l s e tt le m e n t (m m ) 0.8 0.6 0.4 0.2 0 -0.2 C u m u la ti v e s e tt le m e n t (m m ) 0 40 80 120 160 200 Time (h) 0.8 0.6 0.4 0.2 0 -0.2 P ile h e a d t h e rm a l s e tt le m e n t (m m ) 1 0.8 0.6 0.4 0.2 0 C u m u la ti v e s e tt le m e n t (m m ) 0 40 80 120 160 200 Time (h) 0.8 0.6 0.4 0.2 0 -0.2 P ile h e a d t h e rm a l s e tt le m e n t (m m ) 1 0.8 0.6 0.4 0.2 C u m u la ti v e s e tt le m e n t (m m ) (a) (c) (e) (b) (d) (f)
29
-12 -8 -4 0 4 8 12
Pile temperature change (°C)
0.8 0.6 0.4 0.2 0.0 -0.2 P ile h e a d t h e rm a l s e tt le m e n t (m m ) 1.2 1 0.8 0.6 0.4 C u m u la ti v e s e tt le m e n t (m m ) 10 20 30 Pile temperature (°C) -12 -8 -4 0 4 8 12
Pile temperature change (°C)
0.8 0.6 0.4 0.2 0.0 -0.2 P ile h e a d t h e rm a l s e tt le m e n t (m m ) 1.8 1.6 1.4 1.2 1 C u m u la ti v e s e tt le m e n t (m m ) 10 15 20 25 30 Pile temperature (°C) -12 -8 -4 0 4 8 12
Pile temperature change (°C)
0.8 0.6 0.4 0.2 0.0 -0.2 P ile h e a d t h e rm a l s e tt le m e n t (m m ) 1.2 1 0.8 0.6 0.4 C u m u la ti v e s e tt le m e n t (m m ) 10 15 20 25 30 Pile temperature (°C) 0 40 80 120 160 200 Time (h) 0.8 0.6 0.4 0.2 0 -0.2 P ile h e a d t h e rm a l s e tt le m e n t (m m ) 1.2 1 0.8 0.6 0.4 C u m u la ti v e s e tt le m e n t (m m ) 0 40 80 120 160 200 Time (h) 0.8 0.6 0.4 0.2 0 -0.2 P ile h e a d t h e rm a l s e tt le m e n t (m m ) 1.2 1 0.8 0.6 0.4 C u m u la ti v e s e tt le m e n t (m m ) 0 40 80 120 160 200 Time (h) 0.8 0.6 0.4 0.2 0 -0.2 P ile h e a d t h e rm a l s e tt le m e n t (m m ) 1.8 1.6 1.4 1.2 1 C u m u la ti v e s e tt le m e n t (m m ) (g) (i) (k) (h) (j) (l)
Figure 10. Pile thermal settlement versus elapsed time during tests E2 (a), E3 (c), E4 (e), E5 (g), E6 (i), and E7 (k); Pile head settlement versus pile temperature in tests E2(b), E3 (d), E4 (f), E5 (h), E6(j), and E7 (l).
30
0 200 400 600
Pile head axial load (N)
2.0 1.5 1.0 0.5 0.0 -0.5
P
ile
h
e
a
d
s
e
tt
le
m
e
n
t
(m
m
)
Load-settlement curve of test E1 Interval during thermal phases
E2
E3
E4
E5 E6
E7
31 0 40 80 120 160 200 Elapsed time (h) 0 10 20 30 T o ta l p re s s u re ( k P a ) -35 -25 -15 -5 5 15 25 35 45 T e m p e ra tu re (° C ) 0 40 80 120 160 Elapsed time (h) 0 10 20 30 T o ta l p re s s u re ( k P a ) Pile temperature P2 P3 P4 P7 P8 P9 -30 -10 10 30 T e m p e ra tu re ( °C ) (a) (b)
Figure 12. Total pressure and temperature versus elapsed time during thermal phase : (a) test E2; (b) test E6
32 0 40 80 120 160 Elapsed time (h) 0 40 80 120 A x ia l fo rc e ( N ) -30 -10 10 30 T e m p e ra tu re ( °C ) Pile temperature Pile axial head load
Axial force at 100 mm depth (G5) Axial force at 300 mm depth (G3) Axial force at 400 mm depth (G2) Axial force at 500 mm depth (G1)
0 40 80 120 160 200 Elapsed Time (h) 100 150 200 250 300 350 A x ia l fo rc e ( N ) -35 -25 -15 -5 5 15 25 35 T e m p e ra tu re (° C )
(a)
(b)
33 0 100 200 300 400 Axial force (N) 600 400 200 0 D e p th ( m m ) 0 100 200 300 400 Axial force (N) 600 400 200 0 D e p th ( m m ) mechanical end of first cooling end of first heating end of second cooling end of second heating
0 100 200 300 400 Axial force (N) 600 400 200 0 D e p th ( m m ) 0 100 200 300 400 Axial force (N) 600 400 200 0 D e p th ( m m ) 0 100 200 300 400 Axial force (N) 600 400 200 0 D e p th ( m m ) 0 100 200 300 400 Axial force (N) 600 400 200 0 D e p th ( m m ) (a) (b) (c) (d) (e) (f)
Figure 14. Axial force distribution along the pile (a) in test E2 (b) in test E3 (c) in test E4 (d) in test E5 (e) in test E6 (f) in test E7
34 -0.2 -0.1 0 0.1 0.2 -8 -6 -4 -2 0 M o b ili z e d f ri c ti o n a t z o n e A ( k P a ) test E2 -0.2 -0.1 0 0.1 0.2 -4 -2 0 2 4 M o b ili z e d f ri c ti o n a t z o n e B ( k P a ) -0.2 -0.1 0 0.1 0.2 -2 0 2 4 6 M o b ili z e d f ri c ti o n a t z o n e C ( k P a ) -0.2 -0.1 0 0.1 0.2
Pile head thermal displacement (mm)
-6 -4 -2 0 2 M o b ili z e d f ri c ti o n a t z o n e D ( k P a ) 0 0.1 0.2 0.3 0.4 0.5 -6 -4 -2 0 2 4 M o b ili z e d f ri c ti o n a t z o n e A ( k P a ) 0 0.1 0.2 0.3 0.4 0.5 0 2 4 6 8 10 M o b ili z e d f ri c ti o n a t z o n e B ( k P a ) test E6 0 0.1 0.2 0.3 0.4 0.5 3 4 5 6 7 M o b ili z e d f ri c ti o n a t z o n e C ( k P a ) 0 0.1 0.2 0.3 0.4 0.5
Pile head thermal displacement (mm)
5 6 7 8 9 10 M o b ili z e d f ri c ti o n a t z o n e D ( k P a ) (a) (b) (c) (d) (e) (f) (g) (h) Initial state Initial state Initial state Initial state Initial state Initial state Initial state Initial state
Figure 15. Mobilized friction along the pile during thermal phase: (a, b, c, d) test E2; (e, f, g, h) test E6