HAL Id: hal-00304767
https://hal.archives-ouvertes.fr/hal-00304767
Submitted on 1 Jan 2003HAL is a multi-disciplinary open access archive for the deposit and dissemination of sci-entific research documents, whether they are pub-lished or not. The documents may come from teaching and research institutions in France or abroad, or from public or private research centers.
L’archive ouverte pluridisciplinaire HAL, est destinée au dépôt et à la diffusion de documents scientifiques de niveau recherche, publiés ou non, émanant des établissements d’enseignement et de recherche français ou étrangers, des laboratoires publics ou privés.
in the British Isles. 1. Rainfall
W. G. Darling, J. C. Talbot
To cite this version:
W. G. Darling, J. C. Talbot. The O and H stable isotope composition of freshwaters in the British Isles. 1. Rainfall. Hydrology and Earth System Sciences Discussions, European Geosciences Union, 2003, 7 (2), pp.163-181. �hal-00304767�
The O & H stable isotopic composition of fresh waters in the
British Isles. 1. Rainfall
W.G. Darling and J.C. Talbot
British Geological Survey, Wallingford, OX10 8BB, UKEmail for corresponding author: [email protected]
Abstract
An understanding of the hydrological cycle in stable isotopic terms requires the characterisation of rainfall. This paper reviews existing and new data for the British Isles. Rainfall at the Wallingford (Oxfordshire) collection station was collected daily from November 1979 to October 1980. Large variations in isotopic content were noted, sometimes from day to day. Winter rainfall was similar to summer in amount,
and only slightly depleted isotopically. Amount and temperature correlations with δ18O were generally low, only the autumn and winter
temperature relationships being significant. A 20-year monthly dataset from 1982 to 2001 for Wallingford gives the following regression:
δ2H = 7.0δ18O + 1.2, a slope somewhat below the world meteoric line but consistent with the those from other long-term stations in NW
Europe. The data showed uncorrelated maxima and minima for each year, but rather more consistent amount-weighted averages. Although there is only a small difference in gradient between summer and winter rainfall values, when plotted against the month of the year there are
clear changes in the values of both isotopes, and the δ2H-δ18O relationship as demonstrated by the d-excess parameter. The isotope-amount
correlation is low but significant, with summer months appearing to be well-correlated when considered in terms of month of the year. On this
same seasonal basis temperature has a strong correlation throughout the year, giving a positive δ18O-temperature relationship of 0.25 ‰ per
°C change. The Wallingford monthly record is compared with data from Keyworth (Nottinghamshire) and the Valentia station of the GNIP (IAEA-WMO Global Network for Isotopes in Precipitation) in SW Ireland. While not large, differences between the stations are broadly attributable to the balance between maritime and continental influences. Over the period September 1981 to August 1982 the maximum number of monthly collection stations was operating across the British Isles. While a comparison of the sites serves mostly to illustrate the variability of British weather in space and time, there is clear isotopic evidence for the predominance of frontal rainfall in winter and convective rainfall in summer. The effect of altitude on isotopic content was measured within a high-relief stream catchment in Scotland. The
best correlations occurred during winter, when an average relationship of approximately –0.30 ‰ δ18O per 100 m increase in altitude was
observed. It is well established that rainfall isotopic composition changes in response to alterations in climate. However these changes are difficult to detect isotopically in the short term, even when the changes are indexed, e.g. in the form of the NAO (North Atlantic Oscillation). The brief duration of rainfall isotope records is a further hindrance; for the British Isles proxies such as tree-ring cellulose may have some value in extending the record back.
Keywords: stable isotopes, rainfall, British Isles
Introduction
Oxygen and hydrogen stable isotope ratios are the ultimate tracers of the physical processes affecting water because they are a property of the H2O molecule itself. The main aim of this study is to provide a background for understanding the hydrological cycle of the British Isles (Great Britain and Ireland) using the isotopic approach. Such a background first requires a knowledge of the isotopic composition of the input, i.e. rainfall, and this is the subject of the present paper (surface waters and groundwater are
considered in Darling et al., 2003). A wider justification is to contribute to the global mosaic of data which assists in the modelling of climatic processes (e.g. Jouzel et al., 1997). Although the weather of the British Isles is often considered to be dominated by southwest to westerly airflows, these actually occur for only about one-third of the average year (Mayes and Wheeler, 1997). While these airflows are responsible for the bulk of British Isles rainfall, there is plenty of scope for airflows from other directions to contribute to the total rainfall. This makes the British
164
Isles one of the more active areas in which to study the variation of rainfall stable isotopes.
While the monitoring of rainfall isotopes does not occur on a large scale in the British Isles, sufficient data have now been amassed to attempt a view of the systematics. This is largely based on data collected by the British Geological Survey (BGS) and the IAEA-WMO GNIP (International Atomic Energy Agency – World Meteorological Organisation Global Network for Isotopes in Precipitation) database, though results from published studies have also been included.
Isotopes in rainfall - background
Stable isotope data are conventionally expressed in ‰ (permil) with respect to Vienna Standard Mean Ocean Water (VSMOW) on the delta scale:
δ = [(Rsample/Rstandard)-1] x 10
3 (1)
where Rsample is the 18O/16O or 2H/1H ratio of the sample, and
Rstandard the corresponding ratio in VSMOW.
Stable O and H isotope ratios in rainfall are altered primarily by the physical processes of evaporation and condensation in the atmosphere (e.g. Gat, 1980). These result in fractionation, the preferential partitioning of isotopes into the liquid and vapour phases. Fractionations may be at equilibrium or kinetic depending on circumstances.
Most rainfall originates from evaporation of the ocean in tropical latitudes. Craig (1961) proposed that the relationship between O and H isotopes in rainfall over most of the Earth’s surface could be approximated by the equation
δ2H = 8δ18O + 10 (2)
The validity of this ‘world meteoric line’ (WML) is surprisingly widespread (Gat, 1980; Rozanski et al., 1993) given the great variations in climate world-wide. The commonly-observed slope of ~8, particularly for temperate zone stations, is less than that predicted by the action of an equilibrium fractionating process during evaporation from the ocean. This indicates that non-equilibrium (kinetic) fractionation and mixing are important factors in the development of the isotopic characteristics of atmospheric water vapour. This is not unexpected given the amount of atmospheric activity occurring during the creation of vapour masses. The intercept value of 10 is an average figure and is related to humidity conditions above the ocean-atmosphere boundary layer in the moisture source area. The value varies in theory from 0 at 100% humidity to about 35 for 50% humidity (Gonfiantini, 1986), with the value of 10
representing the global mean of approximately 85% humidity.
By contrast, the condensation of atmospheric vapour is much more of an equilibrium process. Condensation occurs when the temperature of a particular air mass falls below the dew point, where humidity reaches 100%, as a result of adiabatic expansion and/or heat radiation. At this point rain drops will form, enriched in the heavier isotopes 18O and 2H
while the remaining vapour will be depleted by an amount dictated by the mass balance of the rainfall–vapour system. Additional rainfall can only be obtained from the remaining vapour if the temperature falls further to regain 100% humidity. A similar split between enriched rain and depleted vapour results, but this time from a more depleted total composition. In reality this tends to be a continuous process of the Rayleigh distillation type (Clark and Fritz, 1997). The consequence is that any process resulting in temperature loss in a moist air mass leads to progressively more isotopically-depleted rainfall. This can take the form of the ‘continental effect’ (movement of the air mass over land) or the ‘altitude effect’ (passage of the air mass over upland barriers).
It is not possible to put an exact figure on the effect of condensation temperature change on rainfall isotope ratios because of the variables involved. Since surface temperature changes will at least to an extent reflect those in air masses, there tends to be a significant degree of correlation between rainfall and surface air temperature for isotope collection stations (Rozanski et al., 1993; GNIP 2002): this is commonly referred to as the ‘temperature effect’. In temperate Europe this is normally within the range of 0.2 to 0.45 ‰ δ18O per °C, the value generally increasing with
the temperature range (‘continentality’) of the site. As cloud cooling proceeds precipitation increases and δ values fall. Additionally, while raindrops tend towards some isotopic enrichment as they fall from cloud base to the ground owing to evaporation and exchange processes, the scope for such modification is most limited at high rates of rainfall. Both these factors contribute to the so-called ‘amount effect’ observed for most GNIP stations, whereby there is a significant correlation between rainfall amount and isotopic depletion.
While for the most part δ18O and δ2H are highly correlated
in rainfall, some variation can occur as a result of atmospheric conditions. A useful index of this is the deuterium excess or d-value (Dansgaard, 1964), defined as:
d = δ2H - 8δ18O (3)
The d-value is considered to be largely controlled by conditions of atmospheric humidity during the
vapour-forming process, as outlined above. For the WML in Eqn. (2), d has a value of 10‰. Many temperate-zone collection stations have d-values around this figure (IAEA/GNIP, 2002), though they can fluctuate seasonally mainly owing to changes in humidity in the moisture source area (Merlivat and Jouzel, 1979; Johnsen et al., 1989). Under certain conditions however, particularly evaporation of seawater into very low-humidity air, d-values exceeding 20‰ can be produced (e.g. Gat, 1980). Such conditions are however likely to be restricted to seas adjacent to arid zones such as in the eastern Mediterranean Sea.
Results and discussion
Samples of rainwater were collected in standard gauges. These consist of five-inch (127 mm) brass-rimmed funnels which direct rainfall into a 1-litre glass bottle below ground level. Although the surrounding bottle container is otherwise well-sealed, the possibility of evaporation from the bottle via the stem cannot be wholly ruled out, though the stem length (180 mm), internal diameter (7 mm) and the fact that the tip is submerged when > 25 mm of rainfall has accumulated all tend to minimise this. Bottles were emptied daily, weekly or monthly as appropriate. For monthly
sampling extra collections were made if rainfall amounts were high (above 75 mm) to prevent overflow. Samples were stored prior to analysis in glass bottles with rubber-lined metal caps. These were of 7 ml and 28 ml capacity for daily and monthly rainfall respectively, providing adequate sample for the separate analysis of 18O/16O and 2H/1H.
Analysis was carried out using standard preparation techniques followed by isotope ratio measurement on VG-Micromass 602E or Optima mass spectrometers. Analytical precisions are better than ± 0.2 ‰ for δ18O and ± 2 ‰ for
δ2H.
RAINFALL COLLECTION STATIONS
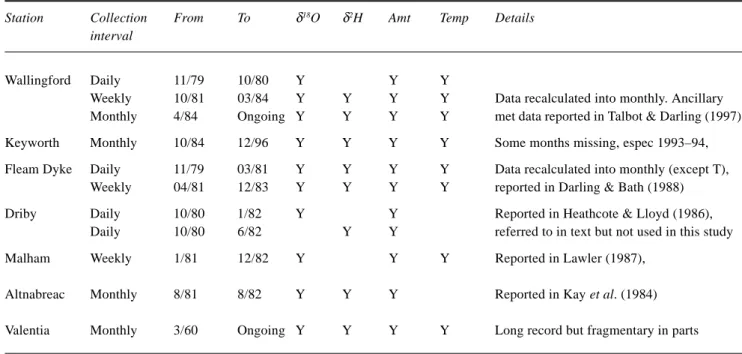
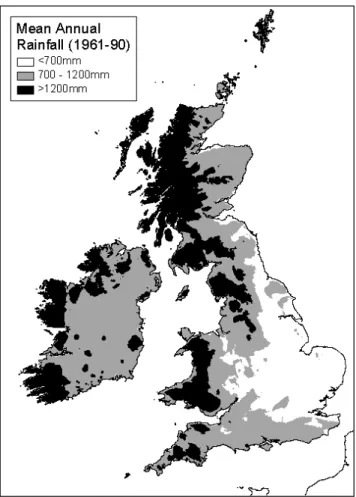
Data from three long-term collection stations are considered: the BGS stations in England at Wallingford, Oxfordshire (Appendixes A and B), and Keyworth, Nottinghamshire (Appendix C), and the IAEA-WMO station on Valentia Island, Co Kerry, Ireland (GNIP, 2002). Data from short-term stations set up for individual studies are available from Fleam Dyke, Cambridgeshire (Darling and Bath, 1988), Driby, Lincolnshire (Heathcote and Lloyd, 1986), Malham, N Yorkshire (Lawler, 1987) and Altnabreac, Caithness (Kay et al., 1984). The locations of all sites are shown in Fig. 1, while the collection periods are detailed in Table 1. ‘Rainfall’ denotes all forms of precipitation.
METEOROLOGICAL EFFECTS
Various datasets are considered: firstly from the Wallingford station, which in addition to a daily dataset from 1979 to 1980 has the most complete monthly dataset in the British Isles during the 1980s and 1990s; secondly the period 1985 to 1996, when long-term data are available for the Wallingford and Keyworth stations of BGS and the Valentia station of the IAEA; and thirdly September 1981 to August 1982, a ‘hydrological year’ when the maximum number of collection stations was operating across the British Isles. The Wallingford station, daily data 1979-1980
The daily dataset (Appendix A), which consists of δ18O
measurements only, on samples collected at 9 GMT, demonstrates the extremes which values can reach, even sometimes on a day-to-day basis (Fig. 2). For example, in both December 1979 and May 1980, values of –2 and –10‰ occur on successive days. It is known from studies worldwide that the isotopic composition of rainfall tends to change during the passage of weather systems (e.g. Gedzelman and Lawrence, 1982; Nativ and Mazor, 1987), and indeed examination of the synoptic charts for the dates Altnabreac Malham Keyworth Wallingford Fleam Dyke Valentia MAJOR STATION MINOR STATION Driby
Fig. 1. The location of the British Isles rainfall collection stations considered in this study.
166
Table 1. Details of rainfall stable isotopic data available for the British Isles collected over periods of a year or more. Station Collection From To δ18O δ2H Amt Temp Details
interval
Wallingford Daily 11/79 10/80 Y Y Y
Weekly 10/81 03/84 Y Y Y Y Data recalculated into monthly. Ancillary
Monthly 4/84 Ongoing Y Y Y Y met data reported in Talbot & Darling (1997)
Keyworth Monthly 10/84 12/96 Y Y Y Y Some months missing, espec 1993–94,
Fleam Dyke Daily 11/79 03/81 Y Y Y Y Data recalculated into monthly (except T),
Weekly 04/81 12/83 Y Y Y Y reported in Darling & Bath (1988)
Driby Daily 10/80 1/82 Y Y Reported in Heathcote & Lloyd (1986),
Daily 10/80 6/82 Y Y referred to in text but not used in this study
Malham Weekly 1/81 12/82 Y Y Y Reported in Lawler (1987),
Altnabreac Monthly 8/81 8/82 Y Y Y Reported in Kay et al. (1984)
Valentia Monthly 3/60 Ongoing Y Y Y Y Long record but fragmentary in parts
-16 -12 -8 -4 0 4 O N D J F M A M J J A S O Month δ 18 O ‰
Fig. 2. Plot of δ18O v. time for daily rainfall at the Wallingford site,
November 1979 to October 1980, showing the large variations that can occur on a day-to-day basis.
in question shows fronts moving over the south of England (Weather, 1979, 1980). Conceivably, the isotopically enriched low-volume samples came from the leading edge of the frontal rainfall, while the bulk of the event was sampled within the next 24-hour period. This magnitude of within-event variation has been observed elsewhere in NW Europe (Bleeker et al., 1966), and would imply that the large δ18O differences found were to an extent the product of the
relatively coarse sampling interval. The most depleted value, –14.9‰, was obtained for a moderate one-day rainfall event in December 1979. While November and February each also provided a day with values in the –13 to –14‰ range, in both cases this was following at least a day with moderate rainfall. Therefore, while neither of these depleted rainfall days is particularly large in amount, a basic rain-out effect may be responsible. The most enriched samples had positive
values, with a maximum of +1.4‰ in September 1980. The events giving rise to these tended to be low in amount, though not markedly so.
Some of the most intense rainfall events occur in the summer, probably as a result of discharge from cumulo-nimbus formations resulting from convection above a hot land surface. In such cases the amount effect might be expected to operate, but there is little evidence that this was the case during the summer of 1980.
The year under consideration seems to have been typical insofar as the weighted average of –6.8‰ was fairly close to the long-term average for the site (–7.25‰, see below). The average fell almost exactly halfway between the maximum and minimum values for the year.
Winter rainfall tends to be isotopically depleted compared to summer rainfall (e.g. Clark and Fritz, 1997). This was observed for the Wallingford site, although the difference was not profound: over the winter half-year September-February the weighted average δ18O was –7.02‰ , while
from March to August (summer half-year) it was –6.53‰. The summer rainfall of 322 mm is virtually identical to the winter of 319 mm.
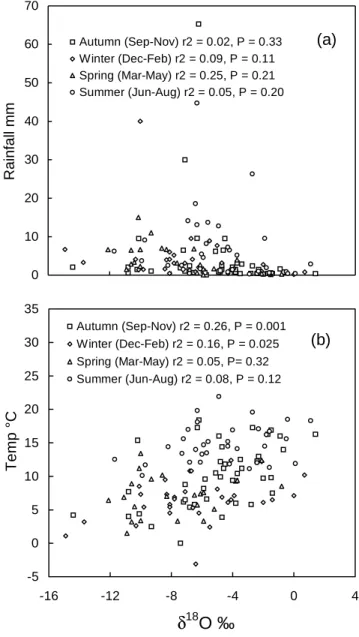
Plots of δ18O versus amount and mean daily temperature
(Figs. 3a, b) reveal low correlations even when divided into seasonal categories; only the autumn and winter temperatures give a significant relationship. To an extent the data call into question the usefulness of daily sampling; the effort involved could perhaps be devoted more beneficially to (for example) detailed studies of individual
0 10 20 30 40 50 60 70 -16 -12 -8 -4 0 4 δ18 O ‰ R ainfall mm Autumn (Sep-Nov) r2 = 0.02, P = 0.33 Winter (Dec-Feb) r2 = 0.09, P = 0.11 Spring (Mar-May) r2 = 0.25, P = 0.21 Summer (Jun-Aug) r2 = 0.05, P = 0.20 (a) -5 0 5 10 15 20 25 30 35 -16 -12 -8 -4 0 4
δ
18O ‰
T emp ° C Autumn (Sep-Nov) r2 = 0.26, P = 0.001 Winter (Dec-Feb) r2 = 0.16, P = 0.025 Spring (Mar-May) r2 = 0.05, P= 0.32 Summer (Jun-Aug) r2 = 0.08, P = 0.12 (b)Fig. 3. Plots of (a) rainfall amount and (b) mean daily air
temperature, both v. δ18O, for daily rainfall at the Wallingford site,
November 1979 to October 1980. Datapoints are divided according to season. Correlations range from significant to very poor.
large rainfall events to understand better the isotopic effects of cloud physics (see e.g. Jouzel, 1986). However, a role remains for daily sampling in elucidating synoptic-scale meteorological processes; this was an approach applied by Heathcote and Lloyd (1986) to a study of daily rainfall collected over a 21-month period at Driby, Lincolnshire. The Wallingford station, monthly data 1982–2001
The completeness of this dataset (Appendix B) allows the consideration of 20 years’ worth of data on monthly, seasonal and yearly bases.
Co-isotopic relationships A plot of δ18O v. δ2H
(‘delta-plot’) for all data shows a well correlated relationship with a slope of 7.0 and an intercept of 1.2 (Fig. 4). While these are somewhat different to the values assigned to the World Meteoric Line (Eqn. 2), Fig. 4 shows that there is a considerable overlap. In addition, the slope is compatible with the 6.8 and 7.2 slopes yielded respectively by the Valentia and Gröningen (Netherlands) long-term records (GNIP, 2002), so is clearly not anomalous for NW Europe. Monthly values extend over a maximum range of about 15‰ for δ18O and 100 ‰ for δ2H, though compositions are mostly
confined to the ranges of –3 to –11‰ δ18O and –15 to
–75‰ δ2H. Yearly maxima and minima vary quite
considerably (Fig. 5) and are devoid of any correlation; yearly δ18O/δ2H slopes range from 6.0 to 7.9. Yearly
weighted averages of δ18O and δ2H are more constant,
though still vary by more than 2‰ in δ18O and almost 14‰
in δ2H (see Fig. 5 and below).
There is some difference between winter half-year
-120 -100 -80 -60 -40 -20 0 20 -15 -10 -5 0 5 δ18 O ‰ δ 2H ‰ WALLINGFORD 1982-2001 δ2H = 7.00 δ18O + 0.98 r2 = 0.95
Fig. 4. Delta-plot of monthly rainfall from the Wallingford site, 1982–2001, shown in relation to the World Meteoric Line of Craig (1961). The actual regression through the datapoints is shown as a bold line. -16 -12 -8 -4 0 4 82 83 84 85 86 87 88 89 90 91 92 93 94 95 96 97 98 99 00 01 Year δ 18O ‰
Fig. 5. Yearly upper and lower limits of monthly δ18O value at the
Wallingford site over the period 1982–2001. Also shown is the yearly weighted mean value.
168
(September–February) and summer half-year (March– August) gradients (Fig. 6) with slopes of 7.4 ± 0.3 in winter and 6.9 ± 0.3 in summer, presumably reflecting the greater opportunity for secondary evaporation of rainfall during the summer.
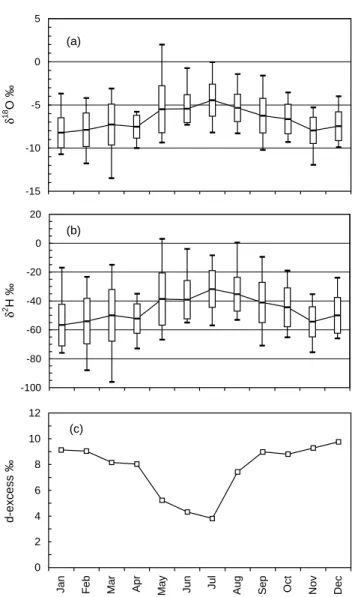
On an averaged month-of-the-year (‘seasonal’) basis there is a much more structured variation. Isotopic values are relatively enriched in summer and depleted in winter (Fig. 7a, b). Despite the good correlation between δ18O and δ2H
apparent from Fig. 4, the relationship between the two does change seasonally as Fig. 6 implies. This is demonstrated by plotting the average deuterium excess (d) value for each month (Fig. 7c). These dip in summer, which is a consequence of higher relative humidity related to sea
surface temperatures in the moisture source areas (e.g. Merlivat and Jouzel, 1979; Gat, 1980; Johnsen et al., 1989). Further scrutiny of Fig. 7(a) and (b) reveals that there can be a very large variation in the isotopic composition of monthly rainfall, doubtless due to the many factors influencing weather in the vicinity of the British Isles. In this context it is perhaps surprising that the least variation is seen for April, proverbially a time of showers and the month least likely to have long continued runs of similar weather (Perry, 1976).
Isotope-amount relationships There is a low though significant (P < 0.001) correlation between rainfall amount and isotope value at the monthly scale (Fig. 8a), giving rise Fig. 6. Delta-plots showing the difference in relationship between
winter and summer half-year monthly rainfall values at the Wallingford site over the period 1982-2001.
-15 -10 -5 0 5 δ 18 O ‰ (a) 0 2 4 6 8 10 12
Jan Feb Mar Apr May Jun Jul Aug Sep Oct Nov Dec
d -excess ‰ (c) -100 -80 -60 -40 -20 0 20 δ 2H ‰ (b)
Fig. 7. Plots of (a) weighted mean values of δ18O, (b) δ2H and (c)
deuterium excess for each month of the year at the Wallingford site over the period 1982-2001, showing seasonal changes in both individual and relative isotopic contents. Plots (a) and (b) also show the standard deviation and total range of the data for each month. -100 -80 -60 -40 -20 0 20 -15 -10 -5 0 5 δ18 O ‰ δ 2 H ‰ Sep-Feb δ2 H = 7.44 δ18O + 4.96 r2 = 0.95 -100 -80 -60 -40 -20 0 20 -15 -10 -5 0 5 δ18 O ‰ δ 2 H ‰ Mar-Aug δ2 H = 6.91 δ18O - 0.29 r2 = 0.94
at best to a crude version of the amount effect: the tendency for higher amounts of rainfall to be more isotopically depleted. This is not altogether surprising, since the amount effect is based at least partly on rainfall intensity rather than overall amount (Dansgaard, 1964). Therefore a month with one or two intense rainfall episodes may have a more depleted composition than a month with several lesser events, even though the latter may have more total rainfall. On the seasonal basis there is overall even worse agreement (Fig. 8b), but the months May-October are very well correlated in the typical amount-effect mode. This fits the concept of summer rainfall being derived much more from convective events than winter rainfall, which is usually frontal in origin.
Yearly weighted means average –7.25‰ δ18O (standard
deviation of 0.57) and –50.0‰ δ2H (sd 3.7) for a rainfall of
597 mm (sd 95). Averaged weighted mean values of δ18O
are –7.81‰ δ18O and –53.2‰ δ2H in the winter half-year,
and –6.63‰ δ18O and –46.2 ‰ δ2H in the summer
half-year.
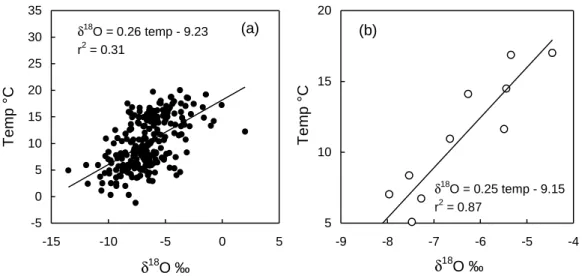
Isotope-temperature relationships On the monthly scale Fig. 9a shows there is a somewhat better δ18O-temperature
(δ18O-T) than δ18O-amount relationship (Fig. 8a), but the
correlation remains relatively low due, as with the amount relationship above, to the mixing of different types of rainfall. On the seasonal basis such effects are greatly mitigated, resulting in the strong correlation of Fig. 9b. This
Fig. 8. Rainfall amount plotted v. δ18O value for (a) all monthly data and (b) the seasonal relationship for the Wallingford site over the period
1982–2001 The monthly data in (a) show a low but significant correlation, while in (b) a strong amount effect is seen for the months May to October.
Fig. 9. Mean temperature plotted v. δ18O value for (a) all monthly data and (b) the seasonal relationship for the Wallingford site over the
period 1982δ2001. Correlation improves markedly in (b) but the δ8O-T relationship barely changes.
20 30 40 50 60 70 -9 -8 -7 -6 -5 -4 δ18 O ‰ R ainfall m m Nov-Apr May-Oct (b) 0 25 50 75 100 125 150 -15 -10 -5 0 5 δ18 O ‰ R ainfall m m r2 = 0.25 (a) -5 0 5 10 15 20 25 30 35 -15 -10 -5 0 5 δ18 O ‰ T emp ° C δ18 O = 0.26 temp - 9.23 r2 = 0.31 (a) 5 10 15 20 -9 -8 -7 -6 -5 -4 δ18 O ‰ T emp ° C (b) δ18 O = 0.25 temp - 9.15 r2 = 0.87
170
is equivalent to a δ18O-T of 0.25‰ per °C, only slightly
higher than the values from neighbouring GNIP stations at Valentia and Gröningen and not significantly different from them at the 95% confidence level.
Event-only data The temperature data in Appendix B used above are based on the IAEA-WMO GNIP criterion of averaged daily mean temperatures for each month. A smaller dataset (1982–1992) also exists in which meteorological data were obtained from the Wallingford site automatic weather station to quantify conditions during rainfall events only. This dataset also includes wind direction and velocity. These data are summarised in average monthly form in Table 2.
A seasonal δ18O-T relationship of 0.32‰ per °C is
obtained from the data in Table 2. This can be compared with the seasonal temperature relationship based on the conventional mean monthly temperature over the same 11-year period of 0.22‰ per °C. Thus the use of mean monthly temperature may be leading to an underestimate of δ18O-T
value, but with only twelve datapoints per correlation the uncertainties are relatively large and the slopes could be identical within error.
While it is apparent from records that most rainfall in the British Isles originates from a westerly quarter (Fig. 10 shows a rainfall distribution map), 2-metre wind data suggest that the direction from which Wallingford rainfall arrives has a strong southerly bias (Fig. 11). However, northern hemisphere wind direction at ground level may be rotated anticlockwise by 10° or more relative to winds hundreds of metres above because of Ekman spiral effects (e.g. Gedzelman, 1985), so the Wallingford results are probably
not anomalous. Only February shows a deviation from the S-SW segment; the easterly component present is consistent with this month being on average the coldest of the year (Table 2). There is almost no correlation between δ18O and
wind direction because the latter is so variable. There is however a significant (P < 0.001) negative correlation between wind velocity and δ18O on a seasonal basis (Fig.
Table 2. Temperature, wind direction and wind velocity recorded
during rainfall events only. Averages of monthly weighted data 1982-92.
Month δ18O δ2H Rainfall Temp Wind Wind
dir. vel. ‰ ‰ mm °C deg. m s–1 Jan -8.14 -56.6 49.7 5.5 187 3.43 Feb -8.62 -60.6 36.3 4.8 161 3.15 Mar -7.49 -51.6 44.4 6.6 195 3.20 Apr -7.46 -51.3 43.0 7.3 195 2.23 May -4.87 -34.7 46.4 11.3 206 1.83 Jun -5.93 -42.6 52.6 12.4 183 1.78 Jul -4.69 -34.3 39.3 15.5 181 1.65 Aug -5.03 -34.4 46.6 15.7 187 1.92 Sep -6.22 -41.2 45.5 13.2 180 2.17 Oct -6.65 -44.0 57.6 11.5 193 2.65 Nov -7.61 -52.7 57.9 8.4 196 2.76 Dec -7.29 -49.1 59.4 7.5 186 3.06
Fig10 Map showing the annual average distribution of rainfall in the British Isles over the period 1961–1990. Based on UK Meteorological Office and Met Eireann data.
90 135 180 225 270
Jan Feb Mar Apr May Jun Jul Aug Sep Oct Nov Dec
W
ind direction degree
s
SE S SW
Fig.11. Weighted mean wind direction at 2 m above ground during rainfall events by month of the year for the Wallingford site over the period 1982–1992.
12). Although winds tend to be stronger in the winter when temperatures are lower, the strength of the correlation is somewhat surprising.
Long-term stations, 1985-1996
Co-isotopic relationships The period under consideration is defined by the availability of data from the Keyworth station (Appendix C). As varying amounts of data are
missing from the Keyworth and Valentia (GNIP, 2002) records, comparisons with yearly and monthly parameters as carried out for Wallingford (see previous section) cannot be performed in an equivalently rigorous way. However there are sufficient data to enable some broader conclusions to be drawn.
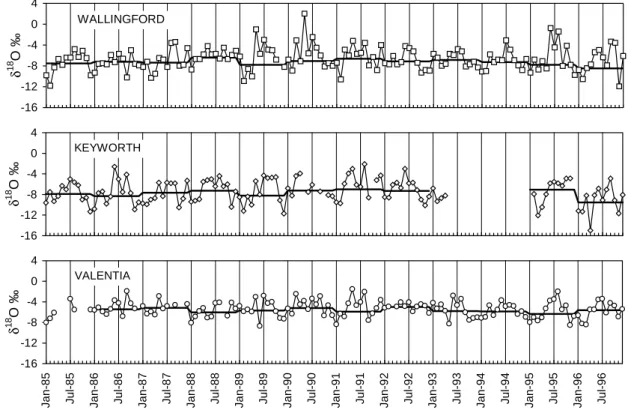
Figure 13 shows monthly δ18O values for each station from
1985 to 1996. The similar standard deviations for Wallingford and Keyworth (2.20 and 2.31‰ respectively) are consistent with their similar continentality (Tout, 1976). The much lower value of 1.54‰ for Valentia reflects its maritime situation. While overall amplitude is greatest for Wallingford, this is caused by a very few extreme months (including May 1990 which is missing from the Keyworth record), and therefore there is probably little difference between the two sites in the long term.
In general, the isotopic values from all three stations mimic each other with time, though Fig. 13 shows a few occasions when either of the English stations show an exaggerated version of the other stations’ responses or is out of step altogether. Examples include April 1989, May 1990, June 1995 and November 1996 for Wallingford, and June 1986, December 1989, March 1995 and April 1996 for Keyworth. As might be expected from the more local nature of rain events during the spring and summer, most of the anomalies are from such periods.
r2 = 0.78 1.0 1.5 2.0 2.5 3.0 3.5 4.0 -10 -8 -6 -4 δ18 O ‰ W ind velocity m s -1
Fig. 12. Plot of weighted mean wind velocity v. δ18O during rainfall
events by month of the year for the Wallingford site over the period 1982-1992, showing the relatively strong correlation.
Fig. 13. The monthly δ18O record from the Wallingford, Keyworth and Valentia collection stations over the period 1985 to 1996. The yearly
weighted mean composition is shown by the bold lines. Valentia data from GNIP (2002).
-16 -12 -8 -4 0 4
Jan-85 Jul-85 Jan-86 Jul-86 Jan-87 Jul-87 Jan-88 Jul-88 Jan-89 Jul-89 Jan-90 Jul-90 Jan-91 Jul-91 Jan-92 Jul-92 Jan-93 Jul-93 Jan-94 Jul-94 Jan-95 Jul-95 Jan-96 Jul-96
δ 18 O ‰ -16 -12 -8 -4 0 4
Jan-85 Jul-85 Jan-86 Jul-86 Jan-87 Jul-87 Jan-88 Jul-88 Jan-89 Jul-89 Jan-90 Jul-90 Jan-91 Jul-91 Jan-92 Jul-92 Jan-93 Jul-93 Jan-94 Jul-94 Jan-95 Jul-95 Jan-96 Jul-96
δ 18 O ‰ KEYWORTH -16 -12 -8 -4 0 4
Jan-85 Jul-85 Jan-86 Jul-86 Jan-87 Jul-87 Jan-88 Jul-88 Jan-89 Jul-89 Jan-90 Jul-90 Jan-91 Jul-91 Jan-92 Jul-92 Jan-93 Jul-93 Jan-94 Jul-94 Jan-95 Jul-95 Jan-96 Jul-96
δ
18
O ‰
VALENTIA WALLINGFORD
172
Yearly-weighted averages are also shown in Fig. 13. Like the longer term Wallingford data considered earlier, these are very much damped in comparison with the monthly inputs. The differences between the long-term weighted averages (Wallingford –7.25‰ , Keyworth –7.78‰ and Valentia –5.70‰) can be attributed to a combination of topographic and ‘continental’ rain-out effects acting on moisture from predominantly west-to-southwesterly moisture sources. The distance Valentia-Wallingford (about 650 km) is almost identical to Valentia-Keyworth, so the extra 0.5‰ depletion between Wallingford and Keyworth can plausibly be related to the greater distance travelled over land by the average moisture-bearing air mass reaching Keyworth, perhaps aided by topographic effects such as passage over the uplands of Wales. Since the distribution of wind directions is similar for both areas (data from the RAF Benson and Glenfield stations of the Meteorological Office), the depletion does not appear to be due to, for example, a greater proportion of wind off the North Sea at Keyworth. Delta-plots are shown for the three stations in Fig. 14. To make these more directly comparable, only years where all the stations have at least nine months’ worth of data are included. This rules out 1985, 1993 and 1994. It is again apparent that Valentia has a restricted range relative to the other stations. Wallingford exhibits a certain amount of tailing at the enriched end of its range; these are from summer months mainly with very low rainfall. By contrast, Keyworth has one very negative value, April 1996, for which there is no obvious cause from examination of the amount and temperature data in Appendix 3; however, unseasonable snow on the 12th or thundery rain on the 20th (Met. Office, 1996) are possible contenders.
Isotope-amount relationships Winter and summer half-year weighted means for the period 1986–92 and 1995–96 are given in Table 3. They show that the differences are greatest at Wallingford and decline to almost zero at Valentia. This tends to confirm the influence of continental effects at Wallingford relative to Valentia suggested by the overall range data in Fig. 13. Table 3 also shows that the differences between Wallingford and Keyworth become greater during the summer, which may reflect the changing of temperature gradients from roughly N–S in winter to E–W in summer. (They also provide an opportunity to attribute the seasonal balance of groundwater recharge — see Part 2 of this study) Weighted d-excess values (Table 3) are closer to the conventional temperate zone figure of 10‰ than values based on the raw data (Fig. 13). The lower summer values at each station are consistent with the longer Wallingford record, and indeed the general pattern of northern hemisphere rainfall (Jouzel et al., 1997).
Fig. 14. Delta-plots for the Wallingford, Keyworth and Valentia collection stations over the period 1989–1992 and 1995–1996, showing the equations for the regression lines. Valentia data from GNIP (2002). δ2 H = 6.94δ18O + 0.48 r2 = 0.95 -120 -100 -80 -60 -40 -20 0 20 -16 -12 -8 -4 0 4
δ
18O ‰
δ
2H ‰
WALLINGFORD δ2 H = 7.27δ18O + 4.19 r2 = 0.96 -120 -100 -80 -60 -40 -20 0 20 -16 -12 -8 -4 0 4δ
18O ‰
δ
2H ‰
KEYWORTH δ2 H = 7.42δ18O + 5.85 r2 = 0.92 -120 -100 -80 -60 -40 -20 0 20 -16 -12 -8 -4 0 4δ
18O ‰
δ
2H ‰
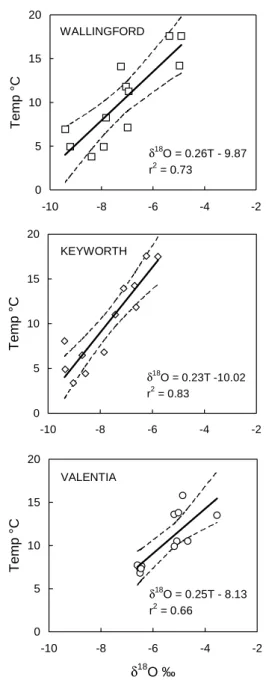
VALENTIAIsotope-temperature relationships Temperature comparisons are restricted to the six years 1989–92 and 1985–86. Averaged monthly δ18O and temperature for these
stations are plotted in Fig. 15. While correlations are not as strong as for the 1982–2001 Wallingford record, they give similar δ18O-T relationships, indeed identical within the
confidence limits shown and therefore making it impossible to test the proposition based on the GNIP database that coastal stations have a lower δ18O-T relationship than those
further inland (Rozanski et al., 1993).
Long-term and short-term stations, September 1981 to August 1982
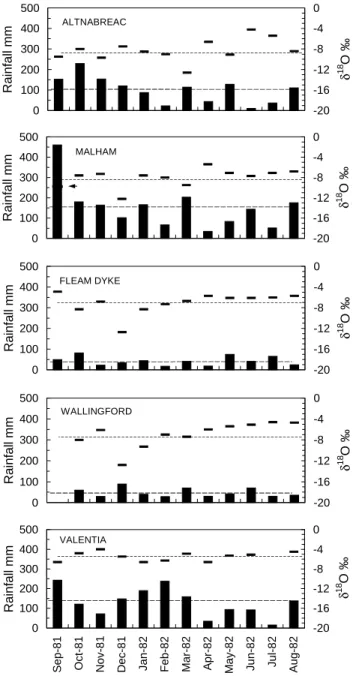
Over this 12-month period, the maximum number of stations (5) was operating across the British Isles (Table 1, Fig 1). Fig. 16 shows monthly weighted δ18O values and rainfall
amounts for these stations. The Valentia δ18O record varies
least, presumably because of the station’s ‘upwind’ location in the dominant southwesterly airflow. Despite this origin of most British rainfall, δ18O for the other stations sometimes
vary in the opposite sense to Valentia. A basic interpretation aided by the Monthly Weather Logs (Weather 1981, 1982) follows:
Autumn In September, significantly above-average rainfalls at Valentia and Malham were reflected in unusually large isotopic depletions for the time of year. In October all the stations gave isotopic results around their 12-month average, although unlike the other stations Altnabreac had above-average rainfall. In November, rainfall was near-above-average for all stations and resulted in a near-average isotopic content, except for Altnabreac which was somewhat depleted.
Winter In December the three English stations showed very marked isotopic depletion, while Valentia and Altnabreac had near-average compositions. Rainfall amounts offer little evidence for this pattern, but the Weather
Table 3. Values of δ18O, δ2H and d-excess for winter (Sep-Feb), summer (Mar-Aug) and whole year for the Wallingford, Keyworth and Valentia stations over the years 1986-92 and 1995-96
WALLINGFORD KEYWORTH VALENTIA
δ18O δ2H d δ18O δ2H d δ18O δ2H d
Winter -8.00 -54.6 9.4 -8.44 -57.0 10.5 -5.32 -33.4 9.2
Summer -6.41 -45.1 6.1 -7.00 -47.5 8.5 -5.28 -34.3 7.9
Year -7.30 -50.5 7.9 -7.76 -52.5 9.58 -5.30 -33.8 8.6
Fig. 15. Plots of seasonal monthly temperature v. δ18O for the
Wallingford, Keyworth and Valentia collection stations over the period 1989 to 1992 and 1995 to 1996, showing the isotope-temperature relationship and 95% confidence limits. Valentia data from GNIP (2002). δ18 O = 0.26T - 9.87 r2 = 0.73 0 5 10 15 20 -10 -8 -6 -4 -2 d18O ‰ T emp ° C WALLINGFORD δ18 O = 0.23T -10.02 r2 = 0.83 0 5 10 15 20 -10 -8 -6 -4 -2 d18O ‰ T emp ° C KEYWORTH δ18 O = 0.25T - 8.13 r2 = 0.66 0 5 10 15 20 -10 -8 -6 -4 -2 δ18 O ‰ T emp ° C VALENTIA
174
Log summarises this month as ‘exceptionally cold and snowy’. Snow, although not usually very significant in amount compared to winter rainfall in the British Isles, generally has a depleted isotopic composition because, being frozen, there is much less scope for exchange or re-equilibration during its descent from the cloud base (e.g. Gat, 1980). Much of the snow was associated with a depression moving across northern France which resulted
in heavy falls in central and southern Britain. This may be why Valentia and Altnabreac were little affected. In January the stations gave isotopic results mostly close to the year’s average, although rainfall was somewhat higher than average at Valentia and Malham. In February rainfall was low at all stations except Valentia, where it was very high. Despite this, all stations gave near-average isotopic compositions.
Spring In March, Valentia and the English stations continued to be isotopically similar to February, but Altnabreac showed a large depletion apparently unrelated to rainfall amount. This may have been due to the snowfall in the northern part of Britain around 10 March. In April, low rainfalls for all stations were accompanied by above-average isotopic values. This presumably resulted from the general warming of the atmosphere after the winter period. In May the isotopic situation for April continued similarly for Valentia, Wallingford and Fleam Dyke, despite higher rainfall. However, depletions were noted for the more northerly stations. This may have been due to a fairly deep depression moving east near northern Scotland early in the month.
Summer In June rainfall amounts were near average except for Altnabreac, which was well below normal. This situation was mirrored by stable isotope contents, which remained similar to May’s except for Altnabreac which was significantly enriched. In July all stations gave isotopic results similar to June’s, even though rainfall amounts dropped considerably at Malham and Valentia. Finally, in August the English stations and Valentia remained isotopically similar, despite sizeable increases in amount for Valentia and Malham but not Wallingford and Fleam Dyke. Altnabreac became significantly depleted in spite of a relatively modest increase in rainfall. This may be attributable to the northerly-tracking depressions typical the British summer.
Whatever the causes for differences between the stations, it is clear that in this maritime area there are many factors which may influence the isotopic composition of rainfall. On a monthly basis it is difficult to ascribe measured compositions to individual weather events, at least without knowing much more about the pattern of rainfall during the month. Only four months provide isotope-amount correlations significant above the 85% level: Fig. 17 shows that December and January are positive while May and June are negative. The gradient reversals may be explained in the following terms: in winter, moisture-bearing fronts deliver rainfall influenced by the continental effect, whereby frontal rainfall becomes progressively depleted in 18O as it
Fig. 16. Monthly rainfall amount and δ18O data from collection
stations in the British Isles for the year September 1981 to August 1982. Average values for the year are also shown. (Altnabreac data from Kay et al., 1984; Fleam Dyke data from Darling and Bath, 1988; Malham data from Lawler, 1987; Valentia data from GNIP, 2002). 0 100 200 300 400 500 R ainfall mm -20 -16 -12 -8 -4 0 δ 18 O ‰ ALTNABREAC 0 100 200 300 400 500 R ainfall mm -20 -16 -12 -8 -4 0 δ 18 O ‰ MALHAM 0 100 200 300 400 500 R ainfall mm -20 -16 -12 -8 -4 0 δ 18 O ‰ FLEAM DYKE 0 100 200 300 400 500 R ainfall mm -20 -16 -12 -8 -4 0 δ 18 O ‰ WALLINGFORD 0 100 200 300 400 500
Sep-81 Oct-81 Nov-81 Dec-81 Jan-82 Feb-82 Mar-82 Apr-82 May-82 Jun-82 Jul-82 Aug-82
R ainfall mm -20 -16 -12 -8 -4 0 δ 18 O ‰ VALENTIA
passes across the British Isles while decreasing in amount. In summer, by contrast, rainfall events of significant volume appear to be much more convective in origin, and the amount effect comes into play, with the higher-volume events being associated with more 18O depletion. In the intervening
seasons both types of rainfall occur, thus reducing the amount of correlation.
These regional data broadly resemble the long-term monthly data from Wallingford (Fig. 8b), particularly the strong negative correlation (i.e. amount effect) for the summer months. Since temperature data are not available for one of the stations (Altnabreac), comparisons with temperature would be of more limited value and have therefore not been attempted.
ALTITUDE EFFECTS
As mentioned earlier, the so-called altitude effect is really a local form of the temperature effect and results from the cooling of air masses as they gain altitude. The measured effects of altitude on the stable isotopic composition of rainfall range from –0.15 to –5‰ for δ18O per 100 m increase
in elevation, with δ2H varying in proportion (limited
worldwide data summarised in Clark and Fritz, 1997). For the lowland areas of Britain the effect is likely to be of little significance, and can be ruled out as a significant factor in differences between the collection stations considered above. In upland areas, however, relief of hundreds of metres implies significant isotopic effects on rainfall. To obtain an indication of the scale of the effect in the British Isles, a small study was carried out in the southern Highlands of Scotland.
The Monachyle surface water catchment near Balquhidder, Tayside (Johnson and Whitehead, 1993) provided sampling points at different elevations within the approximately 6 km2 catchment. Bulked monthly samples
were collected from raingauges over a 300 m altitude range on four occasions over the course of approximately one year. The data are plotted against altitude in Fig. 18. The regression lines show altitude effects of about –0.3‰ δ18O
per 100 m in winter, and −0.2 ‰ δ18O per 100 m in summer.
While the regressions are not particularly well correlated, probably due in part to the varying positions of collectors around the catchments, these gradients are consistent with those observed elsewhere in the world (an average of –0.28‰ for δ18O according to Poage and Chamberlin, 2001).
The poorer correlations in summer may reflect the dominance of local shower events compared to the large-scale frontal movements characteristic of winter.
CLIMATIC EFFECTS
It is clear from the foregoing discussion that the isotopic content of rainfall over the British Isles is strongly influenced -0.8 -0.6 -0.4 -0.2 0.0 0.2 0.4 0.6 0.8 1.0
Aug-81 Sep-81 Oct-81 Nov-81 Dec-81 Jan-82 Feb-82 Mar-82 Apr-82 May-82 Jun-82 Jul-82 Aug-82 Sep-82
C
orrelation coefft.
r
2
Fig. 17. Correlation coefficients for monthly rainfall amount v. δ18O
data from Fig. 16. Because of the small number of sites significance values are generally low, with only four months lying above the 85% confidence level. Positive relationships in winter result from orographic effects, whereas negative ones in summer are due to amount effects.
Fig. 18. Altitude effects on the δ18O content of rainfall in the Monachyle catchment, Tayside, Scotland. Regional rainfall events in winter
produce stronger correlations than the more local events of summer.
300 400 500 600 700 -10 -9 -8 -7 -6 -5 δ18 O ‰ A ltitude ma sl 300 400 500 600 700 -10 -9 -8 -7 -6 -5 δ18 O ‰ 300 400 500 600 700 -10 -9 -8 -7 -6 -5 δ18 O ‰ 300 400 500 600 700 -10 -9 -8 -7 -6 -5 δ18 O‰ NOV '83 0.34/100m r2 = 0.56 JUN '84 0.20/100m r2 = 0.20 JUL '84 0.16/100m r2 = 0.13 NOV '84 0.24/100m r2 = 0.59
176
by short-term changes in factors such as temperature, rainfall amount and air-mass movement — in other words, weather. However, these factors also affect the isotopic balance of rainfall over the longer term in the form of climate. For instance, various studies of palaeo-groundwaters (‘palaeowaters’) show that rainfall in the British Isles during the late Pleistocene must have had more negative isotopic compositions than at the present day (e.g. Darling et al., 1997). The connection between stable isotope values and temperature is only relative and may to some extent have changed over time in the British Isles. However, the absolute temperatures derived from the temperature-dependent solubility relationships of the noble gases (neon, argon, krypton and xenon) dissolved in the palaeowaters confirm a significant drop in recharge temperature for the palaeowaters. While ice-core evidence indicates that some temperature changes during the late-Pleistocene to early-Holocene climatic transition may have been rapid, they would still probably have occurred over tens of years rather than a shorter timescale (e.g. Taylor et al., 1993). This might have been difficult enough to detect isotopically at the time; the prevalence of more stable conditions at the present day means that the chances of detecting secular isotopic changes on a decadal scale must now be even smaller.
For example, global warming in the late 20th century is estimated to be occurring on a scale of around 0.15°C per decade in the northern hemisphere (UEA-CRU, 2002). Given the current δ18O-T effect of around 0.25‰ per °C for
δ18O for Wallingford, this would translate into a raising of
‘baseline’ δ18O by only 0.04‰ per decade, a figure rather
beyond the ability of present-day analytical precision to detect convincingly even before the diverse meteorological influences are considered. Even if the magnitude of the δ18
O-T effect were doubled to reflect the probable magnitude of the secular relationship (Rozanski, 1993) the resulting increase would still be obscured. Further, this assumes that the temperature of the ocean source area remains constant; if this also rises any baseline increase will tend towards zero, because isotopic depletion depends on the difference in temperature between moisture source area and sampling site. While detection of baseline changes can therefore be ruled out in the shorter term, one probable consequence of global warming, the increased frequency of climatic extremes (Houghton et al., 1996), might be expected to have an influence on the isotopic composition of rainfall. Fig. 5 shows that the annual weighted mean for δ18O at Wallingford
has become less stable since the mid-1990s, this period including the record-breaking rainfall in the autumn-winter of 2000–01. As with other indicators, prolonged observation will be required to determine whether such fluctuations are other than random variation.
It is possible to seek more specific climatic links, for example with the North Atlantic Oscillation (NAO). This is a phenomenon indexed on the difference in barometric pressure between Iceland and the Azores or Gibraltar, and is considered to have an important effect on European climate (e.g. Rodwell et al., 1999). Positive values of the index are associated with strong winter westerlies in northern Europe, bringing heavy rainfall and relatively warm conditions. By contrast, negative values result in more continental conditions with lower rainfall and colder temperatures. While plots of annual NAO index against δ18O
show overall a poor correlation both for Wallingford and Valentia (Fig. 19), for Wallingford the negative NAO values are well correlated. This correlation is consistent insofar as δ18O would be expected to be more depleted in colder
conditions, i.e. those with the most negative NAO index. Also, an inland station such as Wallingford might be expected to demonstrate the effect more than a station on the edge of the Atlantic like Valentia. Against this
-1.5 -1.0 -0.5 0.0 0.5 1.0 1.5 -9 -8 -7 -6 -5 -4 d18O Y
early NAO inde
x WALLINGFORD -1.5 -1.0 -0.5 0.0 0.5 1.0 1.5 -9 -8 -7 -6 -5 -4 δ18 O ‰ Y
early NAO inde
x
VALENTIA
Fig. 19. Plots of annual NAO (North Atlantic Oscillation) index v.
amount-weighted δ18O for rainfall at Wallingford and Valentia for
the period 1982–1999. NAO indices are the Iceland-Gibraltar values of UEA-CRU (2002).
interpretation is the fact that δ18O values can be often be
just as depleted during positive NAO years.
On a more local scale but of potential relevance to this study, Kiely et al. (1998) carried out a study of the Valentia rainfall record that revealed a 10% increase in mean annual precipitation commencing around 1975, with most of the increase occurring in the months of March and to a lesser extent October. This might have been detectable in the isotopic record, but unfortunately while they extend back to 1960, the data for the years around 1975 are particularly fragmentary. This rules out any statistically meaningful comparison of March weighted averages for the years before and after 1975.
PROXY RECORDS
Directly measured rainfall stable isotope records go back a maximum of only 40 years or so (e.g. for Valentia). It is well established that, under favourable circumstances, ice cores can preserve the isotopic content of rainfall at high latitudes and/or altitudes, but neither of these conditions applies in the British Isles at the present day. The δ18O values
of biogenic carbonate and opal in lake sediments have been used to infer the isotopic content of rainfall (e.g. von Grafenstein et al., 1996; Shemesh and Peteet, 1998), but aside from any difficult-to-quantify variables such as the effect of evaporation during drier spells, these techniques are usually difficult to apply at the annual scale. For example, von Grafenstein et al. (ibid) claim a three- to five-year resolution.
The δ18O content of tree-ring cellulose has also been used
to infer rainfall isotope values. Although this technique is also affected by environmental variables, it does permit resolution at the annual scale. Robertson et al. (2001) found a good correlation between the δ18O values of cellulose from
oak trees in East Anglia and rainfall of the previous December/January period at Wallingford. Further work on this topic seems the most likely way in which the rainfall record for the British Isles could be extended back on an annual basis, if only for selected months of the year.
Conclusions
Rainfall isotope data for the British Isles have been investigated over a variety of timescales and locations.
One year’s worth of daily data from the Wallingford collection station exhibits sometimes large fluctuations in isotope values over short periods of time. Correlations with meteorological parameters are not straightforward to interpret, but a detailed study at the synoptic scale (beyond the scope of the present paper) remains to be made.
Long-term monthly data, particularly from Wallingford but also from Keyworth and Valentia, reveal the relative stability of bulk δ18O and δ2H on a year-to-year basis and
also seasonal relationships with temperature and rainfall amount at the individual stations. While Valentia shows the least monthly isotopic variation, generally isotopic changes for each station mimic those of the other two. However the monthly record of a larger number of collection stations covering a greater area of the British Isles demonstrates rather more changeability but also shows a more consistent seasonal change in amount effect.
Measurements within the Monachyle upland catchment in the southern Highlands of Scotland show altitude effects varying seasonally but remaining well within the range encountered elsewhere in the world.
Short-to-medium term climatic effects on rainfall isotopes are difficult to demonstrate convincingly. There is no prospect of detecting the underlying influence of global warming over the comparatively short datasets available, but more rapid changes such as the North Atlantic Oscillation may under certain conditions be reflected in isotopic compositions.
An indication of the isotopic composition of winter rainfall prior to direct measurement may be inferred from the isotopic content of tree ring cellulose.
Acknowledgments
Past and present BGS colleagues Adrian Bath and Jerry Hodgson are thanked for the collection of the Keyworth rainfall samples, as are Sam Boyle and Dick Johnson of the NERC Institute of Hydrology (now CEH Wallingford) for the Fleam Dyke and Monachyle samples, respectively. The authors are also indebted to Martin Lees of CEH Wallingford for providing meteorological data for the Wallingford collection station, and to Jerry Hodgson for the Keyworth collection station. Adrian Bath is thanked for his comments on an earlier draft of the manuscript. Tim Atkinson and Kazimierz Rozanski provided insightful reviews. This paper is published with the permission of the Executive Director, British Geological Survey (NERC).
References
Bleeker, W., Dansgaard, W. and Lablans, W.N., 1966. Some remarks on simultaneous measurements of particulate contaminants including radioactivity and isotopic composition of precipitation. Tellus 18, 773–785.
Clark, I.D. and Fritz, P., 1997. Environmental Isotopes in
Hydrogeology. Lewis Publishers, Boca Raton, USA. 328pp.
Craig, H., 1961. Isotopic variations in meteoric waters. Science
178
Dansgaard, W., 1964. Stable isotopes in precipitation. Tellus 16, 436–468.
Darling, W.G. and Bath, A.H., 1988. A stable isotope study of recharge processes in the English Chalk. J. Hydrol., 101, 31– 46.
Darling, W.G., Edmunds, W.M. and Smedley, P.L., 1997. The isotopic composition of palaeowaters in the British Isles. Appl.
Geochem., 12, 813–829.
Darling, W.G., Bath, A.H. and Talbot, J.C., 2003. The O and H Stable Isotopic Content of Fresh Waters in The British Isles. 2. Ground and surface waters. Hydrol. Earth Syst. Sci., 7, 183– 195.
Gat, J., 1980. The isotopes of hydrogen and oxygen in precipitation. In: Handbook of Environmental Isotope
Geochemistry: Vol 1, The Terrestrial Environment, A. P. Fritz
and J.C. Fontes (Eds.), Elsevier, Amsterdam, The Netherlands. 21–48.
GNIP (IAEA-WMO Global Network for Isotopes in Precipitation), 2002. Website http://isohis.iaea.org
Gedzelman, S.D., 1985. Atmospheric circulation systems. Chapter 1 in Handbook of Applied Meteorology, D.D. Houghton (Ed.), Wiley, New York, 3–61.
Gedzelman, S.D. and Lawrence, J.R., 1982. The isotopic composition of cyclonic precipitation. J. Appl. Meteorol., 21, 1385–1404.
Gonfiantini, R., 1986. Environmental isotopes in lake studies. In
Handbook of Environmental Isotope Geochemistry: Vol 2, The Terrestrial Environment, B. P. Fritz and J.C. Fontes (Eds.),
Elsevier, Amsterdam, The Netherlands. 113–168.
Heathcote, J.A. and Lloyd, J.W., 1986. Factors affecting the isotopic composition of daily rainfall at Driby, Lincolnshire. J.
Climatol., 6, 97–106.
Houghton, J.T., Meira Filho, L.G., Callander, B.A., Harris, N., Kattenberg, A. and Maskell, K. (Eds.), 1996. Climate Change
1995: The Science of Climate Change. Cambridge University
Press, UK. 572pp.
Johnsen, S.J., Dansgaard, W. and White, J.W.C., 1989. The origin of arctic precipitation under present and glacial conditions. Tellus
41B, 452–468.
Johnson, R.C. and Whitehead, P.G., 1993. An introduction to the research in the Balquhidder experimental catchments. J. Hydrol.,
145, 231–238.
Jouzel, J., 1986. Isotopes in cloud physics: multiphase and multistage condensation processes. In: Handbook of
Environmental Isotope Geochemistry: Vol 2, The Terrestrial Environment, B. P Fritz and J C Fontes (Eds.), Elsevier,
Amsterdam, The Netherlands. 61–112.
Jouzel, J., Froehlich, K. and Schotterer, U., 1997. Deuterium and oxygen-18 in present-day precipitation: data and modelling.
Hydrol. Sci. J., 42, 747–763.
Kay, R.L.F., Andrews, J.N., Bath, A.H. and Ivanovich, M., 1984. Groundwater flow profile and residence times in crystalline rocks at Altnabreac, Caithness, UK. In: Isotope Hydrology 1983, IAEA, Vienna, Austria. 231–248.
Kiely, G., Albertson, J.D. and Parlange, M.B., 1998. Recent trends in diurnal variation of precipitation at Valentia on the west coast of Ireland. J. Hydrol., 207, 270–279.
Lawler, H.A., 1987. Sampling for isotopic responses in surface waters. Earth Surf. Process. Landforms 12, 551–559. Mayes, J. and Wheeler, D., 1997. The anatomy of regional climates
in the British Isles. In: Regional Climates of the British Isles. D. Wheeler and J. Mayes (Eds.). Routledge, London, UK. 9–44. Merlivat, L. and Jouzel, J., 1979. Global climatic interpretation
of the deuterium–oxygen-18 relationship for precipitation. J.
Geophysi. Res., 84, 5029–5033.
Met. Office, 1996. Daily weather summaries for April 1996. Nativ, R. and Mazor, E., 1987. Rain events in an arid environment
– their distribution and ionic and isotopic composition patterns: Makhtesh Ramon basin, Israel. J. Hydrol., 89, 205–237. Perry, A.H., 1976. Synoptic climatology. Chapter 2 in The Climate
of the British Isles, T.J. Chandler and S. Gregory (Eds.).
Longman, London, UK. 9–38.
Poage, M.A. and Chamberlin, C.P., 2001. Empirical relationships between elevation and the stable isotope composition of precipitation and surface waters: considerations for studies of paleoelevation change. Amer. J. Science 301, 1–15.
Robertson, I., Waterhouse, J.S., Barker, A.C., Carter, A.H.C. and Switsur, V.R., 2001. Oxygen isotope ratios of oak in east England: implications for reconstructing the isotopic composition of precipitation. Earth Planet. Sci. Lett., 191, 21– 31.
Rodwell, M.J., Rowell, D.P. and Folland, C.K., 1999. Oceanic forcing of the wintertime North Atlantic Oscillation and European climate. Nature 398, 320–323.
Rozanski, K., Araguas-Araguas, L. and Gonfiantini, R., 1993. Isotopic patterns in modern global precipitation. In: Climate
Change in Continental Isotopic Records, Geophysical
Monograph 78, American Geophysical Union, 1–36.
Shemesh, A. and Peteet, D., 1998. Oxygen isotopes in fresh water biogenic opal: Northeastern U.S. Alleröd-Younger Dryas temperature shift. Geophys. Res. Lett., 25, 1935–38.
Talbot, J.C. and Darling, W.G., 1997. Compilation of stable isotope data for rainfall in the United Kingdom. British Geological
Survey Report WD/97/20, Keyworth, UK.
Taylor, K.C., Lamorey, G.W., Doyle, G.A., Alley, R.B., Grootes, P.M., Mayewski, P.A., White, J.W.C. and Barlow, L.K., 1993. The ‘flickering switch’ of late Pleistocene climate change.
Nature 361, 432–436.
Tout, D., 1976. Temperature. Chapter 5 in The Climate of the
British Isles, T.J. Chandler and S. Gregory (Eds.). Longman,
London, UK. 96–128.
UEA-CRU (University of East Anglia Climatic Research Unit), 2002. Website: http://www.cru.uea.ac.uk
von Grafenstein, U., Erlenkeuser, H., Müller, J., Trimborn, P. and Alefs, J., 1996. A 200 year mid-European air temperature record preserved in lake sediments: An extension of the δ18O
p-air temperature relation into the past. Geochim. Cosmochim. Acta
60, 4025–4036.
Weather (Magazine of the Royal Meteorological Society), 1979.
Weather Logs from Vol 34.
Weather (Magazine of the Royal Meteorological Society), 1980,
1982. Weather Logs from Vols 35
Weather (Magazine of the Royal Meteorological Society), 1981,
1982. Weather Logs from Vols 36
Weather (Magazine of the Royal Meteorological Society), 1982.
Appendix A
Daily data from the BGS Wallingford station, Nov 1979-Oct 1980
Day δ18O Amount Temp Day δ18O Amount Temp
‰ mm °C ‰ mm °C 02-Nov-79 -7.2 6.5 6.2 09-Jun-80 -2.4 0.4 12.0 03-Nov-79 -4.8 0.9 9.9 10-Jun-80 -1.9 9.5 14.5 04-Nov-79 -2.3 1.5 13.0 13-Jun-80 -6.3 13.1 18.1 05-Nov-79 -3.8 0.8 9.3 15-Jun-80 -0.5 0.9 15.6 06-Nov-79 -5.1 6.2 10.5 16-Jun-80 -5.9 4.6 14.7 07-Nov-79 -3.7 3.2 10.4 17-Jun-80 -7.3 2.5 13.4 09-Nov-79 -6.5 0.7 5.8 20-Jun-80 0.1 0.4 11.9 11-Nov-79 -6.8 2.4 5.4 22-Jun-80 -9.7 9.1 11.7 13-Nov-79 -7.4 1.9 0.0 23-Jun-80 -9.9 3.7 10.1 14-Nov-79 -9.3 1.1 2.5 24-Jun-80 -11.7 6.2 12.5 15-Nov-79 -14.4 2.1 4.2 25-Jun-80 -6.8 0.5 12.1 16-Nov-79 -10.8 0.6 4.0 26-Jun-80 -8.2 2.5 14.4 17-Nov-79 -4.7 1.5 3.9 30-Jun-80 -4.2 6.5 11.8 26-Nov-79 -4.6 6.5 11.2 02-Jul-80 -7.2 1.5 15.6 29-Nov-79 -2.0 0.3 9.7 03-Jul-80 -3.7 5.2 14.1 05-Dec-79 -4.1 1.5 12.4 06-Jul-80 -6.1 1.6 12.1 07-Dec-79 -2.1 1.0 12.2 07-Jul-80 -6.4 18.6 14.0 08-Dec-79 -6.8 1.3 10.8 08-Jul-80 -6.0 5.5 13.3 09-Dec-79 -6.7 9.5 10.8 13-Jul-80 -5.7 8.2 13.5 10-Dec-79 -5.0 7.7 8.1 15-Jul-80 -2.9 0.3 11.1 12-Dec-79 -2.0 2.8 6.1 17-Jul-80 -1.6 0.3 11.3 13-Dec-79 -10.0 40.0 7.3 18-Jul-80 -4.3 7.2 15.2 14-Dec-79 -7.1 3.1 7.7 19-Jul-80 -4.0 1.4 16.9 15-Dec-79 -4.3 0.5 6.1 20-Jul-80 -4.3 0.8 14.5 16-Dec-79 -1.4 0.6 6.5 25-Jul-80 -2.7 26.3 19.6 17-Dec-79 -9.8 1.5 5.4 26-Jul-80 -0.4 0.4 18.5 26-Dec-79 -14.9 6.7 1.1 29-Jul-80 -4.9 12.8 21.9 02-Jan-80 -6.4 0.9 -3.1 10-Aug-80 -2.3 1.0 17.1 03-Jan-80 -5.5 8.9 2.4 11-Aug-80 -1.8 1.9 16.2 21-Jan-80 -8.1 4.1 4.5 12-Aug-80 -5.6 13.7 15.2 22-Jan-80 -6.6 4.1 5.3 13-Aug-80 1.1 2.9 18.3 30-Jan-80 -8.3 4.0 7.3 14-Aug-80 -6.3 44.7 19.8 01-Feb-80 -13.7 3.3 3.2 16-Aug-80 -1.6 0.6 16.7 02-Feb-80 -6.2 2.0 4.5 29-Aug-80 -6.9 14.1 17.0 03-Feb-80 -7.8 5.2 6.9 04-Sep-80 -4.7 2.6 14.4 04-Feb-80 -8.1 6.0 5.8 05-Sep-80 -10.2 1.5 15.4 06-Feb-80 -7.8 3.1 6.6 07-Sep-80 1.4 0.4 16.3 07-Feb-80 -4.1 1.4 6.5 09-Sep-80 -3.5 0.4 12.5 09-Feb-80 0.7 0.8 10.2 16-Sep-80 -2.7 2.4 17.3 10-Feb-80 0.0 0.2 7.1 19-Sep-80 -1.5 0.2 16.9 14-Feb-80 -3.9 1.7 7.1 20-Sep-80 -6.2 65.3 18.4 15-Feb-80 -8.4 1.6 9.5 21-Sep-80 -6.3 9.6 17.3 16-Feb-80 -8.1 0.5 5.4 22-Sep-80 -4.9 0.9 16.0 21-Feb-80 -4.7 3.2 6.9 23-Sep-80 -1.7 0.5 16.3 22-Feb-80 -10.1 1.4 8.5 27-Sep-80 -0.7 0.8 14.0 24-Feb-80 -10.3 4.1 2.6 03-Oct-80 -1.5 0.6 9.8 05-Mar-80 -7.6 3.2 3.3 05-Oct-80 -1.4 0.5 7.5 06-Mar-80 -8.3 6.7 7.0 06-Oct-80 -4.5 9.5 11.8 07-Mar-80 -10.4 3.4 5.5 07-Oct-80 -4.0 2.1 9.4 09-Mar-80 -5.2 1.7 5.1 10-Oct-80 -10.1 9.5 4.4 12-Mar-80 -6.5 6.8 7.2 11-Oct-80 -7.1 1.1 8.8 14-Mar-80 -10.9 1.5 1.5 13-Oct-80 -2.8 0.5 5.8 16-Mar-80 -5.9 1.6 3.3 16-Oct-80 -7.1 30.0 6.5 17-Mar-80 -10.6 6.5 3.2 17-Oct-80 -10.8 2.1 7.7 18-Mar-80 -10.0 6.6 3.4 18-Oct-80 -5.7 0.1 6.6 24-Mar-80 -6.1 2.7 7.4 19-Oct-80 -3.8 1.5 6.0 26-Mar-80 -12.1 6.6 6.4 21-Oct-80 -3.4 2.9 11.2 27-Mar-80 -0.8 0.3 8.5 22-Oct-80 -4.8 1.2 12.2 28-Mar-80 -3.7 4.0 9.4 24-Oct-80 -5.9 1.1 8.2 29-Mar-80 -5.9 0.1 7.6 25-Oct-80 -5.8 0.7 9.6 01-Apr-80 -9.3 11.0 9.6 26-Oct-80 -2.4 0.5 12.3 26-Apr-80 -6.3 0.6 5.7 28-Oct-80 -0.9 1.6 16.0 29-Apr-80 -11.1 1.6 6.9 19-May-80 -10.0 2.3 13.4 27-May-80 -2.1 0.5 12.4 28-May-80 -10.1 15.0 11.2 30-May-80 -10.6 2.9 8.9 31-May-80 -8.6 7.0 10.2
180
Appendix B
Monthly data from the BGS Wallingford station, 1982-2001
Month δ18O δ2H Amount Temp Month δ18O δ2H Amount Temp Month δ18O δ2H Amount Temp
mm °C mm °C mm °C
Jan-82 -9.3 -64 40 2.5 Sep-88 -4.5 -31 28 13.7 May-95 -8.5 -58 51 11.8 Feb-82 -7.0 -45 29 5.0 Oct-88 -6.7 -48 48 10.9 Jun-95 -0.7 -4 15 14.2 Mar-82 -7.4 -47 70 6.1 Nov-88 -5.9 -41 26 4.5 Jul-95 -4.5 -25 34 18.7 Apr-82 -6.0 -39 31 8.4 Dec-88 -5.1 -33 8 7.2 Aug-95 -1.4 0 3 19.2 May-82 -5.4 -35 42 11.6 Jan-89 -6.2 -42 25 5.9 Sep-95 -8.0 -56 117 13.6 Jun-82 -5.1 -44 70 16.0 Feb-89 -10.9 -76 60 5.9 Oct-95 -4.1 -20 28 13.5 Jul-82 -4.6 -33 31 16.7 Mar-89 -8.6 -64 54 8.1 Nov-95 -7.8 -51 85 7.6 Aug-82 -4.7 -29 36 16.4 Apr-89 -10.0 -73 68 7.0 Dec-95 -9.8 -64 80 2.5 Sep-82 -5.8 -36 46 14.9 May-89 -1.0 -9 5 13.3 Jan-96 -8.8 -59 34 4.8 Oct-82 -7.9 -53 100 10.3 Jun-89 -5.7 -42 28 14.5 Feb-96 -10.5 -70 50 2.5 Nov-82 -8.5 -59 86 8.3 Jul-89 -3.0 -24 12 18.5 Mar-96 -8.5 -61 28 4.8 Dec-82 -8.3 -59 66 4.5 Aug-89 -4.9 -31 37 17.0 Apr-96 -7.7 -51 35 8.7 Jan-83 -6.4 -43 26 6.9 Sep-89 -5.0 -33 34 15.5 May-96 -5.4 -38 18 9.1 Feb-83 -8.5 -61 25 2.0 Oct-89 -6.8 -39 42 12.0 Jun-96 -5.0 -38 33 14.4 Mar-83 -6.0 -43 34 6.3 Nov-89 33 6.0 Jul-96 -6.4 -47 22 16.7 Apr-83 -9.2 -66 89 7.2 Dec-89 -8.2 -57 139 5.4 Aug-96 -7.9 -49 41 16.8 May-83 -7.3 -54 79 10.7 Jan-90 -6.8 -45 82 6.8 Sep-96 -3.3 -25 7 13.5 Jun-83 -6.4 -41 21 14.6 Feb-90 -8.9 -66 111 7.9 Oct-96 -3.6 -22 27 11.7 Jul-83 -3.7 -25 24 20.0 Mar-90 -3.1 -15 19 8.3 Nov-96 -11.9 -76 110 5.9 Aug-83 -5.4 -38 22 17.5 Apr-90 -7.1 -48 23 7.7 Dec-96 -6.1 -39 19 2.9 Sep-83 -6.0 -38 50 14.2 May-90 2.0 3 1 12.2 Jan-97 -9.3 -63 10 2.0 Oct-83 -6.2 -41 42 10.4 Jun-90 -5.6 -37 39 13.9 Feb-97 -5.9 -36 60 7.0 Nov-83 -6.9 -51 35 7.2 Jul-90 -2.5 -20 8 17.4 Mar-97 -6.9 -46 9 8.6 Dec-83 -8.4 -57 58 5.6 Aug-90 -4.5 -30 32 18.7 Apr-97 -6.8 -49 13 8.9 Jan-84 -9.9 -76 70 4.3 Sep-90 -6.0 -36 27 13.3 May-97 -6.0 -47 58 11.7 Feb-84 -7.9 -55 34 3.6 Oct-90 -8.1 -57 47 12.6 Jun-97 -7.3 -52 63 14.9 Mar-84 -13.5 -96 61 4.9 Nov-90 -7.5 -51 21 7.0 Jul-97 -3.2 -19 36 17.0 Apr-84 -6.4 -42 3 7.8 Dec-90 -8.0 -53 57 4.2 Aug-97 -6.1 -41 80 19.7 May-84 -7.0 -50 67 9.6 Jan-91 -7.4 -51 80 3.6 Sep-97 -1.6 -10 9 14.8 Jun-84 -6.2 -45 53 14.8 Feb-91 -10.6 -76 25 1.1 Oct-97 -5.5 -40 52 10.4 Jul-84 -1.7 -12 10 16.8 Mar-91 -4.9 -38 35 8.0 Nov-97 -6.7 -42 81 8.6 Aug-84 -5.4 -38 33 18.0 Apr-91 -6.0 -44 59 8.0 Dec-97 -7.7 -57 50 5.9 Sep-84 -5.9 -41 70 14.0 May-91 -3.2 -15 5 10.7 Jan-98 -8.6 -67 74 5.5 Oct-84 -3.8 -24 45 11.5 Jun-91 -5.7 -47 65 12.6 Feb-98 -5.1 -42 5 6.9 Nov-84 -7.8 -50 82 8.4 Jul-91 -5.5 -41 74 17.6 Mar-98 -4.6 -27 49 8.2 Dec-84 -7.0 -42 51 5.2 Aug-91 -3.6 -22 17 17.5 Apr-98 -8.9 -66 126 8.1 Jan-85 -9.8 -68 46 0.3 Sep-91 -7.9 -55 50 14.9 May-98 -2.9 -26 15 13.2 Feb-85 -11.8 -88 26 2.4 Oct-91 -6.3 -41 40 10.0 Jun-98 -6.5 -54 63 14.9 Mar-85 -8.3 -54 39 4.7 Nov-91 -8.8 -65 59 7.1 Jul-98 -4.8 -30 24 16.0 Apr-85 -6.7 -46 30 8.3 Dec-91 -4.0 -31 11 4.0 Aug-98 -6.0 -46 38 16.1 May-85 -7.8 -57 76 10.7 Jan-92 -7.5 -50 19 3.5 Sep-98 -8.1 -57 92 15.7 Jun-85 -6.4 -43 130 12.7 Feb-92 -7.7 -57 20 5.3 Oct-98 -8.4 -62 104 10.8 Jul-85 -6.4 -45 46 16.2 Mar-92 -6.1 -39 40 7.7 Nov-98 -8.8 -63 51 5.7 Aug-85 -4.8 -32 57 15.0 Apr-92 -7.7 -52 55 8.8 Dec-98 -6.4 -40 63 5.8 Sep-85 -6.3 -44 29 14.5 May-92 -7.3 -50 61 13.7 Jan-99 -6.7 -49 82 5.8 Oct-85 -5.1 -30 22 10.6 Jun-92 -4.2 -29 37 15.6 Feb-99 -4.2 -23 25 5.3 Nov-85 -6.5 -43 55 4.0 Jul-92 -4.6 -36 64 16.7 Mar-99 -6.7 -49 30 7.5 Dec-85 -9.8 -64 117 6.8 Aug-92 -5.2 -36 100 16.3 Apr-99 -6.5 -48 50 9.6 Jan-86 -9.3 -69 52 3.6 Sep-92 -7.4 -48 92 13.9 May-99 -3.6 -24 39 13.2 Feb-86 -7.6 -47 11 -1.2 Oct-92 -9.3 -60 63 7.8 Jun-99 -5.1 -35 64 13.9 Mar-86 -7.5 -53 40 5.8 Nov-92 -8.8 -60 107 7.9 Jul-99 -0.1 -9 5 17.2 Apr-86 -7.7 -53 48 6.3 Dec-92 -8.9 -66 57 3.8 Aug-99 -7.2 -45 104 16.7 May-86 -5.9 -41 72 10.8 Jan-93 -5.7 -37 75 6.4 Sep-99 -7.2 -45 94 16.0 Jun-86 -7.3 -47 16 14.9 Feb-93 -6.4 -39 4 4.5 Oct-99 -7.0 -46 54 10.6 Jul-86 -5.7 -40 40 16.2 Mar-93 -8.0 -58 20 6.7 Nov-99 -8.4 -57 36 7.8 Aug-86 -6.6 -44 104 14.3 Apr-93 -7.6 -54 81 9.5 Dec-99 -9.9 -65 88 4.9 Sep-86 -10.2 -71 36 10.9 May-93 -5.7 -29 63 12.0 Jan-00 -3.7 -17 1 4.6 Oct-86 -5.0 -36 53 11.2 Jun-93 -5.9 -40 59 15.2 Feb-00 -7.6 -50 67 6.5 Nov-86 -7.6 -51 81 7.9 Jul-93 -4.8 -35 52 15.7 Mar-00 -4.1 -29 9 7.4 Dec-86 -7.9 -54 68 5.9 Aug-93 -5.2 -32 36 15.2 Apr-00 -10.0 -66 125 8.4 Jan-87 -8.2 -51 4 0.3 Sep-93 -8.1 -49 97 12.5 May-00 -9.4 -67 72 12.5 Feb-87 -7.2 -50 28 3.9 Oct-93 -7.7 -52 99 9.0 Jun-00 -2.7 -11 27 15.5 Mar-87 -10.3 -75 54 4.4 Nov-93 -7.2 -50 30 5.1 Jul-00 -6.3 -45 41 15.4 Apr-87 -9.5 -66 50 10.0 Dec-93 -8.3 -60 76 5.9 Aug-00 -4.4 -30 37 17.4 May-87 -6.5 -46 51 10.1 Jan-94 -9.1 -65 70 5.7 Sep-00 -7.7 -46 78 15.3 Jun-87 -6.8 -50 75 13.3 Feb-94 -9.0 -62 23 3.9 Oct-00 -9.2 -65 139 11.0 Jul-87 -8.2 -57 47 15.9 Mar-94 -5.8 -40 10 8.3 Nov-00 -10.3 -71 102 7.6 Aug-87 -3.6 -30 28 15.9 Apr-94 -7.3 -51 54 8.5 Dec-00 -7.8 -50 85 6.2 Sep-87 -3.4 -20 38 14.1 May-94 -6.8 -49 75 11.1 Jan-01 -10.7 -70 80 3.7 Oct-87 -8.0 -55 132 10.2 Jun-94 -6.9 -55 32 14.9 Feb-01 -7.3 -50 66 5.4 Nov-87 -7.8 -56 52 6.3 Jul-94 -3.1 -21 13 18.6 Mar-01 -9.7 -63 86 6.3 Dec-87 -4.6 -24 21 5.4 Aug-94 -4.9 -34 48 16.7 Apr-01 -6.6 -45 65 8.5 Jan-88 -8.7 -63 103 5.5 Sep-94 -6.9 -45 60 13.2 May-01 -8.0 -53 29 12.7 Feb-88 -6.7 -45 30 4.8 Oct-94 -7.9 -56 62 10.4 Jun-01 -3.5 -26 16 14.8 Mar-88 -6.7 -43 42 6.7 Nov-94 -8.8 -62 55 10.4 Jul-01 -4.2 -29 28 17.9 Apr-88 -5.8 -35 17 8.1 Dec-94 -6.7 -46 60 6.6 Aug-01 -8.3 -53 94 17.5 May-88 -4.2 -28 51 11.9 Jan-95 -9.3 -68 111 5.0 Sep-01 -5.9 -38 49 13.8 Jun-88 -5.8 -43 45 14.2 Feb-95 -6.8 -42 56 7.0 Oct-01 -6.3 -43 119 14.1 Jul-88 -5.7 -44 76 15.0 Mar-95 -8.7 -60 32 5.9 Nov-01 -5.3 -35 26 7.3 Aug-88 -6.6 -48 47 15.5 Apr-95 -7.1 -52 19 9.3 Dec-01 -6.4 -40 25 3.0