HAL Id: hal-00316988
https://hal.archives-ouvertes.fr/hal-00316988
Submitted on 1 Jan 2002
HAL is a multi-disciplinary open access
archive for the deposit and dissemination of
sci-entific research documents, whether they are
pub-lished or not. The documents may come from
teaching and research institutions in France or
abroad, or from public or private research centers.
L’archive ouverte pluridisciplinaire HAL, est
destinée au dépôt et à la diffusion de documents
scientifiques de niveau recherche, publiés ou non,
émanant des établissements d’enseignement et de
recherche français ou étrangers, des laboratoires
publics ou privés.
Surface ultraviolet radiation over east Siberia: seasonal
variations
A. V. Mikhalev, M. A. Chernigovskaya, A. Yu. Shalin, E. S. Kazimirovsky
To cite this version:
A. V. Mikhalev, M. A. Chernigovskaya, A. Yu. Shalin, E. S. Kazimirovsky. Surface ultraviolet
radiation over east Siberia: seasonal variations. Annales Geophysicae, European Geosciences Union,
2002, 20 (4), pp.559-564. �hal-00316988�
Geophysicae
Surface ultraviolet radiation over east Siberia: seasonal variations
A. V. Mikhalev, M. A. Chernigovskaya, A. Yu. Shalin, and E. S. KazimirovskyInstitute of Solar-Terrestrial Physics SD RAS, P.O. Box 4026, Irkutsk, 664033, Russia Received: 10 May 2001 – Revised: 24 September 2001 – Accepted: 3 October 2001
Abstract. The results of spectral measurements of the daily
near-noon surface direct solar ultraviolet radiation in the wavelength range of 295–345 nm obtained in Irkutsk (East Siberia) for the time interval of 1998–2000 are presented. For the period under consideration, the seasonal UV radia-tion variaradia-tions are analysed that are associated with the total ozone dynamics, the transition of cyclonic and anticyclonic (Siberian anticyclone) periods, the presence of snow cover, and other factors. The analysis reveals an asymmetric be-haviour of the seasonal course in ground-level UV radiation around the time of the summer solstice, with seasonal varia-tion dependence on the wavelength. We have determined the irregular variations of surface UV radiation that is typical for the region, with their properties dependent on the season and on the spectral range analysed. The similarity of the above noted features from year to year was revealed.
Key words. Atmospheric composition and structure
(Trans-mission and scattering of radiation; instruments and tech-niques) – Meteorology and atmospheric dynamics (middle atmosphere dynamics)
1 Introduction
An important problem in the study of solar-terrestrial rela-tionships is the investigation of the possible variability of sur-face solar UV radiation. These variations can be associated with climatic changes of some of the atmospheric parameters observed during the last several decades, in particular, with the existence of negative temporal trends and/or long-term variations in the atmospheric ozone (Dobson, 1968; Udel-hofen et al., 1999; Kruchenitsky et al., 1998; Kruchenitsky et al., 1999; Kazimirovsky et al., 1999). The variations in surface UV radiation (UVR) that are caused by changes in total ozone (TO) are in some cases comparable, or have even smaller values, compared with UV radiation variations of dif-ferent time scales associated with other meteorological fac-Correspondence to: A. V. Mikhalev (mikhalev@iszf.irk.ru)
tors. The largest amplitude variations in the UV radiation are associated with changes in the angle of solar altitude (diurnal and seasonal variations), as well as the presence of a cloud cover. In mid-latitudes, these UVR variations can reach tens or hundreds of percent or more, depending on the wave-length. The seasonal variations can be divided into two cate-gories. First, there are regular variations caused by seasonal changes in the angular altitude of the Sun (they depend on the latitude of the observation site). Second, the other cate-gory includes irregular variations associated with the proper-ties of the climatic regime of a given region (i.e. they depend on its geographic location and on the physical-geographical properties). It is the irregular seasonal variations that are of special interest, as a climatic characteristic of the UV radi-ation field of the investigated region. These variradi-ations are also an important parameter that determines the variances of the monthly and annual amounts of UV radiation. The exis-tence of the physical-geographic features of the investigated regions motivates the need for simultaneous observations of surface UVR in many regions of the planet (Bener, 1960; Bener, 1963; Justus and Murphey, 1994; McKenzie et al., 1993; Pu Bu Ci Ren et al., 1999; Svenoe et al., 1994; Udel-hofen et al., 1999; Nezval, 1996; Mikhalev et al., 2000). The Antarctic region is of particular interest, where the most con-siderable TO variations are observed.
This paper presents the results of surface direct UVR observations at Irkutsk (52◦N, 102◦E), the region of East Siberia. The characteristic property of the observation point is that the Siberian region is a zone of the stable Asian anticy-clone in which anomalously low values of the TO have been observed lately in some periods (Kruchenitsky et al., 1998; Kruchenitsky et al., 1999; Mikhalev et al., 2000).
2 Equipment and measurement procedure
Daily measurements of the near-noon UVR values were made in the wavelength range of 296–346 nm using a spec-trometer developed based on of the “KSVU-12” (LOMO)
560 A. V. Mikhalev et al.: Surface ultraviolet radiation over east Siberia
Table 1. The relative contribution of the diffused radiation into the
measured radiation under different angular altitudes of the Sun
Angular altitude of Fg·δ(θ ) · d(λ, θ ) the Sun (◦) 309 nm 344 nm 15 ∼1 0.19 30 0.19 0.06 45 0.02 0.03 60 0.01 0.02
complex and the IBM AT computer. The spectrometer in-cludes a monochromator with a reflecting rotating diffraction grating. The monochromator is designed using the asymmet-ric Fasti configuration with parabolic mirror objectives. The feature of the grating is 1200 rules/mm. In order eliminate the scattered light inside the monochromator, is located in front of the entrance. The filter transmits only the UV spec-tral region under investigation. A photomultiplier is installed on the output of the monochromator. The stability of the measuring channel is monitored every day using a reference light source. All measured data are updated using this rel-ative calibration. The measurements were made regardless of sky condition, i.e. on both clear and cloudy days. The measurements were made at the Sun’s passage of the optical axis of the system at the same time of day (12:30 LT). The intensity of radiation reaching the fixed vertical mat quartz area oriented in a southward direction was recorded. The an-gular half-width of the view field of the optical path in the vertical plane was ∼32◦. The spectral resolution in the spec-tral scanning was about 0.2 nm. The scanning was made at steps of 0.02 nm, with the scanning rate of ∼0.33 nm/s. The banded tungsten lamp, with a 200 W quartz window installed at 70 cm from the input window, was used for the absolute calibration of system. In addition, the Bouger straight-line method was applied for matching the measured radiation to tabular values of the extraterrestrial solar UVR radiation in the wavelength range under investigation.
Absolute spectral intensities of the continuous radiation spectrum of the lamp SIRSh-8.5-200-1 were determined through calculation. A pyrometer was used to determine the temperature of the lamp’s working radiation surface. The cal-ibration of the wavelengths in the measured spectra was car-ried out using a spectral mercury lamp from mercury emis-sion lines and in the ultraviolet spectral region.
The Bouger method was used to plot the dependencies of the decimal logarithm of the values of measured radiation (in arbitrary units) on the optical mass of the atmosphere. Upon extrapolating the resulting curves to the optical mass equal to zero, the measured values of UV radiation were set equal to the tabular values of the atmospheric radiation at a given wavelength. The data on the extra-atmospheric solar spec-trum reported in Makarova at al. (1991) was used. As a result, we estimate the accuracy of determination of the ab-solute values of the recorded UV radiation to be about 15%. The error introduced by the measuring channel does not ex-ceed 2%.
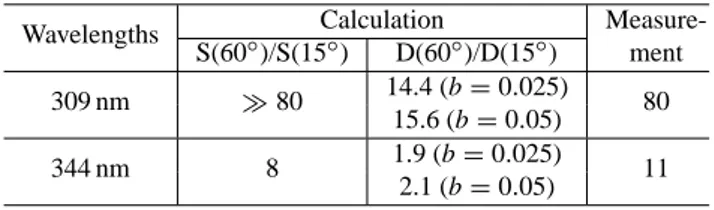
Table 2. A comparison of the measured and model calculated ratios
of radiation at two wavelengths
Calculation Measure-Wavelengths S(60◦)/S(15◦) D(60◦)/D(15◦) ment 14.4 (b = 0.025) 309 nm 80 15.6 (b = 0.05) 80 1.9 (b = 0.025) 344 nm 8 2.1 (b = 0.05) 11
Both direct radiation and a part of the scattered radiation are recorded in the UVR measurements in an arbitrarily ori-ented area using the instrument with a finite entrance aper-ture (i.e. from a limited area of the sky). For this reason, the measurement scheme required an estimation of the contribu-tion from the direct S and scattered D radiacontribu-tion to recorded signals, plus a selection of the processing technique for sig-nals in order to subsequencly analyze them. A formula was obtained for determining the proportion of direct radiation in the recorded UVR:
S⊥(λ, θ )/Jrec(λ) =1/{K(θ, ϕ)[1 + Fg·δ(θ ) · d(λ, θ )]}.(1) Here, S⊥(λ, θ ) is a direct radiation incident on an area ori-ented normal towards the sunward direction, Jrec(λ) is the radiation recorded by the instrument under the conditions de-scribed above, K(θ, ϕ) is the angular sensitivity coefficient of the receiving channel, Fg is the geometrical coefficient determined as part of the celestial hemisphere within the in-strument’s field of view, and δ(θ ) is the coefficient character-izing the brightness dependence of the part of the sky with the distance from the solar disk on the sight axis by an angle
θ. The coefficient d(λ, θ ) shows the proportion of scattered radiation relative to direct radiation in the UV range at dif-ferent altitudes of the Sun, surface albedo and atmospheric turbidity.
The coefficients K(θ, ϕ) and Fg were determined exper-imentally from a point source. The coefficient d(λ, θ ) was calculated using the data reported in Belinsky et al. (1968). For estimations, the value of the coefficient λ(θ ) was taken to be 1 for θ =15–30◦and 0.5 for θ = 45–60◦.
In the case where Fg·δ(θ ) · d(λ, θ )becomes substantially smaller than 1, this expression takes the form:
S⊥(λ, θ ) = Jrec/K(θ , ϕ). (2) Table 1 presents the values of Fg·δ(θ ) · d(λ, θ )estimated for different values of the angular altitude of the Sun at the two wavelengths of 309 and 344 nm. It is evident from Ta-ble 1 that the contribution of scattered UVR at the 344 nm and 309 nm wavelengths in the range of solar altitudes at 30– 60◦ can make up 2–6% and 1–19%, respectively. Conse-quently, under the given conditions, the contribution of scat-tered radiation can be neglected, and J⊥(λ, θ ) = S⊥(λ, θ ) can be assumed. The contribution of scattered radiation to
J⊥(λ, θ ) becomes substantial only in the case of minimum altitudes of the Sun at noon. The different rate of variation in the contribution from the scattered radiation depending on
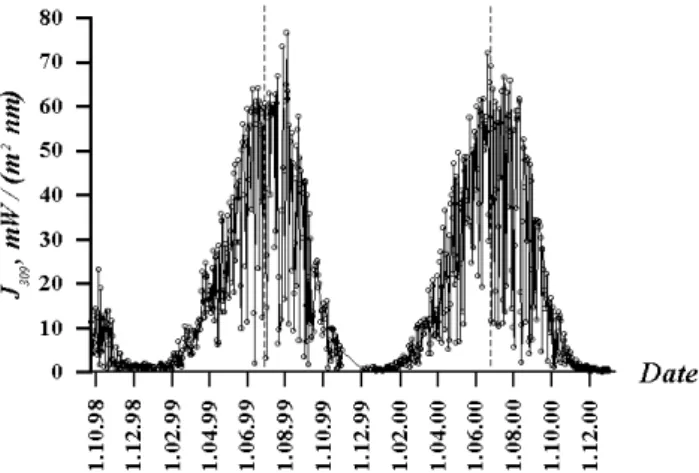
Fig. 1. The near-noon intensities of daily UVR observations on
309 nm wavelength.
the Sun’s altitude at different wavelengths is caused by a dif-ferent influence of the scattering and absorbing factors.
The values of J⊥(λ, θ )obtained with the help of the pro-cedure described above were compared with the calculated value variations of the direct and scattered radiation accord-ing to Belinsky et al. (1968) in the range of the measured angular altitudes of the Sun where θ ∼ 15 − 60◦. Table 2 presents the ratio values of the calculated (direct and scat-tered) radiation (Belinsky et al., 1968) to the measured radi-ation for two angles of solar altitudes at 15◦and 60◦. The values of D(60◦)/D(15◦) are given for two values of the coef-ficients (decimal) of atmospheric turbidity b = 0.025 and b = 0.05 (Belinsky et al., 1968). It is apparent from Table 2 that the observed variations of J⊥(λ, θ )are consistent to a greater extent with the variations in direct radiation S⊥(λ, θ ). The values of J⊥(λ, θ ) are presented and analyzed later in this paper.
3 Results of observations and discussion
Figure 1 presents the results of daily UVR observations for a 309 nm wavelength spanning the time interval from 24 September 1998 to 31 December 2000. The vertical dashed line indicates the day of the summer solstice. It is evident from Fig. 1 that the annual UVR variation is clearly deter-mined by the solar altitude. In addition, there is a strong day-to-day UVR variability, whose magnitude is affected pri-marily by the cloudiness variations, as well as by the aerosol conditions of the atmosphere and by the TO variations.
A more accurate analysis of the time variations reveals an asymmetric behaviour of the annual variation of UVR during the phases of spring growth (1st half-year) and autumn de-cline (2nd half-year), which are caused by variations in solar altitude, i.e. the presence of seasonal variations. For a nu-merical evaluation of this effect, Fig. 2 presents the averaged (over two years) UVR variations for two half-years (from 23 December to 22 June and from 23 June to 22 December). The curves are shown depending on the angular altitude of
the Sun for the wavelengths of 309 nm (a) and 344 nm (b). The variations for the first and second half-years of 1999– 2000 are shown by thin and thick lines, respectively. The values of J⊥(309 nm,θ ) for the second half-year in the range of the solar altitude at 30–60◦(June–September) consistently exceed those of J⊥(309 nm,θ ) for the first half-year (March– June) (see Fig. 2a) by as much as 40–50%. The UVR inten-sity J⊥(344 nm, θ ) presented in Fig. 2b shows an excess in the values for the first half-year of 1999–2000 over the re-spective values for the second half-year in the range of an-gles at ∼15–40◦(corresponding to the periods of January– March and September–December). A substantial increase in
J⊥(344 nm,θ ) in the range of angles of 30–40◦was observed in the spring period of 1999.
The above differences of the seasonal dependencies of J⊥ (309 nm, θ ) and J⊥(344 nm, θ ) are caused by the peculiari-ties of the spectral dependence of the main factors influenc-ing the incident UVR. It is known that in the spectral range under consideration in the case of a cloudless sky, the princi-pal influence on the attenuation of UV radiation comes from the Rayleigh and aerosol scattering and from the absorption by the ozone. Furthermore, in the region of ∼345–350 nm wavelengths the main contribution to the radiation flux at-tenuation is made by the scattering from aerosols and by the Rayleigh scattering, while the proportion of ozone makes up ∼0.1%. With a shift in the UV spectrum into the short-wavelength region, the contribution to the attenuation by the ozone increases up to ∼85% at the 280 nm wavelength (Ba-nakh et al., 1986). According to our estimates, at the 309 nm wavelength, the contribution of ozone to the absorption at the ground will make up 50%. In this case, the asymmetric behaviour of the seasonal UVR variation with respect to the summer solstice in the short-wavelength region of 309 nm can be caused by the pronounced annual variation of the TO over the region (Kazimirovsky et al., 1999) with a maximum in the first half-year. The behaviour of the UV radiation at the 344 nm wavelength seems to be associated to a greater extent with the difference in the cloud and aerosol regime of the atmosphere during the different seasons. By remov-ing the annual trend of the UV radiation, it is possible to select irregular variations caused by climatic and meteoro-logical properties of the region and by the prevailing regimes of atmospheric circulation at the point of observation for the different seasons (Shver et al., 1981).
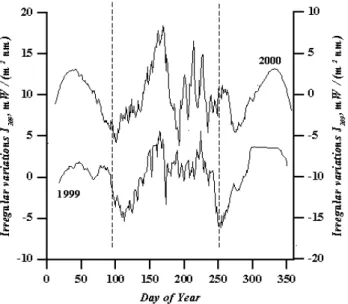
Figure 3 shows the year-to-year changes in the irregular variations of the UV radiation at the 309 nm wavelength for 1999 and 2000. These curves were obtained by removing the annual trend of UV radiation and by subsequently smoothing the data using the moving average over 21 days. As expected, a recurrence of irregular variations was observed.
Figure 4 presents the averaged irregular UVR variations for two wavelengths of 309 and 344 nm for the year 1999. There is a visually traceable different degree of correlation of the UVR variations at the two wavelengths for the differ-ent seasons. The days between ∼100–280 of the year (the angular altitude of the Sun where θ > 30 − 40◦) show a high similarity in the curves’ form for the irregular variations of
562 A. V. Mikhalev et al.: Surface ultraviolet radiation over east Siberia
Fig. 2. The averaged, smoothed UVR variations for two half-years depending on the angular altitude of the Sun for the wavelengths of
309 nm (a) and 344 nm (b).
Fig. 3. The averaged year-to-year changes in the irregular UVR
variations at 309 nm for 1999 and 2000.
the UV radiation for both wavelengths (with the presence of a high-frequency component). On the other hand, the days between ∼1–100 and ∼280–365 (θ < 44◦ and θ < 30◦, respectively) already show some differences in the UVR ir-regular variations as large as an anticorrelation (see, for ex-ample, the time interval of days between ∼1–80). This pecu-liarity seems to be caused by a different contribution in the different seasons from the attenuation of the UVR radiation due to the Rayleigh and aerosol scattering and the absorption by ozone at different solar altitudes (optical masses). At low solar altitude, a larger contribution to the attenuation of direct radiation is made by the Rayleigh and ozone atmospheres (which are less variable compared to the aerosol component) due to a large optical mass value. At large angles of solar
Fig. 4. The averaged irregular UVR variations upon removal of the
annual trends for two wavelengths for 1999.
altitude and at small values of optical mass, variations in the aerosol component (and cloudiness) become crucial. Since this component has a weak spectral dependence of the scat-tering coefficients, this leads to a high correlation of UVR variations at the 309 and 344 nm wavelengths.
The presence of a distinctly pronounced annual TO varia-tion in the region under consideravaria-tion (Kazimirovsky et al., 1999), with a maximum at the beginning of the year and a minimum in autumn, is responsible for the difference in the irregular UVR variations. The UVR variations in the ozone-dependent part of the spectrum (309 nm) differ from those in the long-wavelength part of the spectrum (344 nm), where the TO influence becomes insignificant. The same factor can be employed to account for the fact that the transition on the
Fig. 5. The variation coefficients of the recorded UVR for the 309
and 344 nm wavelengths for the whole period of observation.
irregular variation curves from the sector with a high degree of correlation to the sector with a lower correlation occurs at different solar altitudes for UVR at two wavelengths. At the beginning of the year, when the TO has a maximum value this boundary can be determined near the solar altitude of
∼42–44◦, and in autumn, near 30–32◦(in Figs. 3 and 4, these arbitrary boundaries are shown by vertical dashed lines).
The day-to-day variability of the near-noon surface UVR also has a seasonal dependence. Figure 5 presents the “vari-ation coefficients” of the recorded UVR for the 309 and 344 nm wavelengths. These coefficients are determined as the averaged (over the same months during the period under consideration) ratio of the standard deviation to the monthly mean value of UVR. By excluding the winter months from the analysis (when the contribution of the scattered radia-tion to the value of J⊥(λ, θ ) becomes substantial), one no-tices that a maximum value of the variation coefficient is ob-served in October, and minimum value is obob-served in June. The variation coefficients for 309 nm wavelength in the first months of the year (February–April), when the largest val-ues of TO are observed, exceed those for the 344 nm wave-length. This may be interpreted by the fact that the observed UVR variations in the ozone-dependent part of the spectrum are determined both by variations in the aerosol and Rayleigh components and by TO variations. On the other hand, in the summer months, the UVR variation coefficients at two an-alyzed wavelengths are virtually identical. This feature can be connected with the predominance of the contribution from variations in the aerosol atmosphere component, as described above.
Consequently, irregular variations of UVR in the different seasons of the year can be caused by different factors, such as TO dynamics, aerosol component, cloudiness, and have a
different character for the different parts of the spectral range under consideration. The above mentioned peculiarities of the UVR variations must have differences in the other re-gions with different latitudes at the observation site, where a different TO dynamic, climatic and meteorological regime exists.
4 Conclusions
The main results of this study may by summarized as fol-lows:
1. For the East Siberia region, we have identified an asym-metry of the seasonal variation of ultraviolet radiation (295–345 nm) with respect to the summer solstice. This asymmetry is brought about by the presence of a pro-nounced seasonal variation in the total ozone and by the meteorological properties of the region.
2. We have determined the irregular variations of surface UV radiation typical for the region and their properties dependent on the season and on the spectral range ana-lyzed.
Acknowledgements. Topical Editor D. Murtagh thanks W.
Josefs-son for his help in evaluating this paper.
References
Banakh G. F., Ippolitov I. P., and Lopasova, T. A.: The atmospheric influence on the short-wavelength boundary of solar UV radia-tion at the Earth’s surface, Kosmicheskie issledovaniya, (in Rus-sian), 24, 6, 890–895, 1986.
Belinsky, V. A., Garadzha, M. P., Mezhennaya, L. M., and Nez-val, E. I.: Solar and Sky Ultraviolet Radiation, Moscow: Izd-vo MGU, 228 (in Russian), 1968.
Bener, P.: Investigation on the spectral intensity of UV sky and sun + sky radiation, Davos, 1960.
Bener, P.: The duirnal and anneal variations of the spectral inten-sity of UV sky and global radiation on cloudless days at Davos, Davos, 1963.
Dobson, G. M. B.: Exploring the atmosphere, Oxford: Clarendon Press, 1968.
Justus, C. G. and Murphey, B. B.: Temporal trends in surface ir-radiance at ultraviolet wavelengths, J. Geophys. Res., 99, D1, 1389–1394, 1994.
Kazimirovsky, E. S., Matafonov, G. K., Vergasova, G. V., and Be-linskaya, A. Yu.: Trends and low-frequency variations in total ozone content over East Siberia, Issledovaniya po geomagne-tizmu, aeronomii i fizike Solntsa, (in Russian), 109, 2, 190–199, 1999.
Kruchenitsky, G. M., Kadyrova, T. V., Ivanova, N. S., and Zvyag-intsev, M. A.: Total ozone content over Russia and adjacent ter-ritories in 1997, Meteorologiya i gidrologiya, (in Russian), 2, 119–122, 1998.
Kruchenitsky, G. M., Zvyagintsev, M. A., and Ivanova, N. S.: Ozone content over Russia and adjacent territories in the 3rd quarter of 1999, Meteorologiya i gidrologiya, (in Russian), 11, 18–122, 1999.
564 A. V. Mikhalev et al.: Surface ultraviolet radiation over east Siberia Makarova, E. I., Kharitonov, A. V., Kazachevskaya, T. V.: Solar
Emission Flux, Moscow: Nauka, (in Russian), 397, 1991. McKenzie, R. L., Kotkamp, M., and Seckmeyer, G., et al.: First
southern hemisphere intercomparison of measured solar UV spectra, Geophys. Res. Lett., 20, 20, 2223–2226, 1993. Mikhalev A. V., Chernigovskaya, M. A., Shalin, A. Yu., and
Belet-sky, A. B.: Spectral measurements of ultraviolet radiation in East Siberia during a total ozone content anomaly, Meteorologiya i gidrologiya, (in Russian), 3, 29–35, 2000.
Nezval, E. I.: Statistical characteristics of incident ultraviolet radi-ation at Moscow as deduced from data for 1968–1992, Meteo-rologiya i gidMeteo-rologiya, (in Russian), 8, 64–71, 1996.
Pu Bu Ci Ren, Gjessing, Y., and Sigernes, F.: Measurements of solar
ultraviolet on the Tibetan Plateau and comparisons with discrete ordinate method simulations, J. Atmos. Terr. Phys., 61, 425–446, 1999.
Shver, Ts. A. and Formanchuk, N. P.: The Climate of Irkutsk, Leningrad: Gidrometeoizdat, (in Russian), 247, 1981.
Svenoe, T., Olsen, M., Henriksen, K., and Stamnes, K.: Measure-ments of lunar and solar ultraviolet spectra at high latitudes, Ge-omagn. and Aeron., 34, 5, 189–193, 1994.
Udelhofen P. M., Gies P., Roy C., and Randel, W. J.: Surface UV radiation over Australia, 1979–1992: Effects of ozone and cloud cover changes on variations of UV radiation, J. Geophys. Res., 104, D16, 19 135, 1999.