HAL Id: hal-01651675
https://hal.archives-ouvertes.fr/hal-01651675
Submitted on 14 Apr 2021
HAL is a multi-disciplinary open access
archive for the deposit and dissemination of
sci-entific research documents, whether they are
pub-lished or not. The documents may come from
teaching and research institutions in France or
abroad, or from public or private research centers.
L’archive ouverte pluridisciplinaire HAL, est
destinée au dépôt et à la diffusion de documents
scientifiques de niveau recherche, publiés ou non,
émanant des établissements d’enseignement et de
recherche français ou étrangers, des laboratoires
publics ou privés.
upper ocean
Y. H. Yang, C. Motegi, T. Yokokawa, T. Nagata
To cite this version:
Y. H. Yang, C. Motegi, T. Yokokawa, T. Nagata. Large-scale distribution patterns of
virioplank-ton in the upper ocean.
Aquatic Microbial Ecology, Inter Research, 2010, 60 (3), pp.233-246.
�10.3354/ame01428�. �hal-01651675�
INTRODUCTION
Viruses are widespread, abundant, and important agents of bacterial (Breitbart et al. 2008) and algal mor-tality (Baudoux et al. 2007, Suttle 2007) in the sea, exerting major influences on microbial diversity and biogeochemical cycling (Fuhrman 1999, Motegi et al. 2009). However, little is known about the distribution patterns of viral abundance across different oceanic regions. Spatial variability in physical forcing, such as
the mixing of water columns and photon irradiations, largely explains the occurrence of diverse biogeo-chemical provinces, which are characterized by differ-ent levels and seasonal patterns in primary productiv-ity and are accompanied by distinctive communproductiv-ity structures and modes of carbon and nutrient cycles (Longhurst 2006). Understanding viral distributions under diverse physical and biogeochemical settings along large-scale oceanographic gradients may help to identify principal mechanisms by which viral
popula-© Inter-Research 2010 · www.int-res.com *Corresponding author. E-mail: [email protected]
Large-scale distribution patterns of virioplankton
in the upper ocean
Yanhui Yang
1, 2, 3, Chiaki Motegi
1, 2, 4, 5, Taichi Yokokawa
2, 6, Toshi Nagata
1, 2, 3,*
1Ocean Research Institute, The University of Tokyo, Tokyo 164-8639, Japan 2Center for Ecological Research, Kyoto University, Otsu, Shiga, 520-2113, Japan
3Present address: Atmosphere and Ocean Research Institute, The University of Tokyo, 5-1-5 Kashiwanoha,
Kashiwa, Chiba 277-8564, Japan
4
Present address: Université Pierre et Marie Curie-Paris 6, Laboratoire d’Océanographie de Villefranche, BP 28, 06230 Villefranche-sur-Mer Cedex, France
5Present address: CNRS, Laboratoire d’Océanographie de Villefranche, BP 28, 06230 Villefranche-sur-Mer Cedex, France 6Present address: Department of Biological Oceanography, Royal Netherlands Institute for Sea Research (NIOZ),
PO Box 59, 1790 AB Den Burg, Netherlands
ABSTRACT: We used flow cytometry to investigate large-scale distribution patterns of viruses and their subclusters in the upper 200 m water column of the central Pacific Ocean and the Pacific sector of the Southern Ocean. The abundances of 3 groups of photoautotrophic picoplankton (APP), includ-ing Synechococcus, picoeukaryotes, and Prochlorococcus, accounted for a large fraction of viral
abundance variability (r2= 0.570, n = 354, p< 0.001). The relative contribution of the viral subcluster
with high fluorescence intensity (HV) increased with increasing abundance of APP. These data are consistent with the notion that viruses infecting APP are abundant, and the HV subcluster might con-tain large numbers of these viruses especially in subtropical and tropical oceans. Relationships between viral abundance and biotic variables differed among regions, indicating that controls of virus-host systems are largely distinct among different oceanic regions. We found a conspicuous peak of viral abundance in the mid-latitude region of the North Pacific. This ‘viral hot spot’ coincided with a dissolved oxygen anomaly (the excess above saturation) indicated by negative values (–15 to
–59 µmol kg–1) of apparent oxygen utilization. Our results support the notion that large-scale
distrib-ution patterns of viruses and their subclusters in the upper oceans are affected by a combined effect of host distributions and physical processes.
KEY WORDS: Virioplankton · Viral subclusters · Flow cytometry · Photoautotrophic picoplankton · Pacific Ocean · Southern Ocean
tions are controlled; hence, this is an essential initial step toward the embedment of viruses into the models of oceanic ecosystems and biogeochemical cycles.
Because viral proliferation depends on the metabo-lism of host cells, the abundance and activity of these hosts may primarily determine viral distributions in the oceans. Bacteria and photoautotrophic picoplankton (APP) are the most abundant and probably the major hosts of viruses in the upper oceans (Fuhrman 1999, Mann 2003). Consistent with this notion, previous studies have found that viral abundance is strongly positively correlated with bacterial abundance in some oceanic regions (Steward et al. 1996, Culley & Welschmeyer 2002). Little information is available about the relationship between viral abundance and APP. A recent study suggested that viruses infecting APP might be abundant in subtropical waters. At Stn ALOHA off the coast of Hawaii (subtropical North Pacific), metagenomic analysis of viral genes in a picoplankton fraction (0.22 to 1.6 µm) revealed that 60 to 80% of the total viral sequences in the photic zone were apparently those of cyanophages (DeLong et al. 2006), which suggests a considerable contribution of cyanophages to viral production. The relative impor-tance of APP and bacteria in influencing variations in viral abundance on a global scale remains unclear.
In addition to host abundance, factors that cause the loss of viruses may also account for the variations in viral abundance. These factors include UV radiation (Heldal & Bratbak 1991, Suttle & Chen 1992, Noble & Fuhrman 1997), extracellular proteases (Noble & Fuhrman 1997, Motegi & Nagata 2009), colloidal organic matter (Proctor & Fuhrman 1991), scavenging by large particles (Proctor & Fuhrman 1991), capsid decay due to internal pressure (De Paepe & Taddei 2006), and protist grazing (Gonzalez & Suttle 1993). One theory predicted that interactive effects of mixing processes and UV radiation can largely affect viral dynamics in oceanic water columns (Murray & Jackson 1993). However, it is not entirely clear how these mul-tiple forces shape large-scale viral distributions in the upper oceans.
Flow cytometry has become a powerful tool to deter-mine viral abundance in seawater (Marie et al. 1999, Brussaard 2004), allowing investigators to discriminate 2 or 3 subclusters of viruses on the basis of the fluores-cence intensity of the dye bound to viral nucleic acids (Marie et al. 1999, Li & Dickie 2001, Brussaard et al. 2008). Several studies have found that different sub-clusters display different patterns in distributions and dynamics in marine systems, leading to the proposition that the flow cytometric discrimination of viral subclus-ters may help to discern between viruses infecting bac-teria and those infecting algae (Marie et al. 1999, Li & Dickie 2001, Suttle 2007, Brussaard et al. 2008, Larsen
et al. 2008). However, few studies have examined dis-tributions of different viral subclusters across oceanic regions with largely different compositions of host communities.
Here, we examined distributions of viruses in the upper water column (0 to 200 m) at 38 stations along 3 transects deployed in broad regions of the central Pacific and Southern Oceans. Abundances of viruses,
bacteria, and APP (Prochlorococcus, Synechococcus,
and picoeukaryotes) were counted using flow cytome-try (Campbell 2001, Brussaard 2004). We explored dis-tribution patterns of viral abundance and their sub-clusters in the upper water column. The purposes of this study were to (1) examine how viral abundance and subcluster compositions are related to distribu-tions of bacteria (abundance and production) and APP, and (2) analyze possible relationships between distrib-utions of viruses and oceanographic parameters over a large spatial scale.
MATERIALS AND METHODS
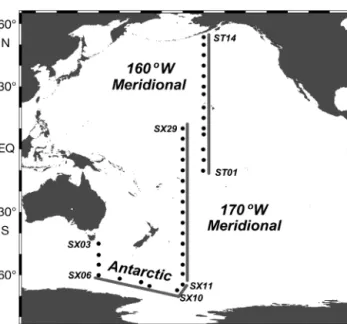
Sample waters were collected aboard the RV ‘Hakuho-maru’ during 2 summer cruises: KH04-5 (December 2004 to March 2005) and KH 05-2 (August to September 2005). A total of 38 stations were occu-pied to cover a broad range of oceanic regions in the Southern and Pacific Oceans (Fig. 1; see also Table 1 for details on sampling sites and oceanic regions). At each station, sample waters were collected at 10 or 11
Fig. 1. Sampling stations occupied during cruises KH04-5 and KH05-2. The map was created using Ocean Data View (http://odv.awi.de/). Station codes are included for selected stations. Stations along 3 transect lines were used to create
different depths in the upper 200 m by using clean 12 l Niskin-X bottles (General Oceanics) attached to a water sampler equipped with a conductivity-tempera-ture-depth profiler (Sea-Bird Electronics, Model 9 plus). Surface seawater samples were collected using a clean bucket.
Samples for the measurement of the viral abun-dance, bacteria, and APP were maintained in 2 ml capacity cryovials (Nalgene) and fixed with 0.02 µm-filtered (25 mm syringe-type Whatman Anotop filters) glutaraldehyde to a final concentration of 1%. After fixation for 30 min in the dark, the samples were frozen in a deep freezer (–80°C; cruise KH04-5) or in liquid
nitrogen (cruise KH05-2). The frozen samples were preserved in a deep freezer for later analysis using a flow cytometer (FACSCalibur, Becton Dickinson) equipped with a 15 mW, 488 nm air-cooled argon-ion laser and standard filter set. Viruses were counted according to Marie et al. (1999) and Brussaard (2004) with modifications. After thawing, samples were
diluted (50 to 200×) with TE buffer (10 mmol l–1
Tris-HCl, 1 mmol l–1 EDTA acid, pH 8.0, Wako, filtered
through 0.02 µm Whatman Anotop filters). Samples were spiked with SYBR Green I at a final concentration
of 5 × 10– 5 dilution of commercial stock (Molecular
Probes) and incubated at 80°C for 10 min, followed by
Region Station Local date Longitude Latitude Temperature NO3
(dd/mm/yy) (°E) (°N) (°C) (µmol l–1)
Antarctic region SX06 23/12/04 150.0 –60.0 0.8 28.56 SX07 24/12/04 160.0 –61.7 0.8 27.39 SX08 26/12/04 170.1 –63.4 0.8 25.95 SX09 28/12/04 174.2 –65.1 –0.4 23.72 SX10 31/12/04 –172.7 –67.2 –0.5 23.31 SX11 02/01/05 –170.0 –64.5 0.3 25.67 Subantarctic & SX03 19/12/04 149.9 –44.9 13.9 3.34 subtropical SX04 20/12/04 150.0 –50.3 8.8 15.76 convergence SX05 21/12/04 150.0 –55.0 7.2 17.75 zone SX12 04/01/05 –170.0 –59.4 4.6 21.38 SX13 06/01/05 –170.0 –55.0 7.2 19.29 SX14 07/01/05 –170.0 –50.0 11.3 10.49 SX15 09/01/05 –170.0 –45.0 14.9 0.71 SX17 11/01/05 –170.0 –40.0 16.3 < 0.05 South Pacific SX19 23/01/05 –170.0 –35.0 19.6 < 0.05 subtropical SX20 27/01/05 –170.0 –30.0 23.7 < 0.05 region SX21 29/01/05 –170.0 –25.0 26.4 < 0.05 SX22 31/01/05 –170.0 –20.0 28.6 < 0.05 SX24 21/02/05 –170.0 –15.0 29.6 < 0.05 Equatorial region SX25 23/02/05 –170.0 –10.0 29.2 < 0.05 SX26 25/02/05 –170.0 –4.9 29.1 < 0.05 SX27 27/02/05 –170.0 0.1 28.7 2.68 SX28 01/03/05 –170.0 5.1 28.7 0.27 SX29 03/03/05 –170.0 10.0 27.4 < 0.05 ST01 19/08/05 –160.3 –10.2 29.0 < 0.05 ST02 21/08/05 –160.0 –5.0 28.3 4.55 ST03 22/08/05 –160.2 0.0 27.5 4.28 ST04 24/08/05 –160.0 7.2 28.9 0.06 ST05 24/08/05 –160.0 10.1 27.9 0.13 North Pacific ST06 26/08/05 –160.0 15.0 27.1 < 0.05 subtropical ST07 27/08/05 –160.0 20.0 27.0 < 0.05 region ST08 04/09/05 –160.0 26.3 27.2 < 0.05 ST09 04/09/05 –160.0 30.0 26.6 < 0.05 ST10 06/09/05 –160.0 35.0 25.1 < 0.05
Subarctic & North ST11 07/09/05 –160.0 40.0 20.2 0.06
Pacific transition ST12 09/09/05 –160.0 45.0 16.0 7.39
zone ST13 10/09/05 –160.0 50.0 12.6 11.70
ST14 12/09/05 –160.0 53.6 12.5 < 0.05
Table 1. Sampling date, geographic position, surface water temperature, and NO3concentration of each station during cruises
KH04-5 (Stns SX03–SX29) and KH05-2 (Stns ST01–ST14; data are from the Cruise Report, Ocean Research Institute, The Univer-sity of Tokyo). Six oceanic regions were distinguished according to Longhurst (2006), on the basis of physical and biogeochemical
cooling to room temperature in the dark. Yellow-green beads of 1 µm (Molecular Probes) were then added to the samples as an internal standard of the fluorescence intensity. Samples were run for at least 3 min with
event rates of 100 to 400 counts s–1. The data obtained
for green fluorescence (FL1) and side scatter (SSC) were collected for analysis using CellQuest software (Becton Dickinson). Duplicate or triplicate blanks (SYBR Green I and TE buffer were mixed, heated, and amended with beads) were run for every 8 to 10 sam-ples. Blank values (< 5% of total counts) were sub-tracted to derive virus counts. Flow rates were deter-mined at least twice a day by weighing the TE buffer before and after the injection for 10 min, and these rates were multiplied by the running time to calculate virus abundance (Campbell 2001). The average daily flow rate variation was 2 to 3%. Viral subclusters were distinguished on the basis of FL1 intensity (see ‘Results’). Fixed gates were used for all samples using constant voltage settings. Conditions for staining and counting were carefully controlled to minimize the noise due to reagents, sheath fluids, and optics. Errors in counts associated with flow fluctuations were also minimized by intensive maintenance of fluid delivery system. Deviation between duplicate viral counts was typically 4 to 7% of the average value.
For counting non-pigmented prokaryotes (bacteria), sample waters were stained with SYBR Green I (final
concentration 10– 4dilution of commercial stock) for 15
to 30 min at room temperature in the dark, spiked with the standard beads, and injected into the flow
cytome-ter. When event rates exceeded 400 counts s–1, samples
were reanalyzed after dilution with TE buffer (10×).
For APP counts, water samples were spiked with the standard beads and injected into the flow cytometer. The cytograms that relate red fluorescence (FL3) to SSC, orange fluorescence (FL2) to SSC, FL2 to FL3, and SSC to forward scatter (FSC) were analyzed to
discriminate among Prochlorococcus, Synechococcus,
and picoeukaryotes (Campbell 2001). Deviations be-tween duplicate counts were typically 2 to 4% of the average values.
Bacterial production rate was estimated from the
incorporation of 3H-leucine (Kirchman 2001).
Subsam-ples (1.5 ml) were contained in screw-capped cen-trifuge tubes (2 ml capacity, ISI), spiked with 10 nmol
l–1of 3H-leucine (Amersham TRK510), and incubated
at in situ temperature (± 2°C) in the dark. Triplicate
samples and 1 trichloroacetic acid (TCA)-killed control were prepared. After incubation for 1 h, samples were extracted with 5% TCA and ice-cold 80% ethanol using a microcentrifuge. Pellets were dried, mixed with a scintillation cocktail (Ultima-Gold, Packard), and radioassayed with a liquid scintillation counter (Wallac 1414) with quench corrections. The
coeffi-cients of variation of triplicate measurements were typ-ically less than 10%. Leucine incorporation rate was converted to bacterial production using a 1.5 kg C
mol–1conversion factor (Kirchman 2001).
Chlorophyll a (chl a) concentration was determined
fluorometrically after N,N-dimethylformamide extrac-tion of particles collected on Whatman GF/F filters. Dissolved oxygen concentration was determined by the Winkler method using a high precision titrator (Metrohm, 793 MPT Titrino).
Relationships between viral and environmental vari-ables were analyzed using routines of the Distance Based Linear Model (DISTLM) with an implementation of distance based redundancy analysis (dbRDA) in Per-manova+ for Primer v6 (PRIMER-E). Differing from tra-ditional multiple regressions, DISTLM does not assume normality of data distributions because hypo-theses are tested by permutations (Anderson et al. 2008). In order to minimize influences of outliers, the variables with skewed distributions (examined on the Draftsman plot) were log transformed. Stepwise proce-dure was used to select predictor variables that account for the variability of response variables. The Bayesian Information Criterion was used to determine the model that best fit the data with the fewest predic-tor variables. Multi-collinearity of the predicpredic-tor vari-ables was checked by calculating the tolerance value
for each predictor variable (1 – r2: r2was obtained by
the multiple regression that relates a given predictor variable to the rest of the selected variables) with an approximate guide considering that values < 0.1 are problematic (Quinn & Keough 2002). In order to build linear regression models that relate viral variables to predictor variables with errors, we conducted Model II regression analyses according to Sokal & Rohlf (1995). Contour plots were generated using SigmaPlot 2001 (SYSTAT Software).
RESULTS
Distribution features of biotic variables Chl a concentration was highest in the upper water
columns of the Antarctic region, followed by the sub-arctic and transition zone of the North Pacific, whereas it was lowest in the equatorial and subtropical regions
(Figs. 2A & 3A). The subsurface peak of chla existed at
depths of 75 to 125 m in the subtropical regions of the South and North Pacific (Fig. 2A). Depth integrated (0–200 m) bacterial abundance was highest in the sub-antarctic/subtropical convergence zone, where the highest abundance was recorded in the upper water column (< 75 m), and lowest in the Antarctic region (Figs. 2B, 3B). Bacterial production tended to be higher
in the upper water columns (< 50 m) in equatorial, sub-tropical, and subarctic regions of the North Pacific (Fig. 2C), although the geographic pattern of the inte-grated values was less systematic (Fig. 3C). APP abun-dance was highest, especially in the upper layers (0–125 m), in equatorial and subtropical regions
(Figs. 3D, 4A) where Prochlorococcus dominated the
APP community (Fig. 4B). This abundance tended to decrease with increasing latitude, with the lowest inte-grated values in the Antarctic region (Fig. 3D). Inter-mediate abundances of APP were found in the subarc-tic/transition zone and the subantarctic/subtropical
convergence zone, where Synechococcus and
pico-eukaryotes were abundant (Figs. 3D & 4C,D).
Viral distributions and subclusters
Viral abundances varied within 1.5 × 10⁹ and 3.2 ×
1010particles l–1, which tended to decrease with depth,
except for a low abundance in the surface layer (< 20–40 m) in a broad area of subtropical regions (10–30° N and 10–30° S; Fig. 5A). We found a conspic-uous peak of viral abundance in the mid-latitude region of the North Pacific (between 25° and 45° N) at depths of 20 to 75 m (Fig. 5A). In accordance with these high values, the depth-integrated viral abundances were highest across the boundary of subtropical and subarctic gyres (Stns. 10 and 11; Fig. 3E). Excluding these data, the depth-integrated viral abundances Longitude (°E) 150 160 170 180 –170 Depth (m) 0 50 100 150 200 Depth (m) 0 50 100 150 200 Antarctic Depth (m) 0 50 100 150 200 (µg l–1) 160° W meridional 0.0 0.1 0.2 0.3 0.4 0.5 (µgC l–1 d–1) 0.0 0.2 0.4 0.6 0.8 1.0 (108 cells l–1) 2 4 6 8 10 170° W meridional Latitude (°N) Latitude (°N) –60 –50 –40 –30 –20 –10 0 10 –10 0 10 20 30 40 50
A
B
C
Fig. 2. Distributions of (A) chl a concentration, (B) bacterial abundance, and (C) bacterial production along the 3 transects in-cluding the Antarctic (Stns SX06 to SX11), 170° W meridional (Stns SX10 to SX29), and 160° W meridional (Stns ST01 to ST14). Stns SX10 and SX11 are included in both the Antarctic and 170° W meridional transects. See Fig. 1 and Table 1 for the positions
tended to be high in subtropical and tropical regions, and low in the Antarctic region. Mean ± SD virus to bacteria abundance ratios varied in the range of 8.6 ±
2.4 (n = 70, subantarctic and subtropical convergence zone) and 22.2 ± 14.4 (n = 104, equatorial region), with an overall average value of 17.6 ± 12.5 (n = 381).
A
Chlor ophyll a concentration (mg m –2) 0 20 40 60 80 100 120 140 I II III IV V VID
0 5 10 15 20 25 30 35 APP abundance (10 12 cells m –2 ) 0.0 0.2 0.4 0.6 0.8 1.0B
Bacterial abundance (10 12 cells m –2) 0 50 100 150 200 250C
Bacterial pr oduction (mg C m –2 d –1 ) 0 20 40 60 80 100E
Latitude (°N) –60 –40 –20 0 20 40 Longitude (°E) 150 160 170 180 –170 V iral abundance (10 12 particles m –2) 0 500 1000 1500 2000 2500 3000Fig. 3. Depth-integrated (0–200 m) values of (A) chl a concentration, (B) bacterial abundance, (C) bacterial production, (D) photo-autotrophic picoplankton (APP) abundance (note the different y-axis scales in this panel), and (E) viral abundance across differ-ent oceanic regions. The data obtained during cruises KH04-5 and KH05-2 are indicated by open and closed bars, respectively. Regional codes are as follows: I, Antarctic region; II, subantarctic and subtropical convergence zone; III, South Pacific subtropical
Three subclusters of viruses were distinguished on the basis of the fluorescence intensity (Fig. 6). These subclusters were denoted as high (HV), medium (MV),
and low (LV) fluorescence subclusters. Mean ± SD (n = 386) fluorescence intensities (arbitrary unit, standard-ized to bead fluorescence) of the HV, MV, and LV
sub-Depth (m) 0 50 100 150 200 50 100 150 200 Depth (m) 0 50 100 150 200 Depth (m) 0 50 100 150 200 0 5 10 15 20 25 (106 cells l–1) (106 cells l–1) (106 cells l–1) (106 cells l–1) 2 4 6 8 10 Depth (m) 0 50 100 150 200 30 60 90 120 150 180
A
B
C
D
Longitude (°E) 150 160 170 180 –170 Latitude (°N) Latitude (°N) –60 –50 –40 –30 –20 –10 0 10 –10 0 10 20 30 40 50 Antarctic 170° W meridional 160° W meridionalFig. 4. Distributions of (A) photoautotrophic picoplankton (APP) abundance, (B) Prochlorococcus abundance, (C) Synechococcus abundance, and (D) picoeukaryote abundance along the 3 transects including the Antarctic (Stns SX06 to SX11), 170° W merid-ional (Stns SX10 to SX29), and 160° W meridmerid-ional (Stns ST01 to ST14). Stns SX10 and SX11 are included in both the Antarctic and
clusters were 0.0382 ± 0.0034, 0.0134 ± 0.0010, and 0.0050 ± 0.0004, respectively, which differed signifi-cantly from each other (analysis of variance [ANOVA],
p< 0.001). Different subclusters displayed distinct
pat-terns in distributions, with regional variability being most pronounced in the HV subcluster. Relative (108 particles l–1) 20 40 60 80 100 120 140 160 2 4 6 8 10 12 % Longitude (°E) 150 160 170 180 –170 Depth (m) 0 50 100 150 200 Antarctic Depth (m) 0 50 100 150 200 160° W meridional 170° W meridional Latitude (°N) Latitude (°N) –60 –50 –40 –30 –20 –10 0 10 –10 0 10 20 30 40 50
A
B
Fig. 5. Distributions of (A) viral abundance and (B) relative percent contributions of the viral subcluster with high fluorescence in-tensity to total viral abundance (%HV) along the 3 transects including the Antarctic (Stns SX06 to SX11), 170° W meridional (Stns SX10 to SX29), and 160° W meridional (Stns ST01 to ST14). Stns SX10 and SX11 are included in both the Antarctic and 170° W
meridional transects. See Fig. 1 and Table 1 for the positions and oceanographic parameters of the stations
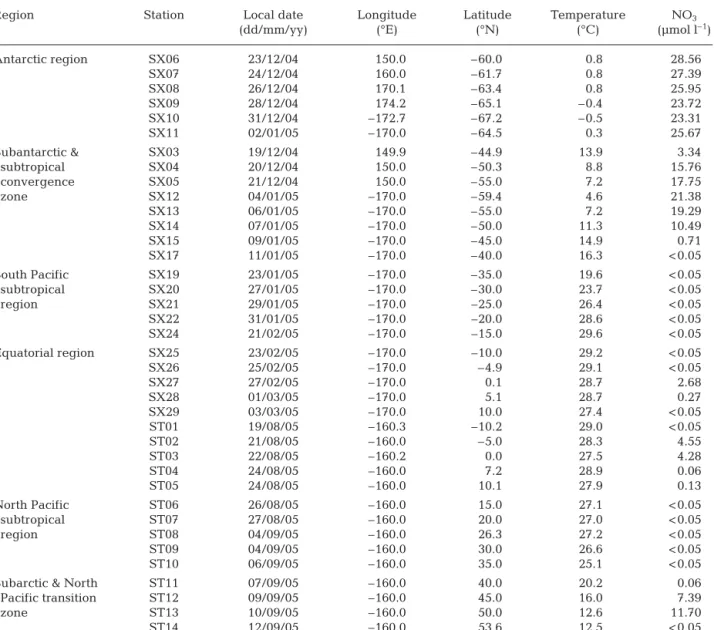
Event counts 0 50 100 150 200 250
B
SSC 100 100 101 102 103 104 101 102 103 104 FL1 100 101 102 103 104 FL1A
Fig. 6. Example of (A) a density plot (side scatter [SSC] on the x-axis and green fluorescence intensity [FL1] on the y-axis in log units) and (B) a histogram of viral subclusters discriminated by the difference of the fluorescence intensity (sample collected at a depth of 50 m at Stn ST13 during cruise KH05-2). HV/MV/LV: viral subcluster with high/medium/low fluorescence intensity;
butions of the HV subcluster to total viral abundance (%HV) were high (up to 18.6%) in the subtropical and tropical regions, whereas they were low (1.0–6.0%) in the Antarctic region (Fig. 5B). Relative contributions of the MV and LV subclusters were 28.5 ± 7.1% and 64.7 ± 9.4%, respectively (mean ± SD, n = 386).
Relationships between viral and environmental variables
We used a DISTLM approach to determine a set of predictor variables that best explains viral abundance variability for the whole data collected in the present study. Among the environmental variables examined
(temperature, depth, chl a concentration, bacterial
abundance, bacterial production, Synechococcus
abun-dance, Prochlorococcus abundance, and picoeukaryote
abundance; all the variables except for temperature and depth were log-transformed), the best combination
of variables was Synechococcus, picoeukrayote,
Pro-chlorococcus abundances, and bacterial production
(Table 2). The linear combination of these variables col-lectively accounted for 58.1% of variations in viral
abun-dance. Among these variables, Synechococcus
abun-dance accounted for the largest fraction (r2= 0.435) of
viral abundance variability, followed by picoeukaryote
abundance (r2 = 0.105), Prochlorococcus abundance
(r2= 0.030), and bacterial production (r2= 0.011). The
3 APP groups together explained 57.0% of viral abun-dance variability. The tolerance value calculated for each predictor variable was high (0.463 to 0.809), indi-cating that the multi-collinearity problem was minimal. The result of Model II regression analysis is presented in
Response variable Selected variables Pseudo-F p r2 Coefficient Tolerance
Viral abundance Synechococcus abundance 271.22 0.001 0.435 0.062 0.596
Picoeukaryote abundance 79.91 0.001 0.105 0.088 0.539
Prochlorococcus abundance 24.41 0.001 0.030 0.019 0.809
Bacterial production 9.55 0.004 0.011 0.057 0.463
(0.581)a
Viral subcluster Synechococcus abundance 186.71 0.001 0.347 2.500 0.596
composition Picoeukaryote abundance 47.68 0.001 0.078 2.905 0.539
Prochlorococcus abundance 21.30 0.001 0.033 0.838 0.809
Bacterial production 11.47 0.001 0.017 2.723 0.463
(0.475)a aSum of r2
Table 2. Distance-based linear model (DISTLM) results of the best set of environmental variables that account for variations in viral variables for the whole data (n = 354). Viral variables include viral abundance (log transformed) and viral subcluster compo-sition (abundances of individual subclusters). Pseudo-F and p values were obtained by permutations (n = 999). As the basis of analyses, Euclidean distances and Bray-Curtis similarities were used for viral abundance and viral subcluster composition, respectively. Coefficient is for a linear combination of predictor variables in the formation of the distance-based redundancy
analysis (dbRDA) coordinate (Axis 1)
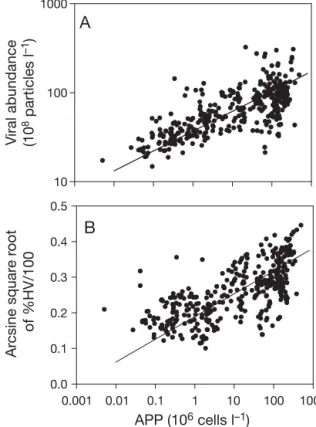
APP (106 cells l–1) 0.001 0.01 0.1 1 10 100 1000 Ar csine squar e r oot of %HV/100 0.0 0.1 0.2 0.3 0.4 0.5 V iral abundance (10 8 particles l –1) 10 100 1000
A
B
Fig. 7. Relationships between photoautotrophic picoplankton (APP) abundance and (A) viral abundance and (B) relative contributions of the viral subcluster with high fluorescence intensity to total viral abundance (%HV). Viral abundance and APP abundance were log transformed, whereas %HV was arcsine square root transformed to reduce skewness (Sokal & Rohlf 1995). Model II regression equations are as follows (± SE): log (viral abundance) = 1.807 (± 0.012) + 0.223 (± 0.008) × log (APP abundance), adjusted r2= 0.527, p < 0.001,
n = 381; Arcsine square root (% HV/100) = 0.189 (± 0.004) + 0.065 (± 0.002) × log (APP abundance), adjusted r2= 0.462,
Fig. 7A, indicating a strong positive relationship be-tween viral abundance and total APP abundance.
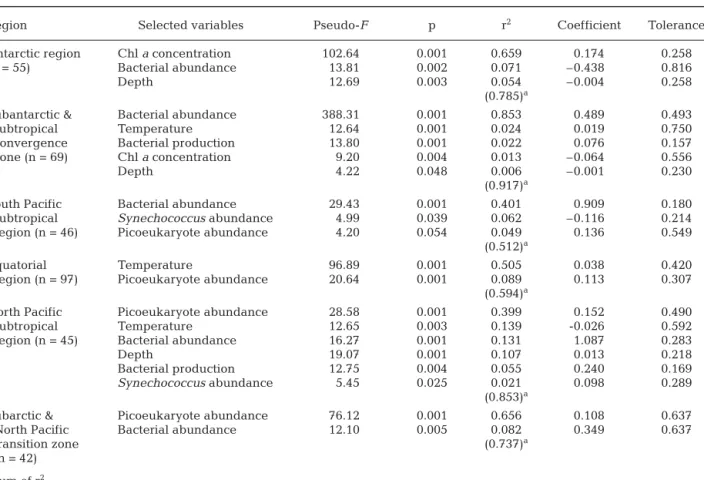
The relationship between viral abundance and envi-ronmental variables differed among different oceanic regions (Table 3). For the subset of data obtained in the
Antarctic region, chl a concentrations accounted for a
substantial fraction of variations in viral abundance (r2
= 0.659, n = 55, p < 0.001), whereas the contribution of
bacterial abundance was moderate (r2= 0.071). In
con-trast, bacterial abundance was the best predictor of viral abundance in the subantarctic/convergence zone
(r2 = 0.853, n = 69, p < 0.001). Chl a concentration
explained only 1% of variation in viral abundance in this region. For other regions, the strongest predictor variables included bacterial abundance in the South
Pacific subtropical gyre (r2= 0.401, n = 46, p < 0.001),
temperature in the equatorial zone (r2= 0.505, n = 97, p
< 0.001), and the abundance of picoeukaryotes in the
subtropical gyre of the North Pacific (r2= 0.399, n = 45,
p < 0.001) and the subarctic gyre (r2= 0.656, n = 42, p <
0.001).
The DISTLM routines were also used to examine the relationship between viral subcluster composition and environmental variables using the Bray-Curtis similarity as a basis of the analysis. Four variables (Synechococcus abundance, picoeukaryote
abun-dance, Prochlorococcus abundance, and bacterial
production) were selected as the best set of predictor
variables (overall r2 = 0.475; tolerance values, 0.463
to 0.809; Table 2). The sum of the r2’s for the 3
groups of APP was 0.458, suggesting that APP abun-dance accounted for a large fraction of the variability in viral subcluster compositions. In order to examine the mode of the change in the viral subcluster com-position along the gradient of APP abundance, rela-tionships between the relative abundances of indi-vidual subclusters of viruses (%HV, %MV, and %LV) and total APP abundance were examined on the basis of the Model II regression. The results indi-cated that %HV was significantly positively related
to APP abundance (r2 = 0.462; p < 0.001, n = 381;
Fig. 7B). The relationships between the relative
Region Selected variables Pseudo-F p r2 Coefficient Tolerance
Antarctic region Chl a concentration 102.64 0.001 0.659 0.174 0.258
(n = 55) Bacterial abundance 13.81 0.002 0.071 –0.438 0.816
Depth 12.69 0.003 0.054 –0.004 0.258
(0.785)a
Subantarctic & Bacterial abundance 388.31 0.001 0.853 0.489 0.493
subtropical Temperature 12.64 0.001 0.024 0.019 0.750
convergence Bacterial production 13.80 0.001 0.022 0.076 0.157
zone (n = 69) Chl a concentration 9.20 0.004 0.013 –0.064 0.556
Depth 4.22 0.048 0.006 –0.001 0.230
(0.917)a
South Pacific Bacterial abundance 29.43 0.001 0.401 0.909 0.180
subtropical Synechococcus abundance 4.99 0.039 0.062 –0.116 0.214
region (n = 46) Picoeukaryote abundance 4.20 0.054 0.049 0.136 0.549
(0.512)a
Equatorial Temperature 96.89 0.001 0.505 0.038 0.420
region (n = 97) Picoeukaryote abundance 20.64 0.001 0.089 0.113 0.307 (0.594)a
North Pacific Picoeukaryote abundance 28.58 0.001 0.399 0.152 0.490
subtropical Temperature 12.65 0.003 0.139 -0.026 0.592
region (n = 45) Bacterial abundance 16.27 0.001 0.131 1.087 0.283
Depth 19.07 0.001 0.107 0.013 0.218
Bacterial production 12.75 0.004 0.055 0.240 0.169
Synechococcus abundance 5.45 0.025 0.021 0.098 0.289 (0.853)a
Subarctic & Picoeukaryote abundance 76.12 0.001 0.656 0.108 0.637
North Pacific Bacterial abundance 12.10 0.005 0.082 0.349 0.637
transition zone (0.737)a
(n = 42)
aSum of r2
Table 3. Distance Based Linear Model (DISTLM) results of the best set of environmental variables that account for variations in viral abundance for individual oceanic regions (n = number of samples). Prochlorococcus and Synechococcus were not used as environmental variables for the Antarctic region because these microbes were not detected. Pseudo-F and p values were ob-tained by permutations (n = 999). Euclidean distances were used as the basis of the analyses. Coefficient is for a linear
abundances of other subclusters and APP abundance
were weak (r2= 0.039 and 0.173 for %MV and %LV,
respectively).
Subsurface viral peak in the mid-latitude regions of the North Pacific
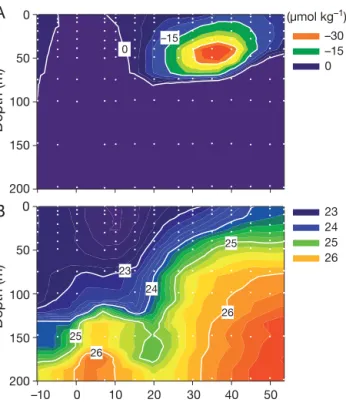
The subsurface viral peak found in the mid-latitude regions of the North Pacific did not coincide with the maxima of biotic variables studied (Figs. 2 & 4). How-ever, this viral peak coincided with the dissolved oxy-gen anomaly (the excess above saturation) indicated
by negative values (–15 to –59 µmol kg–1) of apparent
oxygen utilization (AOU; Fig. 8A). Both peaks have a
center near the σθ= 24.5 to 25.5 isopycnal (σθis the
potential density in kg m– 3– 1000) with a maximum
thickness of about 50 m, shoaling north along isopyc-nal surfaces below the pycnocline (Fig. 8B). For the
data collected in the upper layer (≤100 m) between
25° and 45° N, viral abundance was negatively corre-lated with AOU (Pearson’s r = 0.69, p < 0.0001, n = 40). Among the 3 viral subclusters, the correlation with AOU was strongest for the abundance of the MV subcluster (r = 0.73, p < 0.0001) followed by the LV subcluster (r = 0.64, p < 0.0001), whereas it was relatively weak (r = 0.52, p < 0.0005) for the HV sub-cluster.
DISCUSSION
Despite the increasing recognition that viruses are important components in marine ecosystems, the data on viral distributions and production in open oceans are still limited (Weinbauer 2004, Motegi & Nagata 2007). In addition, cross-system comparisons of viral distributions using data reported in the literature are compromised because of the large variations in viral counts among studies using different methods (Brus-saard 2004, Wen et al. 2004). In fact, the compilation of the available data on viral abundance in open oceans hardly reveals patterns in distributions across different oceanographic regions. Our results collected across various oceanic regions (including polar, subpolar, subtropical, and tropical oceans) revealed novel fea-tures regarding large-scale viral distributions in the upper oceans.
Viral distributions and their relationships with environmental variables
Over the broad scale, the abundances of the 3 groups of APP were the best predictor of viral abundance, accounting for 57% of the variability. The positive rela-tionship between viral abundance and the APP abun-dances may partly reflect vertical distribution patterns of these variables. However, our results obtained using DISTLM indicated that depth does not add signifi-cantly to the ability of the model to explain viral abun-dance variability. Thus, the positive relationship between viral and APP abundances should reflect regional variations. Indeed, viruses tended to be more abundant in lower latitude regions where total APP abundances were high, while viruses tended to be less abundant in the Antarctic region where total APP abundances were low. High abundances of viruses in subtropical and tropical regions might be partly accounted for by high abundances of cyanophages infecting APP (Mann 2003). Recent studies have revealed that these viruses carry many functional genes of the host, which allow them to effectively pro-liferate in oligotrophic oceanic environments (Mann et al. 2003, 2005, Sullivan et al. 2006, Williamson et al. 2008). Metagenomic analysis on phage sequences in fosmid clone libraries also indicated that cyanophages may be numerically dominant in the euphotic zone of the subtropical North Pacific with 60 to 80% of total intracellular (0.22 to 1.6 µm) virus sequences (which appeared to originate from replicating viruses within infected hosts) described as cyanophage-like (DeLong et al. 2006). The above information suggests that cyanophages might be an important component of viral communities especially in subtropical and
tropi-26 25 25 24 23 26 23 24 25 26 (µmol kg–1) –30 –15 0 0 –15 Depth (m) 0 50 100 150 Depth (m) 0 50 100 150 200 200 Latitude (°N) 10 20 30 40 50 –10 0
A
B
Fig. 8. Spatial variations of (A) apparent oxygen utilization (AOU) and (B) σθalong the 160° W meridional transect. (σθis
cal oceans where cyanobacteria can account for a sig-nificant fraction (10 to 30%) of total prokaryote abun-dance (Campbell et al. 1994). However, it should be stressed that the data on turnover of host and viral communities in open oceans are scarce (Baudoux et al. 2007), suggesting a need for future studies that exam-ine the magnitude of viral lytic pressures on APP com-munities in diverse oceanic systems.
We found that relationships between viral abun-dance and biotic variables differed among regions, which indicates that controls of virus–host systems are largely distinct among different oceanic habitats. The strong positive relationship between bacterial and viral abundance that we found in the subantarctic/sub-tropical convergence zone is consistent with the results of previous studies conducted in subarctic regions (Steward et al. 1996). A close coupling between lytic viruses and bacteria in the subantarctic region (48° S; the Atlantic sector of the Southern Ocean) was sug-gested by Weinbauer et al. (2009), who found that per-centages of bacteria infected by viruses were high (21 to 40%) especially in the Fe-fertilized patch. The above data corroborate the proposition that bacteria are the major host of viral communities in subpolar
regions. In contrast, chl a concentration was a strong
predictor of viral abundance in the Antarctic region where APP abundances were low. This result might indicate that viruses infecting larger phytoplankton were prominent in this oceanic region at the time of our sampling. Consistent with our results, Brussaard et al. (2008) noted that viral abundance in natural Fe-fer-tilized waters southeast of the Kerguelen Islands (south of the Polar Front) was more variable than bacterial abundance and displayed a higher positive correlation
with chl a (r = 0.587) than bacterial abundance (r =
0.240). It is likely that interactions between viruses and hosts dynamically change in response to changes in environmental conditions in subpolar and polar oceans where variations over seasons and across the regions in host community structures, primary productivity, and light and nutrient regimes are large.
Viral subclusters
Viral subclusters with different fluorescence intensi-ties reflect differences in the viral genome size (Bau-doux & Brussaard 2005), although other factors (e.g. accessibility of dyes to nucleic acids) may also affect fluorescence intensities (Brussaard 2004). Each viral subcluster may consist of multiple taxonomic groups of viruses with different hosts, i.e. viruses with different genome size can infect the same species of host, while viruses with the same genome size can infect a diverse range of hosts (e.g. Mann 2003, Baudoux & Brussaard
2005). Nonetheless, field studies have found that dis-tinct viral subclusters tend to display different dynam-ics (Larsen et al. 2008) and distributions (Brussaard et al. 2008), suggesting that they broadly represent viral subpopulations with different hosts (Marie et al. 1999, Suttle 2007, Brussaard et al. 2008, Larsen et al. 2008). Based on the observations that HV subclusters covary with algal abundance (Marie et al. 1999, Larsen et al. 2008), these viruses have been generally suggested to contain cyanophages and algal viruses (Brussaard et al. 2008). Few data are available about viral subclus-ters distinguished by flow cytometry in open ocean environments, and our data are among the first to doc-ument a large-scale pattern in distributions of HV viruses across different oceanic regions.
We found that the distribution of %HV was consis-tent with that of APP, as indicated by a significant pos-itive relationship between %HV and total APP abun-dance. Our results showing low %HV values in the Antarctic region are consistent with the data of Brus-saard et al. (2008), who reported that %HV was low (generally < 6%) at stations south of the Polar Front, although the authors did not compare these values with those in lower latitude regions. Obviously, statis-tical relationships alone cannot prove the existence of the link between specific hosts and viral subclusters. Nonetheless, our results are consistent with the hypothesis that HV viruses include many viruses infecting APP especially in tropical and subtropical waters (Brussaard et al. 2008). Further studies are required to examine taxonomic compositions of viruses belonging to different subclusters with the use of mol-ecular analyses of viral genes (Breitbart et al. 2002, Breitbart & Rohwer 2005, Williamson et al. 2008).
Viral ‘hot spot’ in mid-latitudes of the North Pacific A striking feature that we found in the North Pacific is a pronounced peak of viruses associated with a dis-solved oxygen anomaly. The development of a subsur-face oxygen anomaly between spring and late summer is a prominent feature in mid-latitude regions of the North Pacific (Shulenberger & Reid 1981, Jenkins & Goldman 1985, Najjar & Keeling 1997). The oxygen anomaly reflects the accumulation of net photosyn-thetic production (new production) of oxygen between spring and late summer within a zone below the mixed layer and above the compensation depth, where venti-lation of oxygen into the air is impeded due to stratifi-cation. The subsurface anomaly is a seasonal phenom-enon that disappears with the deepening of the mixed layer in the fall season. The level of the anomaly (AOU
= –15 to –59 µmol kg–1) at the time of our investigation
observed in this region (Shulenberger & Reid 1981). Note that the oxygen anomaly in a subsurface layer does not necessarily imply high primary production in that layer (Shulenberger & Reid 1981). In fact, our data showed that the layer of oxygen anomaly did not
coin-cide with peaks of phototrophs (i.e. chl a concentration,
APP abundance) and heterotrophs (i.e. bacterial dance and production). Therefore, high viral abun-dance associated with the oxygen anomaly cannot be simply explained by the spatial distributions of poten-tial hosts.
We hypothesize that combined effects of physical processes and host distributions account for the coinci-dence of high viral abundance and the oxygen anom-aly. As mentioned above, oxygen gas in the layer of the anomaly does not ventilate because it is isolated from the mixed layer. This suggests that viruses in the oxy-gen anomaly layer are also isolated from the mixed layer where UV radiation destroys viruses. High impacts of UV radiation on viral survival and distribu-tion in the mixed layer of the oceanic water column have been documented by several studies (e.g. Wein-bauer 2004). Murray & Jackson (1993) developed a model to examine the interaction of UV radiation and mixing processes on virus survival in upper waters. They concluded that viruses not subject to mixing (as would be the case for viruses in the oxygen anomaly layer) have much lower mortality rates than those in the mixed layer. Thus, the zone of oxygen anomaly could be a ‘refuge’ for viruses where they escape from UV-induced destruction and encounter more abundant hosts compared to those available for viruses in the layer below the compensation depth. It is intriguing to speculate that viral communities differ in compositions between the surface mixed layer and the subsurface zone of oxygen anomaly. Our data on viral subcluster compositions partly support this notion, since AOU was more strongly correlated with the abundance of the MV subcluster than with the abundances of other subclusters. Clarifying how different communities of viruses regulate bacterial and algal communities in distinct zones of the euphotic layer is crucial for a bet-ter understanding of oceanic ecosystem functioning, given the huge physical dimension and large contribu-tions to global biogeochemical cycles of the transi-tional and subtropical regions of the North Pacific.
CONCLUSIONS
Our results revealed that the abundances of APP,
including Prochlorococcus, Synechococcus, and
pico-eukaryotes, are major factors explaining variations in viral abundance and subcluster composition over a large scale. The data also provided evidence in
sup-port of the notion that the HV subcluster might contain large amounts of viruses infecting APP, a possibility that should be investigated using molecular analyses of viral genes affiliated with different viral subclusters. We also found that the relationships between viral abundance and biotic variables are distinct among dif-ferent oceanographic regions, especially in polar and subpolar regions, noting that viruses respond dynami-cally to changes in host community structures and environmental conditions in these regions. The occur-rence of a ‘viral hot spot’ in the zone of a subsurface oxygen anomaly in the North Pacific has led us to hypothesize that there are 2 distinctive habitats (i.e. mixed layer and ‘viral refuge’) for viruses to proliferate in the euphotic layer with a seasonal pycnocline. In short, our data demonstrate that combined effects of host distributions, mixing, and UV radiation generate outstanding geographic patterns in viral distributions in the upper oceans, suggesting a need for future stud-ies on geographic variability in viral taxonomic compo-sitions, their functional attributes, and viral-mediated biogeochemical cycles in oceanic ecosystems.
Acknowledgements. This study was supported by the Dynamics of the Ocean Biosystems project (Grant-in-Aid for Creative Basic Research 12NP0201 from the Ministry of Edu-cation, Culture, Sports, Science, and Technology–Japan). Financial support was also provided by Japan Society for the Promotion of Science (JSPS) grants (17201004, 20310010, 22651004) and the 21stCentury Centers of Excellence
Pro-gram of Kyoto University. Y.Y. was supported by the JSPS Postdoctoral Fellowship for Foreign Researchers. We thank captains, officers, and crews of RV ‘Hakuho-maru’ for logistic support during the cruises. C. Brussaard provided helpful information regarding flow cytometric counting of viruses.
LITERATURE CITED
Anderson MJ, Gorley RN, Clarke KR (2008) PERMANOVA+ for PRIMER: guide to software and statistical methods. PRIMER-E, Plymouth
Baudoux AC, Brussaard CPD (2005) Characterization of dif-ferent viruses infecting the marine harmful algal bloom species Phaeocystis globosa. Virology 341:80–90 Baudoux AC, Veldhuis MJW, Witte HJ, Brussaard CPD (2007)
Viruses as mortality agents of picophytoplankton in the deep chlorophyll maximum layer during IRONAGES III. Limnol Oceanogr 52:2519–2529
Breitbart M, Rohwer F (2005) Here a virus, there a virus, everywhere the same virus? Trends Microbiol 13:278–284 Breitbart M, Salamon P, Andresen B, Mahaffy JM, Segall AM,
Mead D, Azam F, Rohwer F (2002) Genomic analysis of uncultured marine viral communities. Proc Natl Acad Sci USA 99:14250–14255
Breitbart M, Middelboe M, Rohwer F (2008) Marine viruses: community dynamics, diversity and impact on microbial processes. In: Kirchman DL (ed) Microbial ecology of the oceans, 2nd edn. Wiley-Blackwell, Hoboken, NJ, p 443–479
Brussaard CPD (2004) Optimization of procedures for count-ing viruses by flow cytometry. Appl Environ Microbiol 70: 1506–1513
➤
➤
➤
➤
➤
➤
➤
➤
Brussaard CPD, Timmermans KR, Uitz J, Veldhuis MJW (2008) Virioplankton dynamics and virally induced phyto-plankton lysis versus microzoophyto-plankton grazing southeast of the Kerguelen (Southern Ocean). Deep-Sea Res II 55: 752–765
Campbell L (2001) Flow cytometric analysis of autotrophic picoplankton. In: Paul JH (ed) Methods in microbiology, Vol 30. Academic Press, San Diego, CA, p 317–343 Campbell L, Nolla HA, Vaulot D (1994) The importance of
Prochlorococcus to community structure in the central North Pacific Ocean. Limnol Oceanogr 39:954–961 Culley AI, Welschmeyer NA (2002) The abundance,
distribu-tion, and correlation of viruses, phytoplankton, and prokaryotes along a Pacific Ocean transect. Limnol Oceanogr 47:1508–1513
De Paepe M, Taddei F (2006) Viruses’ life history: towards a mechanistic basis of a trade-off between survival and reproduction among phages. PLoS Biol 4:e193 doi:10. 1371/journal.pbio.0040193
DeLong EF, Preston CM, Mincer T, Rich V and others (2006) Community genomics among stratified microbial assem-blages in the ocean’s interior. Science 311:496–503 Fuhrman JA (1999) Marine viruses and their biogeochemical
and ecological effects. Nature 399:541–548
Gonzalez JM, Suttle CA (1993) Grazing by marine nanofla-gellates on viruses and virus-sized particles: ingestion and digestion. Mar Ecol Prog Ser 94:1–10
Heldal M, Bratbak G (1991) Production and decay of viruses in aquatic environments. Mar Ecol Prog Ser 72:205–212 Jenkins WJ, Goldman JC (1985) Seasonal oxygen cycling and
primary production in the Sargasso Sea. J Mar Res 43: 465–491
Kirchman D (2001) Measuring bacterial biomass production and growth rates from leucine incorporation in natural aquatic environments. In: Paul JH (ed) Methods in microbiology, Vol 30. Academic Press, San Diego, CA, p 227–237
Larsen JB, Larsen A, Thyrhaug R, Bratbak G, Sandaa RA (2008) Response of marine viral populations to a nutrient induced phytoplankton bloom at different pCO2 levels.
Biogeosciences 5:523–533
Li WKW, Dickie PM (2001) Monitoring phytoplankton, bacte-rioplankton, and virioplankton in a coastal inlet (Bedford Basin) by flow cytometry. Cytometry 44:236–246 Longhurst A (2006) Ecological geography of the sea, 2nd edn.
Academic Press, San Diego, CA
Mann NH (2003) Phages of the marine cyanobacterial pico-phytoplankton. FEMS Microbiol Rev 27:17–34
Mann NH, Cook A, Millard A, Bailey S, Clokie M (2003) Bacterial photosynthesis genes in a virus. Nature 424:741 Mann NH, Clokie MRJ, Millard A, Cook A, Wilson WH,
Wheat-ley PJ, Letarov A, Krisch HM (2005) The genome of S-PM2, a “photosynthetic” T4-type bacteriophage that infects marine Synechococcus strains. J Bacteriol 187:3188–3200 Marie D, Brussaard CPD, Thyrhaug R, Bratbak G, Vaulot D
(1999) Enumeration of marine viruses in culture and nat-ural samples by flow cytometry. Appl Environ Microbiol 65:45–52
Motegi C, Nagata T (2007) Enhancement of viral production
by addition of nitrogen or nitrogen plus carbon in subtrop-ical surface waters of the South Pacific. Aquat Microb Ecol 48:27–34
Motegi C, Nagata T (2009) Addition of monomeric and poly-meric organic substrates alleviates viral lytic pressure on bacterial communities in coastal seawaters. Aquat Microb Ecol 57:343–350
Motegi C, Nagata T, Miki T, Weinbauer MG, Legendre L, Rassoulzadegan F (2009) Viral control of bacterial growth efficiency in marine pelagic environments. Limnol Oceanogr 54:1901–1910
Murray AG, Jackson GA (1993) Viral dynamics II: a model of the interaction of ultraviolet light and mixing processes on virus survival in seawater. Mar Ecol Prog Ser 102:105–114 Najjar RG, Keeling RF (1997) Analysis of the mean annual
cycle of the dissolved oxygen anomaly in the World Ocean. J Mar Res 55:117–151
Noble RT, Fuhrman JA (1997) Virus decay and its causes in coastal waters. Appl Environ Microbiol 63:77–83
Proctor LM, Fuhrman JA (1991) Roles of viral infection in organic particulate flux. Mar Ecol Prog Ser 69:133–142 Quinn GP, Keough MJ (2002) Experimental design and data
analysis for biologists. Cambridge University Press, Cam-bridge
Shulenberger E, Reid JL (1981) The Pacific shallow oxygen maximum, deep chlorophyll maximum, and primary pro-ductivity, reconsidered. Deep-Sea Res A Oceanogr Res Pap 28:901–919
Sokal RR, Rohlf FJ (1995) Biometry: the principles and prac-tices of statistics in biological research, 3rd edn. Freeman, New York, NY
Steward GF, Smith DC, Azam F (1996) Abundance and pro-duction of bacteria and viruses in the Bering and Chukchi Seas. Mar Ecol Prog Ser 131:287–300
Sullivan MB, Lindell D, Lee JA, Thompson LR, Bielawski JP, Chisholm SW (2006) Prevalence and evolution of core photosystem II genes in marine cyanobacterial viruses and their hosts. PLoS Biol 4:e234 doi:10.1371/journal.pbio. 0040234
Suttle CA (2007) Marine viruses—major players in the global ecosystem. Nat Rev Microbiol 5:801–812
Suttle CA, Chen F (1992) Mechanisms and rates of decay of marine viruses in seawater. Appl Environ Microbiol 58: 3721–3729
Weinbauer MG (2004) Ecology of prokaryotic viruses. FEMS Microbiol Rev 28:127–181
Weinbauer MG, Arrieta JM, Griebler C, Herndl GJ (2009) Enhanced viral production and infection of bacterioplank-ton during an iron-induced phytoplankbacterioplank-ton bloom in the Southern Ocean. Limnol Oceanogr 54:774–784
Wen K, Ortmann AC, Suttle CA (2004) Accurate estimation of viral abundance by epifluorescence microscopy. Appl Environ Microbiol 70:3862–3867
Williamson SJ, Rusch DB, Yooseph S, Halpern AL and others (2008) The Sorcerer II global ocean sampling expedition: metagenomic characterization of viruses within aquatic microbial samples. PLoS ONE 3:e1456 doi:10.1371/jour-nal.pone.0001456
Editorial responsibility: Curtis Suttle, Vancouver, Canada
Submitted: September 14, 2009; Accepted: May 18, 2010 Proofs received from author(s): June 28, 2010


![Fig. 6. Example of (A) a density plot (side scatter [SSC] on the x-axis and green fluorescence intensity [FL1] on the y-axis in log units) and (B) a histogram of viral subclusters discriminated by the difference of the fluorescence intensity (sample collec](https://thumb-eu.123doks.com/thumbv2/123doknet/14786042.598858/9.918.133.779.672.949/fluorescence-intensity-histogram-subclusters-discriminated-difference-fluorescence-intensity.webp)