HAL Id: hal-00297725
https://hal.archives-ouvertes.fr/hal-00297725
Submitted on 20 Jan 2005HAL is a multi-disciplinary open access
archive for the deposit and dissemination of sci-entific research documents, whether they are pub-lished or not. The documents may come from teaching and research institutions in France or abroad, or from public or private research centers.
L’archive ouverte pluridisciplinaire HAL, est destinée au dépôt et à la diffusion de documents scientifiques de niveau recherche, publiés ou non, émanant des établissements d’enseignement et de recherche français ou étrangers, des laboratoires publics ou privés.
Greenhouse gas emissions from Indian rice fields:
calibration and upscaling using the DNDC model
H. Pathak, C. Li, R. Wassmann
To cite this version:
H. Pathak, C. Li, R. Wassmann. Greenhouse gas emissions from Indian rice fields: calibration and upscaling using the DNDC model. Biogeosciences Discussions, European Geosciences Union, 2005, 2 (1), pp.77-102. �hal-00297725�
BGD
2, 77–102, 2005
Greenhouse gas emissions from Indian rice fields
H. Pathak et al. Title Page Abstract Introduction Conclusions References Tables Figures J I J I Back Close
Full Screen / Esc
Print Version Interactive Discussion EGU Biogeosciences Discussions, 2, 77–102, 2005 www.biogeosciences.net/bgd/2/77/ SRef-ID: 1810-6285/bgd/2005-2-77 European Geosciences Union
Biogeosciences Discussions
Biogeosciences Discussions is the access reviewed discussion forum of Biogeosciences
Greenhouse gas emissions from Indian
rice fields: calibration and upscaling
using the DNDC model
H. Pathak1,3, C. Li2, and R. Wassmann3
1
Unit of Simulation and Informatics, Indian Agricultural Research Institute, New Delhi, India
2
Institute for the Study of Earth, Oceans, and Space, University of New Hampshire, Durham, New Hampshire, USA
3
Institute for Meteorology and Climate Research (IMK-IFU), Forschungszentrum Karlsruhe, Garmisch-Partenkirchen, Germany
Received: 1 December 2004 – Accepted: 12 January 2005 – Published: 20 January 2005 Correspondence to: H. Pathak (hpathak [email protected])
BGD
2, 77–102, 2005
Greenhouse gas emissions from Indian rice fields
H. Pathak et al. Title Page Abstract Introduction Conclusions References Tables Figures J I J I Back Close
Full Screen / Esc
Print Version
Interactive Discussion
EGU Abstract
Crop growth simulation models provide a means to quantify the effects of climate, soil and management on crop growth and biogeochemical processes in soil. The Deni-trification and Decomposition (DNDC) model was evaluated for its ability to simulate methane (CH4), nitrous oxide (N2O) and carbon dioxide (CO2) emissions from Indian 5
rice fields with various management practices. The model was calibrated and vali-dated for field experiments in New Delhi, India. The observed yield, N uptake and greenhouse gas (GHG) emissions were in good agreement with the values predicted by the model. The model was then applied for estimation of GHG emissions from rice fields in India using a newly compiled soil/climate/land use database. Continuous 10
flooding of rice fields (42.25 million ha) resulted in annual net emissions of 1.07–1.10, 0.038–0.048 and 21.16–60.96 Tg of CH4-C, N2O-N and CO2-C, respectively, with a cumulated global warming potential (GWP) of 130.93–272.83 Tg CO2 equivalent. In-termittent flooding of rice fields reduced annual net emissions to 0.12–0.13 Tg CH4-C and 16.66–48.80 Tg CO2-C while N2O emission increased to 0.056–0.060 Tg N2O-N. 15
The GWP, however, reduced to 91.73–211.80 Tg CO2equivalent. The study suggests that the model can be applied for studying the GHG related issues in rice cropping systems of India.
1. Introduction
The production of rice in South Asia, including India, has increased markedly with the 20
introduction and widespread adoption of modern crop production technologies such as early maturing and N responsive semi-dwarf cultivars; high use of inorganic fertilizers, especially N fertilizers, and pesticides; and the expansion of irrigation facilities. Most of the rice in monsoonal Asia is grown as a transplanted crop in wet season from July to October (known as kharif season in India), where fields are flooded before planting 25
BGD
2, 77–102, 2005
Greenhouse gas emissions from Indian rice fields
H. Pathak et al. Title Page Abstract Introduction Conclusions References Tables Figures J I J I Back Close
Full Screen / Esc
Print Version
Interactive Discussion
EGU
and the extremely limited O2supply in the soil-floodwater system has a large influence on the soil nutrient dynamics of irrigated rice systems.
Carbon dioxide (CO2), methane (CH4) and nitrous oxide (N2O) are the important greenhouse gases (GHG) contributing 60, 15 and 5%, respectively, towards enhanced global warming (Watson et al., 1996). Concentrations of these gases are increasing 5
at 0.4, 3.0 and 0.22% per year, respectively (Battle et al., 1996). Apart from causing global warming N2O is also responsible for the destruction of the stratospheric ozone (Rodhe, 1990). Quantification of GHG emission from soil is needed for global modelling studies in the context of ecosystem modification and climate change (Li et al., 1997). Global and regional estimates of GHG emission from rice paddy fields vary greatly with 10
the assumptions made on the importance of different factors affecting the emissions. Only a few studies (Bachelet and Neue, 1993; Mathews et al., 2000a, b; Li et al., 2004) have attempted to calculate detailed regional GHG emissions.
Several models have been developed in recent years to predict emissions of CH4and N2O from agricultural fields. Early models used regression relationships between rates 15
of emissions and either the crop biomass (Kern et al., 1997) or grain yield (Anastasi et al., 1992). These relationships were based on the assumption that higher the biomass production of the crop, the more substrate would be available for CH4production, either from increased crop residues or from higher rates of rhizo-deposition. Cao et al. (1995) presented a more differentiated approach describing CH4production and oxidation in 20
rice fields. In this model, soil organic carbon (SOC) was assumed to be partitioned be-tween three main pools based on their rates of decomposition. The seasonal pattern of redox potential (Eh) was required as an input in the model. Huang et al. (1998) used two pools in their model to represent soil organic matter, with different potential decom-position rates for each; these were modified by multipliers representing the influence 25
of soil texture and temperature. As with the Cao et al. (1995) model, CH4 production was affected directly by soil Eh, although this was simulated rather than used as a model input. Lu et al. (2000) developed a model for CH4 production derived from in-cubation studies. Matthews et al. (2000a, b) developed MERES (Methane Emission in
BGD
2, 77–102, 2005
Greenhouse gas emissions from Indian rice fields
H. Pathak et al. Title Page Abstract Introduction Conclusions References Tables Figures J I J I Back Close
Full Screen / Esc
Print Version
Interactive Discussion
EGU
Rice EcoSystems) model for simulating CH4emissions from rice fields. The model was based on CERES-Rice model but did not cover N2O or CO2emissions. Other models, however, include the entire set of GHG, for example, CENTURY (Parton, 1996), DNDC (Li, 2000) and InfoCrop (Aggarwal et al., 2004), but are not yet at a stage where their predictive ability is satisfactory. Moreover, the models have hardly been used in tropi-5
cal regions. The objectives of the present study were to evaluate the DNDC model for its ability to simulate (1) GHG emissions and global warming potential (GWP) of rice fields with different management practices and (2) GHG emissions from the various rice-growing regions of India.
2. Materials and methods
10
2.1. Description of the DNDC model
The Denitrification-Decomposition (DNDC) model (Li, 2000) is a generic model of C and N biogeochemistry in agricultural ecosystems. The model simulates C and N cycling in agro-ecosystems at a daily or sub daily time step. It consists of six interacting submodels: soil climate, plant growth, decomposition, nitrification, denitrification and 15
fermentation (Li et al., 1997). In DNDC, SOC resides in four major pools: plant residue (i.e., litter), microbial biomass, humads (or active humus), and passive humus. Each pool consists of two or three sub-pools with different specific decomposition rates. The soil climate submodel simulates soil temperature and moisture profiles based on soil physical properties, daily weather and plant water use. The plant growth submodel 20
calculates daily water and N uptake by vegetation, root respiration, and plant growth and partitioning of biomass into grain, stalk and roots. The decomposition submodel simulates daily decomposition, nitrification, ammonia volatilization and CO2production by soil microbes. The submodel calculates turnover rates of soil organic matter at a daily time step (Li et al., 1994). The nitrification submodel tracks growth of nitrifiers and 25
BGD
2, 77–102, 2005
Greenhouse gas emissions from Indian rice fields
H. Pathak et al. Title Page Abstract Introduction Conclusions References Tables Figures J I J I Back Close
Full Screen / Esc
Print Version
Interactive Discussion
EGU
time step to simulate denitrification and the production of nitric oxide (NO), N2O, and dinitrogen (N2). The fermentation submodel simulates CH4 production and oxidation under anaerobic conditions. The DNDC model has been widely used over the last 10 years by many researchers (Brown et al., 2002; Butterbach-Bahl et al., 2004; Cai et al., 2003; Li et al., 1997, 2000, 2004; Smith et al., 2002, 2004). Simulated results showed 5
that DNDC was able to simulate the basic patterns of NO, N2O, CH4 and NH3 fluxes simultaneously (Li, 2000). This feature could be valuable in assessing the net effect of the changing climate or alternative agricultural management on either the atmosphere or agriculture.
Recently the DNDC model has been modified for predicting GHG emissions from 10
paddy rice ecosystems (Li et al., 2004). The majority of the modifications focused on simulations of anaerobic biogeochemistry and rice growth as well as parameterization of paddy rice management. The modified model was tested for its sensitivities to man-agement alternatives and variations in natural conditions including weather and soil properties. When estimating GHG emissions under specific management conditions 15
at regional scale, the spatial heterogeneity of soil properties (e.g., texture, SOC con-tent, pH) are the major sources of uncertainty. An approach, the most sensitive factor (MSF) method, was developed for DNDC to reduce the magnitude of uncertainty (Li et al., 2004). The modified DNDC model was used for estimating emissions of CO2, CH4, and N2O from all of the rice paddies in China with two different water management 20
practices, i.e., continuous flooding and midseason drainage that were the dominant practices before 1980 and in 2000, respectively (Li et al., 2004). In the present study this modified model was further refined to simulate emissions of CO2, CH4, and N2O under the conditions found in rice paddies of India.
2.2. Model modification 25
Modifications were made for the DNDC model to improve its performance in simulat-ing crop yield and CH4 emissions for Indian rice fields. Most of the crop physiological and phenological parameters set in the DNDC model were originally calibrated against
BGD
2, 77–102, 2005
Greenhouse gas emissions from Indian rice fields
H. Pathak et al. Title Page Abstract Introduction Conclusions References Tables Figures J I J I Back Close
Full Screen / Esc
Print Version
Interactive Discussion
EGU
datasets observed in the U.S., China or other temperate regions. Discrepancies ap-peared when the model was applied for the rice crops in India. Modifications were made with the accumulative thermal degree-days as well as the growth rates of vege-tative and reproductive stages to adjust the rice-growing season. These modifications have improved the model’s capacity for predicting crop yields in India.
5
Low CH4 fluxes were measured in some rice paddies in India (Pathak et al., 2003), which were not adequately captured by the model originally. Test runs for the sites where the low CH4 fluxes were not captured by DNDC indicated that these sites had relatively high leaking rates. The leaking processes embedded in the model were modified to let the process lead to not only water but also substrates e.g., dissolved 10
organic carbon (DOC) and nitrate loss from the paddy soils. This modification has substantially decreased CH4emissions from the sites with high leaking rates. A graphic interface was built in the DNDC model to browse the regional database as well as to map the modeled results e.g., crop yield, C sequestration, CH4or N2O emissions for India.
15
2.3. Model calibration
Two field experiments were used for the calibration of the model (Pathak et al., 2002, 2003). The experiments were done at the experimental farm of the Indian Agricultural Research Institute, New Delhi, India. The site is located at 28◦400N and 77◦120E, subtropical, semi-arid, with annual rainfall of 750 mm. The mean maximum and mini-20
mum temperatures from July to October (rice season) are 35 and 18◦C, and 22.6 and 6.7◦C from November to April (wheat season). The alluvial soil of experimental site was sandy loam in texture and has organic carbon, total N, Olsen P, and ammonium acetate extractable K contents of 4.5 g kg−1, 0.30 g kg−1, 0.007 g kg−1, and 0.13 g kg−1, respectively. The soils are well drained with the groundwater table at 6.6 and 10 m 25
deep during the rainy and summer seasons, respectively.
The experiments included treatments varying in N sources and water management in plots of 6 m long and 5 m wide. Three, 30 days old rice seedlings (cultivar Pusa
BGD
2, 77–102, 2005
Greenhouse gas emissions from Indian rice fields
H. Pathak et al. Title Page Abstract Introduction Conclusions References Tables Figures J I J I Back Close
Full Screen / Esc
Print Version
Interactive Discussion
EGU
44) were transplanted at 20 cm (row to row) by 15 cm (hill to hill) spacing on 15 July 1999. Emissions of CH4and N2O were measured frequently from the plots following the standard methodologies (Pathak et al., 2002, 2003). Total dry matter, grain yield and N uptake were measured at maturity.
The genetic coefficients for rice cultivar, used as model inputs to describe crop phe-5
nology in response to temperature and photoperiod, were estimated from indepen-dent treatments with water and N non-limiting by adjusting the coefficients until close matches were achieved between simulated and observed phenology and yield. Total thermal time requirement for rice cultivar found to be 2250◦C. Rate constants of crop development in vegetative and reproductive stages were 0.015 per day and 0.044 per 10
day.
2.4. Sensitivity analyses
Sensitivity of the model to the changes in amount of N fertilizer and irrigation applica-tions on rice yield and GHG emissions was analysed using the baseline data (weather, soil, cultivar, location and other inputs) of year 1999 of the experiment.
15
2.5. Global warming potential
Global warming potential (GWP) is an index defined as the cumulative radiative forcing between the present and some chosen later time ‘horizon’ caused by a unit mass of gas emitted now. It is used to compare the effectiveness of each greenhouse gas to trap heat in the atmosphere relative to some standard gas, by convention CO2. The GWP 20
for CH4 (based on a 100-year time horizon) is 21, while that for N2O, it is 310 when GWP value for CO2 is taken as 1. The GWP of different treatments were calculated using the following equation (Watson et al., 1996).
BGD
2, 77–102, 2005
Greenhouse gas emissions from Indian rice fields
H. Pathak et al. Title Page Abstract Introduction Conclusions References Tables Figures J I J I Back Close
Full Screen / Esc
Print Version
Interactive Discussion
EGU
2.6. Upscaling GHG emissions from rice growing areas in India
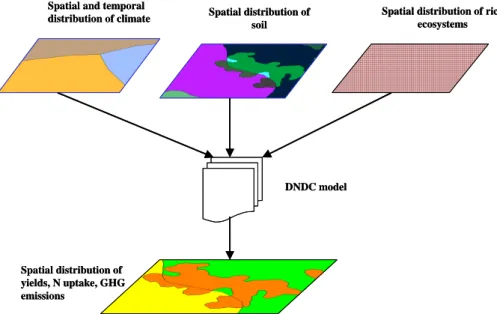
The approach for the upscaling GHG emissions using the DNDC model and geograph-ical information system (GIS) are depicted in Fig. 1. The required input parameters of the DNDC model consisting of daily meteorological data (maximum and minimum temperatures, precipitation and solar radiation), soil properties (SOC, clay contents, 5
pH and bulk density) and field area under different rice ecosystems (irrigated lowland, rainfed lowland, rainfed upland and deepwater) were compiled in a GIS database. India is divided into several states and the states are further divided into different administra-tive boundaries called districts. Since many of the statistical data were district-based, district was chosen as the basic geographic unit of the database to maintain the max-10
imum accuracy of the original data sets. The meteorological data was obtained from National Climatic Data Center, USA and consisted of daily records of more than 110 cli-matic stations across India. Soil properties were compiled from NBSS and LUP (1998), Velayutham and Bhattacharya (2000) and Kalra (personal communication, 2004). Field area under the four major rice ecosystems (irrigated lowland, rainfed lowland, rainfed 15
upland and deepwater) in the different districts of the country was compiled from pub-lished data (FAI, 2000; FAO, 2000; Yadav and Subba Rao, 2001; Bhatia et al., 2004). For irrigated lowland and rainfed lowland rice systems simulation was done for two irri-gation practices: 1) continuous flooding and 2) intermittently flooding during the crop-ping season. In both the cases 120 kg N ha−1 per season was applied through urea, 20
broadcast at 3 splits (12at 1 DAT,14 at 30 DAT and 14at 55 DAT). In case of rainfed upland system no irrigation was applied and the fields were never flooded while for deepwa-ter rice system fields were kept continuously submerged with wadeepwa-ter. For the latdeepwa-ter two systems 64 kg N ha−1 was applied through urea, broadcast at 2 equal splits at 1 and 30 DAT, respectively as per the practice commonly followed by the farmers. For all the 25
systems field was ploughed 3 times with moldboard plough before rice transplanting. The model calculated annual CO2, CH4, and N2O fluxes from each rice ecosystem for two scenarios: (1) minimum emission and (2) maximum emission. The scenario
BGD
2, 77–102, 2005
Greenhouse gas emissions from Indian rice fields
H. Pathak et al. Title Page Abstract Introduction Conclusions References Tables Figures J I J I Back Close
Full Screen / Esc
Print Version
Interactive Discussion
EGU
for minimum emission includes the minimum values of SOC, pH and bulk density and the maximum value of clay content of soil while the scenario for maximum emission includes the maximum values of SOC, pH and bulk density and the minimum value of clay content of soil.
3. Results and discussion
5
3.1. Evaluation of the model
Predicted grain and biomass yields and N uptake agreed well with observed values (Table 1). The observed emission of CH4during the growing season was 28 kg C ha−1, while the simulated emission was 27 kg ha−1. Emission of N2O was 0.74 kg N2O-N ha−1 while the simulated value was 0.69 kg N2O-N ha−1. In all the cases the deviation of the 10
simulated value from the observed value was less than 5% except in case of N2O emission when the deviation was 6.8% (Table 1).
3.2. Sensitivity analysis for impacts of N and water management on yield, N uptake and GHG emission
Different levels of N significantly influenced the simulated yield, N uptake and emissions 15
of GHG from soil (Table 2). Grain yield of rice as well as N uptake increased with appli-cation rate up to 300 kg N ha−1, but with smaller increases at rates above 180 kg ha−1. Emissions of CO2 and CH4 increased considerably from 0 to 120 kg N ha−1 because of more shoot and root growths of rice with N application producing more amounts of root exudates and larger amounts of root debris, which supplied C as substrate het-20
erotrophic microbes for resulting in larger CO2and CH4emissions. Further increase in N levels i.e., from 180 to 300 kg N ha−1had little influence on the emissions because of their limited additional influence over 120 kg N ha−1 on rice growth. Emission of N2O, however, remained unchanged up to 180 kg N ha−1. As the fields were continuously
BGD
2, 77–102, 2005
Greenhouse gas emissions from Indian rice fields
H. Pathak et al. Title Page Abstract Introduction Conclusions References Tables Figures J I J I Back Close
Full Screen / Esc
Print Version
Interactive Discussion
EGU
flooded keeping them anaerobic throughout the growing period, the process of nitrifi-cation producing NO−3 from NH+4 was stopped, and as a result denitrification was also inhibited because of non-availability of substrate (NO−3) for this process. These two processes i.e., nitrification and denitrification are mainly responsible for the formation of N2O in soil (Duxbury et al., 1982). However, application of more than 180 kg N ha−1 5
through urea increased N2O emission because larger fluxes of NH+4-N.
Substituting 60 kg ha−1chemical N with farmyard manure (FYM) reduced grain yield and N uptake by rice but increased GHG emissions as compared to application of 120 kg N ha−1through urea alone. Addition of organic C through FYM was responsible for such increase in the GHG emissions (Adhya et al., 2000; Pathak et al., 2002). 10
Water management also influenced the simulated yield, N uptake and emissions of GHG from soil (Table 2). Treatments with continuously flooding gave higher yield, N uptake, and CH4 and CO2 emissions compared to midseason drainage treatments. Emission of CH4 reduced by 31% and 54% with 1 and 2 midseason drainages of 10 days each compared to that under continuously flooded soil. Nitrous oxide emission, 15
on the other hand increased marginally with midseason drainage, which resulted in aerobic condition of soil with enhanced nitrification forming N2O and NO−3-N. It also enhanced denitrification by supplying the substrate (NO−3) for the denitrifiers resulting in more N2O emission when the field was reflooded (Aulakh et al., 1992).
The CH4 emission values simulated in this study are similar to that reported by Jain 20
et al. (2000) and Adhya et al. (2000) for Indian rice fields. However, emission was smaller compared to that reported from many other countries such as Philippines (Cor-ton et al., 2000) and Japan (Yagi et al., 1996). Lower CH4 emission from Indian rice paddies compared to that of other countries are due to 1) lower soil organic C status, 2) high percolation rate of sandy loam soils, which allows to leach substantial amount 25
of dissolved organic C (DOC) to lower soil profiles, 3) lower yield of rice with smaller rhizo-deposition and 4) limited amount of organic residue recycling in soil.
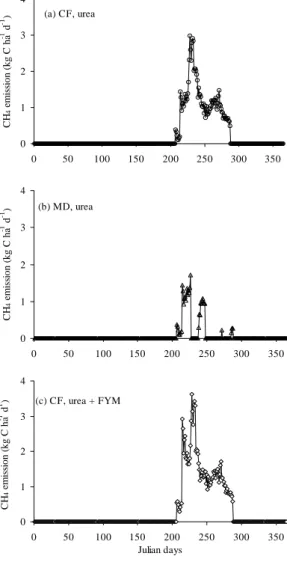
Daily emission pattern of CH4 revealed that emission was recorded only during the period of flooding (Fig. 2). Flux of CH4varied between 0 to 3.62 kg C ha−1day−1.
Con-BGD
2, 77–102, 2005
Greenhouse gas emissions from Indian rice fields
H. Pathak et al. Title Page Abstract Introduction Conclusions References Tables Figures J I J I Back Close
Full Screen / Esc
Print Version
Interactive Discussion
EGU
tinuous flooding emitted more CH4 than the midseason drainage and application of FYM enhanced the emission.
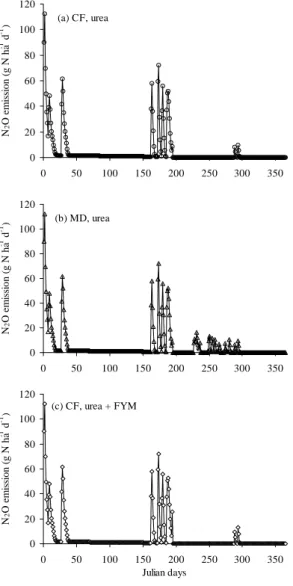
Annual emission of N2O showed that there were several peaks of fluxes (Fig. 3). Emission of N2O-N ranged from 0 to 112.3 g ha−1day−1 during the year. Initial high peak of N2O emission was due to nitrification of ammonium-N present in soil. Subse-5
quent peaks corresponded to the rainfall and flooding events, which resulted in denitri-fication of soil NO3.
3.3. Upscaling of GHG emission from Indian rice fields 3.3.1. Database of soil and rice ecosystems
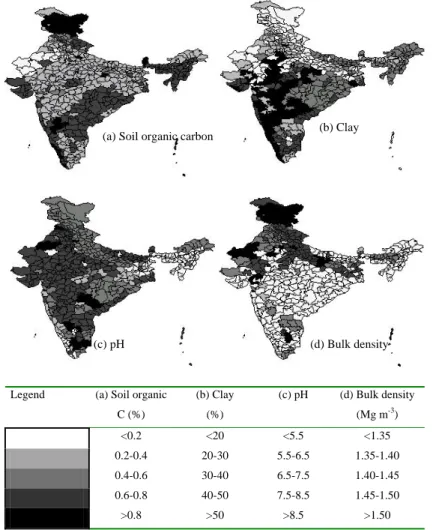
The spatial distribution of SOC, clay contents, pH and bulk density of soils in different 10
rice growing regions of India at the district scale are presented in Fig. 4. Being in the tropical region, the SOC contents of soil is low varying from <0.2% to 1%, with majority of soils containing SOC<0.6% (Fig. 4a). Clay contents of soil varied between 10 to 67%. The soils of north India are lighter in texture while those of central and west India are heavier in texture (Fig. 4b). Majority of soils in India are alkaline in pH (pH>7.5) with 15
soils in eastern India are acidic to neutral in reaction (Fig. 4c). The soils of north India have higher bulk density as compared to those from the rest of the country (Fig. 4d).
There are mainly four major rice ecosystems in India (1) irrigated lowland, (2) rainfed lowland, (3) rainfed upland and (4) deepwater covering an area of 42.25 M ha (Table 3). Half of the area (21.41 M ha) is under irrigated lowland and 14.45 M ha is under rainfed 20
lowland rice ecosystems. Upland rice is grown in 4.2 M ha of land while deepwater rice occupies an area of 2.22 M ha. In lowland ecosystems rice seedlings are transplanted in puddled condition and the fields are kept either in continuous submergence or inter-mittently flooded depending on soil texture, rainfall and availability of irrigation water. Lowland rice fields in north India are generally intermittently flooded while those from 25
east and south India are flooded continuously. In case of upland rice the seeds are directly sown on pulverized seedbed and fields are never flooded. Deepwater rice is
BGD
2, 77–102, 2005
Greenhouse gas emissions from Indian rice fields
H. Pathak et al. Title Page Abstract Introduction Conclusions References Tables Figures J I J I Back Close
Full Screen / Esc
Print Version
Interactive Discussion
EGU
grown in low-lying high rainfall areas, where fields are inundated with water. In these areas rice is either direct seeded or transplanted depending upon the onset of mon-soon.
3.3.2. Emission of GHG
The modeled results indicated that total CH4flux from the simulated 42.25 million ha 5
of rice in India ranged from 1.07 to 1.10 Tg C per year under continuous flooding condi-tions (Table 4). With the intermittent flooding scenario, the national CH4 flux from rice fields reduced to 0.12–0.13 Tg C per year implying that the water management change in India drastically reduced CH4 fluxes. Intermittent flooding approach has been ap-plied in many Asian countries such as India (Jain et al., 2000; Adhya et al., 2000), 10
Philippines (Corton et al., 2000), China (Li et al., 2002), and Japan (Yagi et al., 1996) to reduce CH4emissions.
With continuous flooding N2O emission ranged from 0.038 to 0.048 Tg N per year (Table 4). Shifting the water management from continuous flooding to intermittent flood-ing increased N2O fluxes to 0.056–0.060 Tg N yr−1. But like CH4emission, emission of 15
CO2 reduced with intermittent flooding. The upscaling study for India, thus, revealed the complexity of GHG mitigation. When CH4and CO2 emissions were reduced due to intermittent flooding, N2O emission increased. Since N2O possesses higher GWP, the increased N2O offset the benefit gained by decreasing CH4and CO2fluxes. How-ever, total GWP of rice growing areas decreased from 130.93–272.83 Tg CO2yr−1with 20
continuous flooding to 91.73–211.80 Tg CO2yr−1with intermittent flooding.
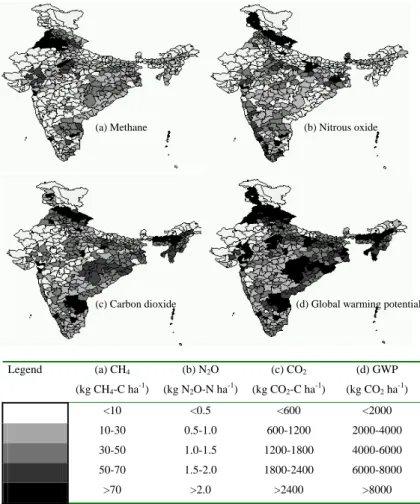
The simulated spatial distribution of GHG emissions from Indian rice fields and their GWP under continuous flooding condition is shown in Fig. 5. Emission of CH4 ranged from <10 kg CH4-C ha−1 to >70 kg CH4-C ha−1 (Fig. 5a). The maximum emission value was 106 kg CH4-C ha−1. High emission values in some of the districts in north-25
west India could be due to high temperature (>40◦C) in the region during the rice growing season. Regions in the eastern India also showed higher emission because
BGD
2, 77–102, 2005
Greenhouse gas emissions from Indian rice fields
H. Pathak et al. Title Page Abstract Introduction Conclusions References Tables Figures J I J I Back Close
Full Screen / Esc
Print Version
Interactive Discussion
EGU
of high temperature and high SOC content compared to those from western part of the country.
Emission of N2O from the various rice ecosystems of India ranged from <0.5 g N2 O-N ha−1 to >2.0 g N2O-N ha−1 (Fig. 5b) while emission of CO2 varied between <600 to >2400 kg CO2-C ha−1 (Fig. 5c) under continuous flooding condition. Unlike CH4, 5
emissions of N2O were higher from the south-western regions of the country while the regions in the eastern and south eastern India showed higher CO2emission, similar to that of CH4because of high temperature and high SOC content in these regions. The northern, eastern and southern parts of the country showed higher GWP (Fig. 5d), mainly because of higher CH4 and CO2 emissions. The GWP of the rice growing 10
regions through out the country was <2000 to >8000 kg CO2equivalent per year.
4. Conclusions
The DNDC model was generally able to encapsulate the major impacts of water and N on rice crop performance and GHG emissions in tropical soils. The analysis suggested that the model can be applied for studying the GHG related issues in rice cropping 15
systems of India. A trade-off between CH4and CO2emissions and N2O emission was observed. The conflict between the CH4, CO2and N2O mitigation measures demon-strated the challenge of mitigating GHG emissions through managing biogeochemical cycles in terrestrial ecosystems. Therefore, new tools for land-use analysis and plan-ning are needed to reconcile the legitimate aims of improving water and N management 20
and reducing GHG emission from agricultural fields. Models such as DNDC would be very useful to accelerate the application of available knowledge at field, farm and re-gional levels for optimizing agronomic management, quantifying changes in SOC and GHG emissions with changing land use, and developing mitigation options for GHG emissions.
25
BGD
2, 77–102, 2005
Greenhouse gas emissions from Indian rice fields
H. Pathak et al. Title Page Abstract Introduction Conclusions References Tables Figures J I J I Back Close
Full Screen / Esc
Print Version
Interactive Discussion
EGU
Germany for providing a fellowship and the Forschungszentrum Karlsruhe, Institut f ¨ur Meteo-rologie und Klimaforschung (IMK-IFU), Garmisch-Partenkirchen, Germany for providing facili-ties to carry out the work. C. Li’s study was supported by NASA Terrestrial Ecology Program through project NAG5-12838.
References
5
Adhya, T. K., Bharati, K., Mohanty, S. R., Ramakrishnan, B., Rao, V. R., Sethunathan, N., and Wassmann, R.: Methane emission from rice fields at Cuttack, India, Nutr. Cycl. Agroecosyst., 58, 95–105, 2000.
Aggarwal, P. K., Kalra, N., Chander, S., and Pathak, H.: InfoCrop: A Generic Simulation Model For Annual Crops in Tropical Environments, Indian Agricultural Research Institute, 10
New Delhi, 132, 2004.
Anastasi, C., Dowding, M., and Simpson, V. J.: Future CH4 emission from rice production, J. Geophys. Res., 97, 7521–7525, 1992.
Aulakh, M. S., Doran, J. W., and Mosier, A. R.: Soil denitrification – significance, measurement, and effects of management, Adv. Soil Sci., 18, 2–42, 1992.
15
Bachelet, D. and Neue, H. U.: Methane emissions from wetland rice areas of Asia, Chemo-sphere, 26, 219–237, 1993.
Battle, M., Bender, M., Sowers, T., Tans, P. P., Butler, J. H., Elkins, J. W., Ellis, J. T., Conway, T., Zhang, N., Lang, P., and Clarke, A. D.: Atmospheric gas concentrations over the past century measured in air from fin at the south pole, Nature, 383, 231–235, 1996.
20
Bhatia, A., Pathak, H., and Aggarwal, P. K.: Inventory of methane and nitrous oxide emissions from agricultural soils of India and their global warming potential, Curr. Sci., 87(3), 317–324, 2004.
Brown, L., Syed, B., Jarvis, S. C., Sneath, R. W., Phillips, V. R., Goulding, K. W. T., and Li, C.: Development and application of a mechanistic model to estimate emission of nitrous oxide 25
from UK agriculture, Atmos. Environ., 36, 917–928, 2002.
Butterbach-Bahl, K., Kesik, M., Miehle, P., Papen, H., and Li, C.: Quantifying the regional source strength of N-trace gases across agricultural and forest ecosystems with process based models, Plant Soil, 260, 311–329, 2004.
Cai, Z., Sawamoto, T., Li, C., Kang, G., Boonjawat, J., Mosier, A., Wassmann, R., and Tsuruta, 30
BGD
2, 77–102, 2005
Greenhouse gas emissions from Indian rice fields
H. Pathak et al. Title Page Abstract Introduction Conclusions References Tables Figures J I J I Back Close
Full Screen / Esc
Print Version
Interactive Discussion
EGU
H.: Field validation of the DNDC model for greenhouse gas emissions in East Asian cropping systems, Global Biogeochem. Cycles, 17(4), 1107, doi:10.1029/2003GB002046, 2003. Cao, M., Dent, J. B., and Heal, O. W.: Modelling methane emissions from rice paddies, Global
Biogeochem. Cycles, 9, 183–195, 1995.
Corton, T. M., Bajita, J. B., Grospe, F. S., Pamplona, R. R., Asis Jr., C. A., Wassmann, R., 5
Lantin, R. S., and Buendia, L. V.: Methane emission from irrigated and intensively managed rice fields in Central Luzon (Philippines), Nutr. Cycl. Agroecosyst., 58, 37–53, 2000.
Duxbury, J. M., Bouldin, D. R., Terry, R. E., and Tate III., R. L.: Emissions of nitrous oxide from soils, Nature, 275, 602–604, 1982.
FAI (Fertilizer Association of India): Fertilizer Statistics (2000–2001), New Delhi, India, 2000. 10
FAO (Food and Agricultural Organization): FAO agricultural database (http://www.fao.org), FAO, Rome, Italy, 2000.
Huang, Y., Sass, R. L., and Fisher Jr., F. M.: A semi-empirical model of methane emission from flooded rice paddy soils, Global Change Biol., 4(3), 247–268, 1998.
Jain, M. C., Kumar, S., Wassmann, R., Mitra, S., Singh, S. D., Singh, J. P., Singh, R., Yadav, A. 15
K., and Gupta, S.: Methane emissions from irrigated rice fields in northern India (New Delhi), Nutr. Cycl. Agroecosyst., 58, 75–83, 2000.
Kern, J. S., Gong, Z., Zhang, G., Zhuo, H., and Luo, G.: Spatial analysis of methane emissions from paddy soils in China and the potential for emissions reduction, Nutr. Cycl. Agroecosyst., 49, 181–195, 1997.
20
Li, C.: Modeling trace gas emissions from agricultural ecosystems, Nutr. Cycl. Agroecosyst., 58, 259–276, 2000.
Li, C., Frolking, S., and Harriss, R. C.: Modeling carbon biogeochemistry in agricultural soils, Global Biogeochem. Cycles, 8, 237–254, 1994.
Li, C., Frolking, S., Crocker, G. J., Grace, P. R., Klir, J., Korcdhens, M., and Poulton, P. R.: 25
Simulating trends in soil organic carbon in long-term experiments using the DNDC model, Geoderma, 81, 45–60, 1997.
Li, C., Qiu, J., Frolking, S., Xiao, X., Salas, W., Moore III, B., Boles, S., Huang, Y., and Sass, R.: Reduced methane emissions from large-scale changes in water management in China’s rice paddies during 1980–2000, Geophys. Res. Lett., 29(20), doi:10.1029/2002GL015370, 30
2002.
Li, C., Mosier, A., Wassmann, R., Cai, Z., Zheng, X., Huang, Y., Tsuruta, H., Boonjawat, J., and Lantin, R.: Modeling greenhouse gas emissions from rice-based production systems:
BGD
2, 77–102, 2005
Greenhouse gas emissions from Indian rice fields
H. Pathak et al. Title Page Abstract Introduction Conclusions References Tables Figures J I J I Back Close
Full Screen / Esc
Print Version
Interactive Discussion
EGU
Sensitivity and upscaling, Global Biogeochem. Cycles, 18, 1–19, 2004.
Lu, W. F., Chen, W., Duan, B. W., Guo, W. M., Lu, Y., Lantin, R. S., Wassmann, R., and Neue, H. U.: Methane emission and mitigation options in irrigated rice fields in southeast China, Nutr. Cycling Agroecosys., 58, 65–73, 2000.
Matthews, R. B., Wassmann, R., and Arah, J.: Using a crop/soil simulation model and GIS 5
techniques to assess methane emsissions from rice fields in Asia, I. Model development, Nutr. Cycling Agroecosyst., 58, 141–159, 2000a.
Matthews, R. B., Wassmann, R., Buendia, L. V., and Knox, J.: Using a crop/soil simulation model and GIS techniques to assess methane emissions from rice fields in Asia, II. Model validation and sensitivity analysis, Nutr. Cycling Agroecosyst., 58, 141–158, 2000b.
10
NBSS and LUP: Benchmark Soils of India, National Bureau of Soil Survey and Land Use Planning, Nagpur, India, 398, 1998.
Parton, W. J.: The CENTURY model, in: Evaluation of soil organic matter models using existing long-term datasets, edited by: Powlson, D. S., Smith, P., and Smith, J. U., NATO ASI Series I, 38, 283–293, 1996.
15
Pathak, H., Bhatia, A., Shiv Prasad, Singh, S., Kumar, S., Jain, M. C., and Kumar, U.: Emission of nitrous oxide from soil in rice-wheat systems of Indo-Gangetic plains of India, Environ. Monitoring Assessment, 77(2), 163–178, 2002.
Pathak, H., Prasad, S., Bhatia, A., Singh, S., Kumar, S., Singh, J., and Jain, M. C.: Methane emission from rice-wheat cropping system of India in relation to irrigation, farmyard manure 20
and dicyandiamide application, Agric. Ecosys. Environ., 97, 309–316, 2003.
Rodhe, A. L.: A comparison of the contribution of various gases to the greenhouse effect, Science, 248, 1217–1219, 1990.
Smith, W. N., Desjardins, R. L., Grant, B., Li, C., Lemke, R., Rochette, P., Corre, M. D., and Pennock, D.: Testing the DNDC model using N2O emissions at two experimental sites in 25
Canada, Canada J. Soil Sci., 82, 365–374, 2002.
Smith, W. N., Grant, B., Desjardins, R. L., Lemke, R., and Li, C.: Estimates of the interannual variations of N2O emissions from agricultural soils in Canada, Nutr. Cycling Agroecosyst., 68, 37–45, 2004.
Velayutham, M. and Bhattacharya, T.: Soil Resource Management, In: Natural Resource man-30
agement for agricultural production in India, International conference on managing natural resources for sustainable agricultural production in the 21st century, 14–18 February 2000, New Delhi, India, 2000.
BGD
2, 77–102, 2005
Greenhouse gas emissions from Indian rice fields
H. Pathak et al. Title Page Abstract Introduction Conclusions References Tables Figures J I J I Back Close
Full Screen / Esc
Print Version
Interactive Discussion
EGU
Watson, R. T., Zinyowera, M. C., Moss, R. H., and Dokken, D. J.: Climate Change 1995, impacts, adaptations and mitigation of climate change: Scientific-technical analyses, Inter-governmental Panel on Climate Change, Cambridge University Press, USA, 879, 1996. Yadav, R. L. and Subba Rao, A. V. M.: Atlas of Cropping Systems in India, PDCSR Bulletin
No. 2001-02, p. 96, Project Directorate for Cropping Systems Research, Modipuram, Meerut 5
250 110, India, 2001.
Yagi, K., Tsuruta, H., Kanda, K., and Manami, K.: Effect of water management on methane emission from a Japanese rice field: Automated methane monitoring, Global Biogeochem. Cycles, 10, 255–267, 1996.
BGD
2, 77–102, 2005
Greenhouse gas emissions from Indian rice fields
H. Pathak et al. Title Page Abstract Introduction Conclusions References Tables Figures J I J I Back Close
Full Screen / Esc
Print Version
Interactive Discussion
EGU
Table 1. Observed and simulated records on harvested yield and biomass as well as N uptake and GHG emission from rice fields in Northern India applied with 120 kg urea N ha−1.
Parameters Observed Simulated Deviation
(kg ha−1) (kg ha−1) (%)
Grain yield (kg ha−1) 6800 6815 0.2
Total biomass (kg ha−1) 17 436 17 718 1.6
Crop N uptake (kg N ha−1) 126 128 1.6
Seasonal CH4emission (kg CH4-C ha−1) 28 27 3.6 Seasonal N2O emission (kg N2O-N ha−1) 0.74 0.69 6.8
BGD
2, 77–102, 2005
Greenhouse gas emissions from Indian rice fields
H. Pathak et al. Title Page Abstract Introduction Conclusions References Tables Figures J I J I Back Close
Full Screen / Esc
Print Version
Interactive Discussion
EGU
Table 2. Sensitivity analysis for different rates of N application, water regimes and manure application affecting simulated rice yields, N uptake and annual GHG emissions.
Urea N Water regimea Grain yield N uptake CO2emission CH4emission N2O emission (kg ha−1) (kg N ha−1) (kg C ha−1) (kg C ha−1) (kg N ha−1) 0 CF 1775 33 712 40 1.85 60 CF 4798 90 741 81 1.85 120 CF 7320 137 760 96 1.85 180 CF 9015 169 771 101 1.85 240 CF 10 015 188 774 103 1.89 300 CF 10 868 204 768 103 2.12 60 (+60)b CF 6633 124 1665 120 1.88 120 1MD 7210 135 690 66 1.93 120 2MD 7075 133 617 42 1.96 a
CF= continuous flooding; 1MD and 2MD = 1 and 2 midseason drainages, respectively
b
BGD
2, 77–102, 2005
Greenhouse gas emissions from Indian rice fields
H. Pathak et al. Title Page Abstract Introduction Conclusions References Tables Figures J I J I Back Close
Full Screen / Esc
Print Version
Interactive Discussion
EGU
Table 3. Areas under the various rice ecosystems in different states of India.
State Area (million ha)
Irrigated lowland Rainfed lowland Rainfed upland Deepwater Total
Andhra Pradesh 3.45 0.07 3.52 Arunachal Pradesh 0.04 0.08 0.12 Assam 0.53 1.60 0.22 0.10 2.45 Bihar 1.93 1.59 0.53 0.67 4.72 Goa 0.01 0.09 0.10 Gujarat 0.40 0.22 0.62 Haryana 0.79 0.79 Himachal Pradesh 0.05 0.03 0.08
Jammu and Kashmir 0.25 0.02 0.27
Karnataka 0.87 0.04 0.39 1.30 Kerala 0.27 0.08 0.15 0.50 Maharashtra 0.42 0.79 0.32 1.53 Manipur 0.08 0.09 0.17 Meghalaya 0.05 0.06 0.11 Mizoram 0.01 0.06 0.07 Madhya Pradesh 1.23 3.82 5.05 Nagaland 0.06 0.07 0.13 Orissa 1.61 2.00 0.69 0.15 4.45 Pondicherry 0.03 0.03 Punjab 2.24 0.03 2.27 Rajasthan 0.05 0.11 0.16 Sikkim 0.02 0.02 Tamil Nadu 2.06 0.27 2.33 Tripura 0.05 0.21 0.26 Uttar Pradesh 3.37 1.33 0.50 0.23 5.43 West Bengal 1.53 2.68 0.88 0.68 5.77 Total 21.41 14.45 4.20 2.22 42.25
BGD
2, 77–102, 2005
Greenhouse gas emissions from Indian rice fields
H. Pathak et al. Title Page Abstract Introduction Conclusions References Tables Figures J I J I Back Close
Full Screen / Esc
Print Version
Interactive Discussion
EGU
Table 4. Annual GHG emissions from Indian rice fields under continuous flooding and midsea-son drainage practices.
Parameter Continuous flooding Midseason drainage
a
Minimum bMaximum Minimum Maximum
CH4emission (Tg C yr−1) 1.07 1.10 0.12 0.13
N2O emission (Tg N yr−1) 0.048 0.038 0.060 0.056 CO2emission (Tg C yr−1) 21.16 60.96 16.66 48.80 GWP (Tg CO2equiv. yr−1) 130.93 272.83 91.73 211.80
a
Scenarios for minimum emission: Minimum of SOC, pH and bulk density and maximum of clay content of soil.
b
Scenarios for maximum emission: Maximum of SOC, pH and bulk density and minimum of clay content of soil.
BGD
2, 77–102, 2005
Greenhouse gas emissions from Indian rice fields
H. Pathak et al. Title Page Abstract Introduction Conclusions References Tables Figures J I J I Back Close
Full Screen / Esc
Print Version
Interactive Discussion
EGU
ig. 1. Approaches for the upscaling of greenhouse gas emission from rice fields in Spatial and temporal
distribution of climate Spatial distribution of soil
DNDC model
Spatial distribution of rice ecosystems
Spatial distribution of yields, N uptake, GHG emissions
Spatial and temporal
distribution of climate Spatial distribution of soil
DNDC model
Spatial distribution of rice ecosystems
Spatial distribution of yields, N uptake, GHG emissions
F
India using the DNDC model.
Fig. 1. Approaches for the upscaling of greenhouse gas emission from rice fields in India using the DNDC model.
BGD
2, 77–102, 2005
Greenhouse gas emissions from Indian rice fields
H. Pathak et al. Title Page Abstract Introduction Conclusions References Tables Figures J I J I Back Close
Full Screen / Esc
Print Version Interactive Discussion EGU (a) CF, urea 0 1 2 3 4 0 50 100 150 200 250 300 350 CH 4 e m is si on ( k g C ha -1 d -1) (b) MD, urea 0 1 2 3 4 0 50 100 150 200 250 300 350 CH 4 e m is si on ( kg C ha -1 d -1) (c) CF, urea + FYM 0 1 2 3 4 0 50 100 150 200 250 300 350 Julian days CH 4 e m is si on ( kg C ha -1 d 1)
Fig. 2. Effect of continuous flooding (CF), midseason drainage (MD) and farmyard
manure (FYM) on simulated methane emission.
Fig. 2. Effect of continu-ous flooding (CF), midseason drainage (MD) and farmyard manure (FYM) on simulated methane emission.
BGD
2, 77–102, 2005
Greenhouse gas emissions from Indian rice fields
H. Pathak et al. Title Page Abstract Introduction Conclusions References Tables Figures J I J I Back Close
Full Screen / Esc
Print Version Interactive Discussion EGU (a) CF, urea 0 20 40 60 80 100 120 0 50 100 150 200 250 300 350 N 2 O e m is si o n ( g N h a -1 d -1 ) (b) MD, urea 0 20 40 60 80 100 120 0 50 100 150 200 250 300 350 N 2 O em is si on ( g N ha -1 d -1 ) (c) CF, urea + FYM 0 20 40 60 80 100 120 0 50 100 150 200 250 300 350 Julian days N 2 O e m is si o n ( g N h a -1 d -1 )
Fig. 3. Effect of continuous flooding (CF), midseason drainage (MD) and farmyard
manure (FYM) on simulated nitrous oxide emission.
Fig. 3. Effect of continu-ous flooding (CF), midseason drainage (MD) and farmyard manure (FYM) on simulated ni-trous oxide emission.
BGD
2, 77–102, 2005
Greenhouse gas emissions from Indian rice fields
H. Pathak et al. Title Page Abstract Introduction Conclusions References Tables Figures J I J I Back Close
Full Screen / Esc
Print Version
Interactive Discussion
EGU Fig. 4. Spatial distribution of organic carbon, clay contents, pH and bulk density of
soils of India. Legends of the figures are given below.
(b) Clay (a) Soil organic carbon
(d) Bulk density (c) pH
Legend (a) Soil organic C (%) (b) Clay (%) (c) pH (d) Bulk density (Mg m-3) <0.2 <20 <5.5 <1.35 0.2-0.4 20-30 5.5-6.5 1.35-1.40 0.4-0.6 30-40 6.5-7.5 1.40-1.45 0.6-0.8 40-50 7.5-8.5 1.45-1.50 >0.8 >50 >8.5 >1.50
(Note: If possible, we would like to provide these figures in colour)
Fig. 4. Spatial distribution of organic carbon, clay contents, pH and bulk density of
soils of India. Legends of the figures are given below.
(b) Clay (a) Soil organic carbon
(d) Bulk density (c) pH
Legend (a) Soil organic C (%) (b) Clay (%) (c) pH (d) Bulk density (Mg m-3) <0.2 <20 <5.5 <1.35 0.2-0.4 20-30 5.5-6.5 1.35-1.40 0.4-0.6 30-40 6.5-7.5 1.40-1.45 0.6-0.8 40-50 7.5-8.5 1.45-1.50 >0.8 >50 >8.5 >1.50
(Note: If possible, we would like to provide these figures in colour)
29
Fig. 4. Spatial distribution of organic carbon, clay contents, pH and bulk density of soils of India. Legends of the figures are given below.
BGD
2, 77–102, 2005
Greenhouse gas emissions from Indian rice fields
H. Pathak et al. Title Page Abstract Introduction Conclusions References Tables Figures J I J I Back Close
Full Screen / Esc
Print Version
Interactive Discussion
EGU
(d) Global warming potential (c) Carbon dioxide
(b) Nitrous oxide (a) Methane
Fig. 5. Annual emissions of methane, nitrous oxide, carbon dioxide and global warming
potential of rice systems of India under continuous flooding condition. Legends of the figures are given below.
Legend (a) CH4 (kg CH4-C ha-1) (b) N2O (kg N2O-N ha-1) (c) CO2 (kg CO2-C ha-1) (d) GWP (kg CO2 ha-1) <10 <0.5 <600 <2000 10-30 0.5-1.0 600-1200 2000-4000 30-50 1.0-1.5 1200-1800 4000-6000 50-70 1.5-2.0 1800-2400 6000-8000 >70 >2.0 >2400 >8000 (Note: If possible, we would like to provide these figures in colour)
(d) Global warming potential (c) Carbon dioxide
(b) Nitrous oxide (a) Methane
Fig. 5. Annual emissions of methane, nitrous oxide, carbon dioxide and global warming
potential of rice systems of India under continuous flooding condition. Legends of the figures are given below.
Legend (a) CH4 (kg CH4-C ha-1) (b) N2O (kg N2O-N ha-1) (c) CO2 (kg CO2-C ha-1) (d) GWP (kg CO2 ha-1) <10 <0.5 <600 <2000 10-30 0.5-1.0 600-1200 2000-4000 30-50 1.0-1.5 1200-1800 4000-6000 50-70 1.5-2.0 1800-2400 6000-8000 >70 >2.0 >2400 >8000
(Note: If possible, we would like to provide these figures in colour)
30
Fig. 5. Annual emissions of methane, nitrous oxide, carbon dioxide and global warming po-tential of rice systems of India under continuous flooding condition. Legends of the figures are given below.