HAL Id: hal-00296386
https://hal.archives-ouvertes.fr/hal-00296386
Submitted on 28 Nov 2007
HAL is a multi-disciplinary open access
archive for the deposit and dissemination of
sci-entific research documents, whether they are
pub-lished or not. The documents may come from
teaching and research institutions in France or
abroad, or from public or private research centers.
L’archive ouverte pluridisciplinaire HAL, est
destinée au dépôt et à la diffusion de documents
scientifiques de niveau recherche, publiés ou non,
émanant des établissements d’enseignement et de
recherche français ou étrangers, des laboratoires
publics ou privés.
method evaluation of volatile organic compound
emissions measured by PTR-MS, FTIR, and GC from
tropical biomass burning
T. G. Karl, T. J. Christian, R. J. Yokelson, P. Artaxo, W. M. Hao, A.
Guenther
To cite this version:
T. G. Karl, T. J. Christian, R. J. Yokelson, P. Artaxo, W. M. Hao, et al.. The Tropical Forest and Fire
Emissions Experiment: method evaluation of volatile organic compound emissions measured by
PTR-MS, FTIR, and GC from tropical biomass burning. Atmospheric Chemistry and Physics, European
Geosciences Union, 2007, 7 (22), pp.5883-5897. �hal-00296386�
www.atmos-chem-phys.net/7/5883/2007/ © Author(s) 2007. This work is licensed under a Creative Commons License.
Chemistry
and Physics
The Tropical Forest and Fire Emissions Experiment: method
evaluation of volatile organic compound emissions measured by
PTR-MS, FTIR, and GC from tropical biomass burning
T. G. Karl1, T. J. Christian2, R. J. Yokelson2, P. Artaxo3, W. M. Hao2, and A. Guenther1
1National Center for Atmospheric Research, Boulder, USA 2University of Montana, Department of Chemistry, Missoula, USA 3University of Sao Paulo, Department of Physics, Sao Paulo, Brazil
Received: 7 May 2007 – Published in Atmos. Chem. Phys. Discuss.: 25 June 2007 Revised: 29 August 2007 – Accepted: 13 November 2007 – Published: 28 November 2007
Abstract. Volatile Organic Compound (VOC) emissions from fires in tropical forest fuels were quantified us-ing Proton-Transfer-Reaction Mass Spectrometry (PTRMS), Fourier Transform Infrared Spectroscopy (FTIR) and gas chromatography (GC) coupled to PTRMS (GC-PTR-MS). We investigated VOC emissions from 19 controlled labora-tory fires at the USFS (United States Forest Service) Fire Sciences Laboratory and 16 fires during an intensive air-borne field campaign during the peak of the burning season in Brazil in 2004. The VOC emissions were dominated by oxy-genated VOCs (OVOC) (OVOC/NMHC ∼4:1, NMHC: non-methane hydrocarbons) The specificity of the PTR-MS in-strument, which measures the mass to charge ratio of VOCs ionized by H3O+ ions, was validated by gas chromatogra-phy and by intercomparing in-situ measurements with those obtained from an open path FTIR instrument. Emission ra-tios for methyl vinyl ketone, methacrolein, crotonaldehyde, acrylonitrile and pyrrole were measured in the field for the first time. Our measurements show a higher contribution of OVOCs than previously assumed for modeling purposes. Comparison of fresh (<15 min) and aged (>1 h–1 d) smoke suggests altered emission ratios due to gas phase chemistry for acetone but not for acetaldehyde and methanol. Emission ratios for numerous, important, reactive VOCs with respect to acetonitrile (a biomass burning tracer) are presented.
1 Introduction
It is widely recognized that emissions of volatile organic compounds (VOC) from biomass burning can add significant quantities of reactive species to the atmosphere, altering its
Correspondence to: T. Karl
chemistry on a global scale (Crutzen et al., 1990). In recent years it also became clear that global budgets of oxygenated VOCs (OVOC) are particularly uncertain (Singh et al., 2004) and that a substantial amount of these species can be released from burning vegetation (Yokelson et al., 2003a). Many of these compounds have important implications for modeling the chemistry in the atmosphere. For example light car-bonyls such as formaldehyde and acetone can influence the HOx budget in the upper troposphere (Mckeen et al., 1997). Acetone and acetaldehyde can also be converted to acetyl peroxy radicals by atmospheric oxidation and lead to forma-tion of PAN (peroxyacetic nitric anhydride) type compounds, which act as relatively long-lived reservoirs for nitrogen ox-ides (NOx) (Roberts et al., 1998). Long range transport of these compounds can subsequently release reactive nitrogen back to the atmosphere and change ozone production rates in remote regions.
Measurements of primary VOC emissions from fires are needed to accurately initialize photochemical models that as-sess the local to global effects of smoke. VOC concentrations measurements in biomass burning plumes are also needed to assess our understanding of photochemical oxidation in smoke plumes (Goode et al., 2000; Hobbs et al., 2003). Mea-surements show that a wide suite of oxygenated compounds can be released from fires (Friedli et al., 2001; Koppmann et al., 1997; Christian et al., 2003). Many of these compounds are still poorly quantified due to analytical challenges and their relative contributions to the total VOC component of biomass burning emissions are poorly known. Early studies of biomass burning carried out in the laboratory (Lobert et al., 1990), or in important fire ecosystems in the field, con-centrated on measuring fire emissions of CO2, CO, NOx,
and hydrocarbons (e.g. savannas – SAFARI 92 (Blake et al., 1996); tropical forest – SCAR-B (Ferek et al., 1998). Later
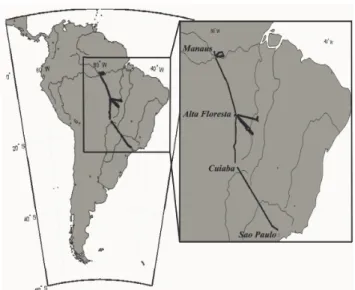
Fig. 1. Research Flights and study area during TROFFEE in 2004.
laboratory work showed that 60-80% of the organic emis-sions from fires were typically reactive OVOC (Yokelson et al., 1996; Holzinger et al., 1999) The dominance of OVOC was then confirmed in field and lab work for most of the major types of biomass burning: e.g. savannas, agricultural waste, and peat (Christian et al., 2003; Sinha et al., 2003); biofuel (Bertschi et al., 2003); and boreal forest (Goode et al., 2000). These OVOC emissions were also shown to play a critical role in smoke chemistry (Mason et al., 2001; Jost et al., 2003; Trentmann et al., 2005). However, there were no data on OVOC emissions from tropical deforestation fires de-spite this consistently being estimated as one of the 3 largest global types of burning (Crutzen et al., 1990; Andreae et al., 2001b).
The TROFFEE (Tropcial Fire and Forest Emissions Ex-periment) campaign was designed to address the lack of OVOC information for tropical deforestation fires. Brazil was a logical choice for this effort since it has the most trop-ical forest and deforestation fires. In addition, a good knowl-edge base on many aspects of Brazilian fires was in place (Crutzen et al., 1985, Andreae et al., 1988; Kaufman et al., 1998; Ferek et al., 1998; Carvalho et al., 2001). The inten-sive part of the TROFFEE field campaign was carried out in 3 Amazonian states of Brazil (Mato Grosso, Par´a, and Amazonas) from 27 August–8 September 2004. This probed the spatial and temporal peak of global deforestation fires for 2004. The airborne portion of the field campaign fea-tured the characterization of 16 nascent lofted biomass burn-ing plumes and regional haze by Proton-Transfer-Reaction mass spectrometry (PTR-MS), airborne Fourier Transform Infrared Radiation spectrometry (AFTIR), whole air sam-pling into stainless steel canisters, and O3and particle mea-surements. This instrument package was particularly well suited for measuring OVOC and other major fire emissions
such as CO2, CO, CH4, NOx, and hydrocarbons. A ground-based field campaign featured chemical characterization of typical regional unlofted biomass burning plumes by FTIR as well as fuel consumption and fire ecology measurements on a planned research fire. Prior to the field campaign, a labo-ratory experiment co-deployed and intercompared PTR-MS, open-path FTIR, and GC-PTR-MS on 32 controlled fires that burned 19 tropical fuels, which are reported here. The labo-ratory experiment was carried out to validate PTR-MS results obtained in smoke, help plan the PTR-MS sampling protocol for the field campaign, and (due to the higher smoke concen-trations sampled) quantify emissions that went unmeasured in the field.
In this paper, we concentrate on a detailed presentation of the validation of the PTR-MS results in smoke, and quantify the relative contributions of various species on the PTR-MS mass spectra. These insights are gleaned from coupling with the FTIR and GC-PTR-MS results. In addition, we note that acetonitrile is now recognized as a useful tracer for biomass burning and that the capability for accurate acetonitrile mea-surements by PTR-MS is becoming widespread (De Gouw et al., 2006a; Holzinger et al., 1999). Thus, we also present the ratios for numerous, reactive VOC to acetonitrile as mea-sured by PTR-MS in both the lab and the field and for both fresh and moderately aged smoke. Related papers present fire and fuel specific emission factors on a g/kg basis for the lab fires (Christian et al., 2007a1), airborne sampling (Yokel-son et al., 2007), and the ground-based field sampling (Chris-tian et al., 2007b2).
2 Methods
2.1 Missoula burning facility
The combustion facility at fire science laboratory, (de-scribed in more detail by Christian et al., 2003) measures 12.5 m×12.5 m×22 m high. A 1.6 m diameter exhaust stack with a 3.6 m, inverted funnel opening extends from ∼2 m above the floor to the ceiling. The room is pressurized with outside air that has been conditioned for temperature and rel-ative humidity (RH), and is then vented through the stack, completely entraining the emissions from fires burning be-neath the funnel. A sampling platform surrounds the stack at 1Christian, T. J., Karl, T., Yokelson, R. J., Guenther, A., and
Hao, W. M.: The Tropical Forest and Fire Emissions Experiment: Comprehensive laboratory measurements of the emissions from burning sugar cane, palms, and other tropical fuels, Atmos. Chem. Phys. Discuss., submitted, 2007a.
2Christian, T. J., Yokelson, R. J., Carvalho, A., Griffith, D. W.
T., Alvarado, E. C., Santos, J. C., Neto, T. G. S., Veras, C. A. G., and Hao, W. M.: The Tropical Forest and Fire Emissions Experiment, in : Trace gases emitted by smoldering logs and dung on deforestation and pasture fires in Brazil, Atmos. Chem. Phys. Discuss., 2007, submitted, 2007b.
17 m elevation where all the temperature, pressure, trace gas, and particle measurement equipment for this experiment was deployed except the instrument for background CO2(LICOR 6262). The fuel bed was a metal tray (∼50×50 cm) cov-ered by an inert heat shield and a layer of sand. The bed was continuously weighed by an electronic balance. Dur-ing these experiments, chamber temperature and RH aver-aged 20.4◦±3◦C and 40.4% ±7.1%. Smoke temperature and RH, at platform level, varied throughout each fire and from fire to fire. The maximum smoke temperature observed was 43◦C. A total of 19 tropical fires were sampled at the USFS Fire laboratory consisting of a mix of tropical plant species (Artocarpus altilus, Calliandra haematocephala, Theobroma
cacao, Davidson pruriens, Eucalyptus sp., Ficus, Mango, Neraudia sp., Psidium cattleianum, Sugar cane, Cecropia
sp., Sparmannia sp., Munroidendron racemosum, Erythrina
humeana, Terminalia catappa and Dambo).
2.2 Flight operations
The TROFFEE airborne campaign consisted of 44.5 flight hours between 27 August and 8 September 2004 on an Em-braer 110B belonging to the Brazilian National Institute for Space Research (Instituto Nacional de Pesquisas Espaciais (INPE)). The aircraft was primarily based in Alta Floresta, Mato Grosso in the southern Amazon (−9.917◦, −56.017◦), and in Manaus, Amazonas. Regional haze due to biomass-burning and the nascent emissions from sixteen fires (primar-ily deforestation fires associated with expansion of mecha-nized agriculture) were sampled in the states of Mato Grosso and Par´a within about one-hour flight time (∼300 km) of Alta Floresta. Three agricultural fires were sampled near Manaus. Biogenic VOC emissions were also characterized on these flight legs above pristine tropical rain forest and plantations and are described elsewhere (Yokelson et al., 2007).
Figure 1 shows flight tracks flown onboard the research aircraft. The biomass burning flight operations were typi-cally planned according to local weather and fire forecasts. One important aspect of the fire sampling strategy for all fires was to measure the smoke composition as close as possible to the source. In the past measurements in the immediate vicin-ity of a fire were rarely conducted (Andreae et al., 2001a) and plumes were often sampled at certain distances downwind of a fire, where VOC patterns have already changed due to ag-ing and photochemical processag-ing (Trentmann et al., 2005). Plume penetrations were typically flown between 100 and 2000 m above the fire. Nearly all the fires we found in Mato Grosso and southern Para were related to the expansion of ex-isting, large farms or ranches located on the edge of forested (or partially forested) areas that were adjacent to large tracts of cleared, often cultivated land. More detailed information on specific fires can be found in Yokelson et al. (2007). The investigation of aging of individual plumes proved to be chal-lenging due to concentrated regional haze on all days and or the mixing of plumes from different fires.
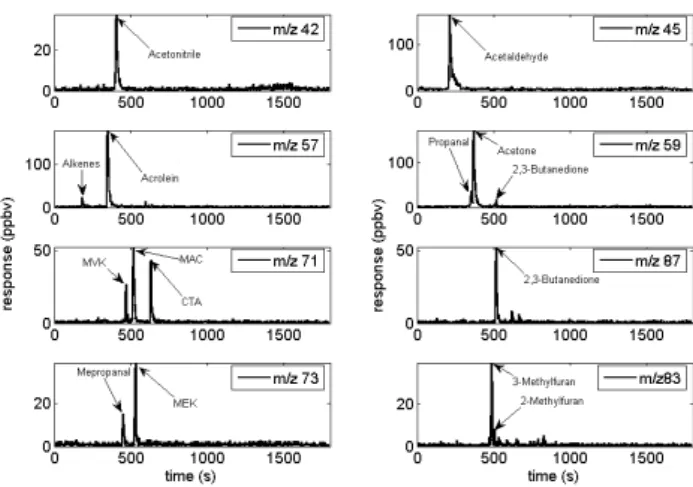
Fig. 2. GC-PTRMS chromatograms for eight mass channels (m/z).
(MVK: methyl-vinylketone, MAC: methacrolein, CTA: Croton-aldehyde, MePropanal : Methylpropanal).
2.3 PTRMS
PTR-MS has been described in detail elsewhere (Lindinger et al., 1998). Briefly, PTR-MS combines chemical ionization (CI) due to ion-molecule-reactions with the swarm technique of the flow-drift-tube type. H3O+ is used as the ionizing agent and ionization occurs when VOC trace constituents in the air have a higher proton affinity (PA) than that of H2O. The flow-drift-tube system guarantees that the reactions take place under well defined conditions so that the count rates of product ions can be quantitatively connected to the absolute concentrations of the VOCs under investigation for exother-mic reactions:
[VOC]=CF ·cps(VOC
+)
cps(H3O+)
(1) with CF representing the calibration factor, which can also be calculated based on the proton transfer rate constants k (e.g. Gouw and Warneke, 2007). Proton transfer rate con-stants are typically large, corresponding to the collisional limiting values (≈10−9cm3/s) (Lindinger et al., 2001). The value for E/N (E being the electric field strength and N the buffer gas density) in the drift tube is kept high enough (∼120 Townsend) to avoid strong clustering of H3O+ ions with water. The drift tube temperature was temperature con-trolled at 40◦C. The sensitivity of the PTR-MS instrument during the TROFFEE field study was typically on the order of ∼70 Hz/ppbv (counts per second per ppbv) for acetone and 50 Hz/ppbv for methanol at 2.0 mbar buffer gas pressure with a reaction time of 110 µs and 4 MHz H3O+ions. The detec-tion limit (DL) for compounds investigated in this work was inferred from a signal to noise ratio (S/N ) of 2 according to DL=2×SDblank/sensitivity, with SDblankbeing the standard deviation of background count rates. For a 5 s (2 s) integra-tion time this resulted in theoretical detecintegra-tion limits around ∼20 pptv (∼58 pptv). Here we assign a default reaction rate
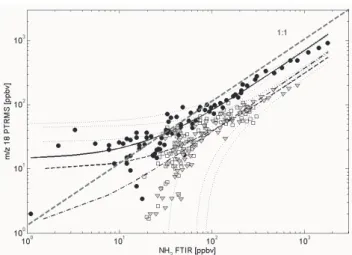
Fig. 3. Ammonia intercomparison plots for 3 laboratory fires: Fire
1 (Tropical composite, circles), fire 2 (Cacao, triangles) and fire 3 (Terminalia catappa, square symbols) yielded slopes of 0.69±0.04 square: 0.9880), 0.30±0.06 square: 0.64) and 0.37±0.05 (R-square: 0.9197), respectively. Thin dotted lines indicate the 95% confidence interval for each regression. Solid black (fire 1), dashed black (fire2) and dashed dotted black (fire 3) lines represent the fit lines. For comparison the 1:1 line (gray dashed line) is also plotted.
constant of 2.2×10⁻⁹cm3/s when the concentration mea-surement is based on (1) with an estimated uncertainty on the order of ±30%. In addition we used a gravimetrically pre-pared multi component standards to calibrate the PTR-MS instrument for methanol, acetonitrile, acetone, acetaldehyde, benzene, toluene, xylenes, 1,3,5 trimethylbenzene, hexanal, 2-pentanone, isoprene and MVK with an estimated uncer-tainty of ±20%. Acetic acid was measured using a gravimet-rically prepared liquid standard. Fragmentation patterns for all VOCs investigated in this study were measured using pure (>98%) standards purchased from Sigma-Aldrich. Due to the low proton affinity of formaldehyde (PA=170.4 kcal/mol) and HCN the backward reaction via H2O can become sig-nificant and thus lower the sensitivity for these compounds as indicated by Hansel et al. (1997). We inferred empirical calibration factors for these compounds as a function of hu-midity by intercomparing with a Fourier transform infrared radiation spectrometer (FTIR). The PTRMS inlet for aircraft operations consisted of a 5 m PFA-Teflon line (o.d. 1/4 inch, backward facing inlet at the aircraft fuselage) pumped by a diaphragm pump (Pfeiffer, MD4). At its end a pressure controlled Teflon line (o.d. 0.0625 inch, length 0.2 m) led ∼100 sccm of this air stream to a second bypass where a crit-ical orifice at the drift tube maintained a flow of ∼15 sccm into the PTRMS instrument. The pressure in the 5 m PFA-line was reduced to 500 mbar in order to avoid condensation, minimize memory effects and assure a fast response time. The overall response time caused a delay time of less than 2 s, measured by spiking an acetone and isoprene concentra-tion pulse at the inlet.
2.4 GC-PTRMS
As the PTR-MS method gives only information on m/z data for VOCs, it is not always possible to unambiguously iden-tify released VOCs. For the laboratory experiments, we cou-pled a GC column to the PTR-MS instrument. Similar setups have been used in the past (Lindinger et al., 2001; Warneke et al., 2003a). The effluent gas stream from the smoke stack was trapped on Tenax for 10 min at −10◦C and subsequently desorbed by heating the trap up to 200◦C; the compounds of interest were injected onto the head of a 50 m HP-624 col-umn, and analyzed on a Shimadzu GC instrument (Green-berg et al., 1994), using a PTR-MS instrument as detector. The instrument was operated in multiple ion mode. The GC temperature was held at 0◦C for 2 min after injection and subsequently ramped up to 200◦C at 10◦C min−1. Identifi-cation of volatiles was based on a combination of retention times and selected VOC fragmentation data in the PTR-MS instrument operated in multiple ion detection (MID) mode. Retention times were obtained individually by injecting pure standards of all compounds reported in this manuscript. 2.5 FTIR
The open path Fourier transform infrared spectrometer (OP-FTIR) was positioned on the sampling platform so that the open white cell spanned the stack directly in the rising emis-sions stream for continuous (0.83 s resolution) scanning. The OPFTIR system (Yokelson et al., 1997) includes a MIDAC model 2500 spectrometer; a 1.6 m base path, open White cell; and an MCT (mercury-cadmium-telluride), LN2cooled detector. The path length was set to 57.7 m and spectral res-olution was 0.5 cm−1. Before each fire, we scanned for 2– 3 min to obtain a background spectrum. For long-duration fires with slowly changing temperature and emissions, we increased the signal to noise ratio (S/N ) by averaging up to 40 absorbance spectra (∼30 s resolution). For shorter fires with larger or more rapid temperature fluctuations, averaging was limited to 7 spectra (∼6 s resolution).
The inlet of the AFTIR (airborne FTIR) had a dedicated, halocarbon-wax, coated forward facing inlet that directed ram air through a Pyrex, multipass cell. The flow through the system was high enough to exchange the air in the AF-TIR cell every 2–4 s. Fast-acting flow control valves allowed the system flow to be temporarily stopped for signal averag-ing and improved accuracy on “grab samples.”
We used classical least squares spectral analysis (Grif-fith, 1996) to retrieve excess mixing ratios for water (H2O), methane (CH4), carbon monoxide, (CO), methanol (CH3OH), ethylene (C2H4), phenol (C6H5OH), acetone (CH3C(O)CH3), hydroxyacetone (CH2(OH)C(O)CH3), iso-prene (C5H8), hydrogen cyanide (HCN), furan (C4H4O), nitric oxide (NO), nitrogen dioxide (NO2) and formalde-hyde (HCHO). We used spectral subtraction (Yokelson et al., 1996) to retrieve excess mixing ratios for water
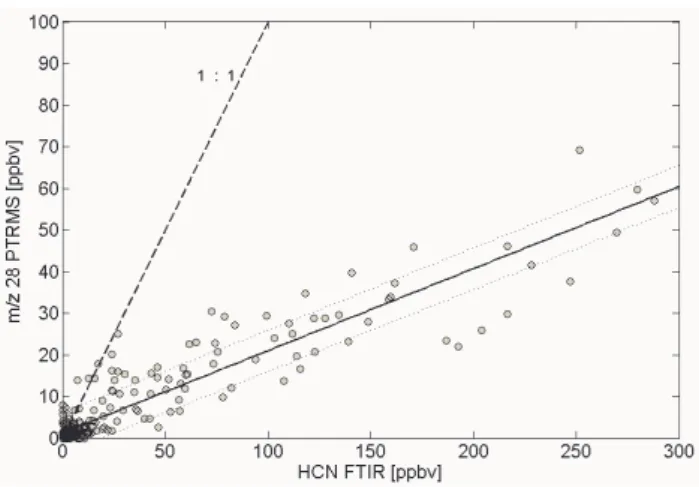
Fig. 4. HCN intercomparison plot (laboratory data). Black solid
line depicts the best fitted line. Thin dotted lines indicate the 95% confidence interval and the dashed line represents the 1:1 line for comparison. The lower response of the PTRMS instrument is due to the backward reaction HCNH++H2O->HCN+H3O+.
(H2O), ammonia (NH3), formic acid (HCOOH), acetic acid (CH3COOH), glycolaldehyde (CH2(OH)CHO), acetylene (C2H2), propylene (C3H6), and methyl vinyl ether (MVE, CH3OCHCH2). These molecules account for all the signifi-cant, sharp (i.e. FWHM <∼5 cm−1) features observed from 600–3400 cm−1 in the IR spectra. The detection limit for most gases was 5–20 ppbv for a 30 s measurement time and ∼10–50 ppbv at the highest time resolution used (6 s). The typical uncertainty in an FTIR mixing ratio is ±5% (1σ ) due to calibration or the detection limit (2σ ), whichever is greater.
2.6 Auxiliary measurements
For laboratory experiments CO2 and CO in the emissions stream were monitored continuously using a LICOR 6262 and a TECO 48C in addition to the OP-FTIR. (A second LICOR 6262 was used to monitor background CO2 levels in the combustion chamber.) These instruments were cali-brated with NIST traceable standards. In addition, stack air was drawn through a cyclone to remove particles larger than 2.5 µm effective diameter, then onto Teflon filters. We con-tinuously monitored fuel mass and stack temperature, pres-sure, and flow with 2 s resolution. The data from these instru-ments was coupled with PTR-MS and GC-PTR-MS data to calculate fire-integrated emission factors that are presented in Christian et al. (2007a1).
Fig. 5. HCHO ratios between PTRMS (PTR) and FTIR (FTIR)
plotted versus ambient water concentration (field data). The solid gray line is a fitted line according to (Hansel et al., 1997), yield-ing a backward reaction rate constant of kb=3×10⁻¹⁰cm3/s. The solid black line is a linear line fitted through the data points [f(x)=2.55(±0.63)*x-23.54(±8.7); R2:0.73]. Thin dotted lines cor-respond to the 1 σ -levels of this fit (25%). The dashed rectangle indicates conditions during laboratory measurements.
3 Results and discussion
3.1 Laboratory fires: identification and intercomparison of VOCs measured by PTR-MS and FTIR
This section reports an improved evaluation and intercom-parison of the PTR-MS instrument using a two–pronged ap-proach. Following work published by Christian et al. (2004) we report PTRMS/FTIR ratios for all species where an in-tercomparison between these two instruments is possible. Whenever possible a comparison between the PTR-MS and FTIR instrument will be presented as a ratio (PTR-MS/FTIR) inferred from the slope of an x-y weighted (orthogonal) re-gression. In addition we used a GC-PTR-MS setup to as-sess the specificity of individual PTR-MS mass channels (Ta-ble 1). Figure 2 shows typical chromatograms obtained by coupling the PTR-MS to a GC column. In this paper, we compute two separate averages, (1) for all the data obtained from the laboratory tropical-fuel fires and (2) for all the fires measured in the field. We report an average emission ratio to acetonitrile for each VOC for both experiments (Table 2). Species listed in Tables 1, 2 and 3 accounted for 72±4% of the total response observed on all PTR-MS mass channels (m/z 18+to m/z 205+).
3.1.1 VOCs containing nitrogen:
Ammonia (m/z 18+): The detection limit of the PTR-MS for ammonia for a 1 s integration time was on the order of 5 ppbv during this study. The ability to detect ammonia with the PTR-MS instrument has improved considerably compared to
an earlier study (Christian et al., 2004) by using a heated sil-ica steel capillary (60◦C) as a sample inlet. We tested the
response time by spiking ammonia to the air flowing through the sampling stack. At high concentrations (>100 ppbv) the rise time of ammonia in the PTRMS instrument was 5–10 s slower than in the open-path FTIR instrument. The initial decay time on m/z 18+was 13 seconds compared to 6 s de-cay time in the smoke stack observed by the open path FTIR instrument. The remaining 14% of the initial concentra-tion spike contaminated the PTR-MS instrument for several hours. Yokelson et al. (2003b) compared the ammonia de-lay time in a fast flow, closed-cell FTIR system to that of nonsticky gases and saw similar delays (∼10–40 s). Figure 3 shows an intercomparison plot between the open path FTIR and PTR-MS instrument for 3 fires with sufficiently high sig-nal/noise ratio. The PTR-MS response time for ammonia in these experiments was longer (30–60 s) compared to the standard addition experiment described above. This is prob-ably because passivation of surfaces can take more time at lower concentrations. An x-y weighted regression yielded slopes of 0.69±0.04 (fire 1, Tropical composite, circles, R-square: 0.988), 0.30±0.06 (fire 2, Cacao, triangle synbols, R-square: 0.64) and 0.37±0.05 (fire 3, Terminalia catappa, square symbols, R-square: 0.9197), respectively. On average the PTR-MS trace was 55% lower than the open path FTIR signal for ammonia, but this ratio is probably specific for the concentrations and flow rates that we encountered. We as-sume the losses occur in the inlet plumbing (air was pulled through a ∼2 m long 3/8′′ Teflon line). In fires with high ammonia emissions (fire 1) the losses appear to be smaller – again consistent with faster passivation at higher concentra-tions. Our measurements suggest that further improvements of the inlet manifold (e.g. higher flow rates, higher tempera-tures or halocarbon wax coating) could enable the PTR-MS instrument to measure ammonia from fires in the future much better. Recently, significant improvement of ammonia mea-surements using the PTR-MS instrument has been achieved by using O+2 chemistry (Norman et al., 2007). The downside of using O+2 chemistry is that the analysis of VOCs based on H3O+ chemistry is not possible anymore. For specific ap-plications however O+2 chemistry could be a significant ad-vancement for measuring ammonia in the future.
HCN (m/z 28+): We did not observe significant interfer-ences on this PTR-MS mass channel. As described below for formaldehyde, the backward reaction of the protonated species HCNH+ can be significant due to a very low
pro-ton affinity (PA=170.4 kcal/mol), resulting in a lower and hu-midity dependent sensitivity. Christian et al. (2004) applied a rate constant and rough method for correcting formalde-hyde mixing ratios suggested by Hansel et al. (1997) and found that the correction factor can be on the order of four. They applied the same factor to HCN, which has the same proton affinity as formaldehyde. A factor of four for HCN is close for the present laboratory experiment (see Fig. 4),
which yielded a PTRMS/FTIR ratio of 0.19±0.01. While the PTRMS instrument was able to detect HCN on this mass channel in the field, it was not possible to measure HCN with the FTIR instrument in the field. We assume that a rela-tionship similar to formaldehyde would be true for field data and correct this PTRMS mass channel based on our HCHO PTRMS/FTIR comparison in the field (see next section on oxygenated VOCs).
Acetonitrile (m/z 42+): This compound was only
mea-sured by PTR-MS. GC-PTR-MS measurements (Fig. 2) do not show any significant interference, suggesting that charge transfer reaction between O+2 and alkanes is not important in smoke under standard PTR-MS operating conditions. Ace-tonitrile is thought to be primarily emitted from burning veg-etation. Here we use it to report VOC emission ratios to ace-tonitrile from fires. There are several advantages of using acetonitrile as a biomass burning marker. It is very long lived (τ =∼900 d), has no significant sources other than burning vegetation, and is not produced from gas phase chemistry in the atmosphere, which for example can alter excess mixing ratios of CO (Mauzerall et al., 1998). VOC/acetonitrile ra-tios are useful for intercomparing different chemical datasets and detecting the influence of fires on experiments focused on other phenomena. The FTIR instrument was not able to detect acetonitrile because the reasonably strong features in the IR-spectrum are overlapped by water lines in smoke.
Propenenitrile (m/z 54+) and Propanenitrile (m/z 56+):
Both compounds have been reported in earlier laboratory studies (Christian et al., 2004; Lobert et al., 1990) and were confirmed using the GC-PTRMS setup during this work.
Pyrrole (m/z 68+): No significant interferences for pyrrole (C4H5N) have been observed in the present study.
3.1.2 VOCs containing oxygen:
Formaldehyde (m/z 31+): The detection limit of the PTR-MS for formaldehyde was on the order of 2–4 ppbv during this study. The sensitivity for measuring formaldehyde with the PTR-MS is compromised by the humidity dependent back-ward reaction kb(Hansel et al., 1997).
H3O++HCHO−→kf H2O+HCHOH+ (2)
H2O+HCHOH+
kb
−→H3O++HCHO (3)
Comparison with results obtained by the FTIR instrument shows that the humidity dependent correction is linear over the range investigated during this work. During laboratory experiments the correction factor calculated for formalde-hyde (5.2) was similar to HCN. During field experiments the sensitivity was lower than during laboratory experiments due to higher absolute water content in the atmosphere. The hu-midity dependent calibration curve for the field data is shown in Fig. 5, where the FTIR/PTRMS ratios are plotted as a function of water content in the atmosphere. A theoretical
line (according to Eq. 2) is fitted using a non-linear least squares fit (gray solid line). This fit results in a backward reaction constant of kb=3×10⁻¹⁰cm3/s (the forward
reac-tion rate constant kf was constrained to 2×10⁻⁹cm3/s). The
correction factor in Fig. 5 is plotted as a function of the am-bient water content. The actual drift tube water content is higher due the internal water flow through the hollow cath-ode, which can add up to ∼100/00v water to the drift tube. Also shown is a linear x/y weighted fit to the dataset (black line; f(x)=2.55(±0.63)*×−23.54(±8.7); R2:0.73). Similar relationships might be used in the future to calibrate the PTR-MS instrument by using the 1st water cluster (H3O+H2O) as a relative measure for humidity.
Methanol (m/z 33+): The agreement for methanol be-tween PTR-MS and FTIR instruments was excellent during this study. The average ratio between both instruments for all laboratory fires was 1.1±0.2. Not too surprisingly, the GC-PTR-MS measurements did not show any significant in-terference. Christian et al. (2004) observed similarly good agreement in an earlier study of smoke. We use methanol as a key compound to relate VOC ratios measured by PTR-MS to those measured by FTIR for the datasets obtained during the airborne TROFFEE study (Yokelson et al., 2007).
Acetaldehyde (m/z 45+): GC-PTRMS measurements sug-gest that this compound was uniquely monitored by the PTRMS instrument contrasting earlier studies (Warneke et al., 2003b) that observed interferences from CO2H+. Differ-ent operating conditions between the drift tube and detection chamber of the PTR-MS instrument, in earlier studies might have created this artifact. For reasons similar to those men-tioned for acetonitrile, the FTIR instrument was not able to detect acetaldehyde in the IR spectra.
Formic Acid (m/z 47+): The PTRMS/FTIR ratio is
0.8±0.4. This is higher than values observed by Christian et al. (2004). We attribute this improvement to a better inlet design of the PTRMS instrument resulting in smaller losses compared to what was used in earlier studies. Interference from ethanol was minor due to the high fragmentation (up to 90%) of ethanol and low emissions.
Acrolein (m/z 57): On average 84% of the signal
mon-itored on this PTR-MS mass channel was observed by GC-PTR-MS to be acrolein with minor contributions from alkenes (15%) and MTBE (1%). Acrolein has a relatively small IR absorption cross-section and was below the FTIR detection limit in these experiments.
Acetone and Propanal (m/z 59+): GC-PTR-MS suggests
that acetone (83%) and propanal (13%) account for more than 90% detected on this mass channel. A minor frag-ment (4%) originating from 2,3-butanedione contributed to
m/z 59%. Christian et al. (2004) reported a minor
contri-bution from methyl-vinyl-ether (MVE). The GC-PTR-MS measurements however do not show a significant interfer-ence from MVE in this work. The PTRMS/FTIR ratio was close to 1.3±1.0. The scatter and uncertainty of this inter-comparison is largely due to the fact that the FTIR instrument
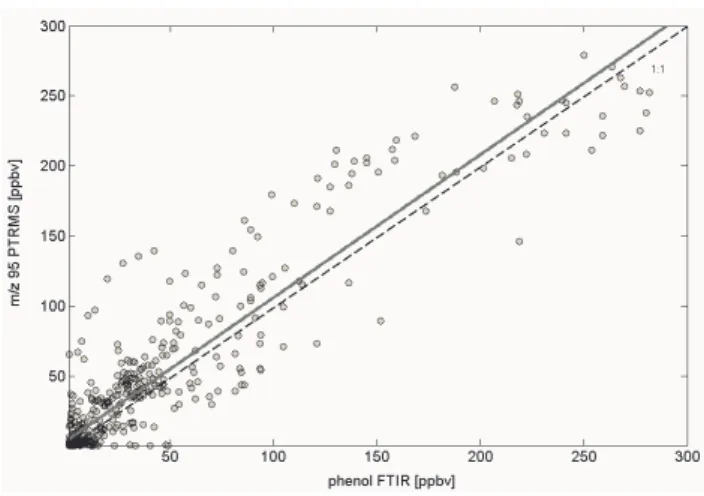
Fig. 6. Phenol intercomparison plot (laboratory data). Black solid
line depicts the best fitted line and the dashed line represents the 1:1 line for comparison. The regression: yielded a slope of 1.02±0.15.
was measuring close to its detection limit. Acetic Acid and
Glycolaldehyde (m/z 61+): It was not possible to
discrim-inate these structural isomers using the GC-PTR-MS inter-face due to insufficient trapping, losses and memory effects in the GC-inlet. However the FTIR instrument had excel-lent S/N ratios for most fires and the average PTRMS/FTIR ratio for acetic acid+glycolaldehyde was 1.13±0.3, confirm-ing earlier results for this PTRMS mass channel (Christian et al., 2004). The acetic acid (AA)/methanol (MeOH) ratio was used to compare PTRMS and FTIR instruments in the field. This resulted in a (AA/MeOH)PTRMS/(AA/MeOH)FTIRratio of 0.73±0.4. The average ratio by FTIR between acetic acid and glycolaldehyde for tropical fuels was 4.56±3.20 (82% acetic acid and 18% glycolaldehyde). Typical fragmentation for acetic acid observed during the present study was m/z 61+: 75% and m/z 43+: 25%. The calibration of acetic acid was based on a gravimetrically prepared liquid standard. We did not measure the fragmentation of glycolaldeyde and base the compound branching ratio on this PTRMS mass channel on results obtained from the FTIR instrument.
Isoprene and furan (m/z 69+): This PTR-MS mass chan-nel was split on average among isoprene (48%), furan (42%) and minor contribution from other alkenes (10%) as in-ferred from the GC-PTRMS measurements. The PTRMS (m/z69+)/FTIR (isoprene+furan) ratio also confirms the PTR-MS result since it has an average value of 1.05±0.4. Isoprene can fragment in the PTRMS instrument and yield
m/z 41+. During our study the m/z 69+to m/z 41+ratio was 80% to 20%. No fragmentation of furan was observed.
Methyl Vinyl Ketone, Methacrolein and Crotonaldehyde (m/z 71+): These compounds have not been reported in pre-vious studies (Andreae et al., 2001b; Christian et al., 2004). Our results show that on average all of these structural iso-mers contribute to m/z 71 as listed in Table 1. Minor inter-ferences (4%) originate from higher alkenes. No comparison
with the FTIR instrument was possible. We did not observe significant fragmentation of these compounds.
Methyl ethyl ketone (MEK) and methyl propanal (m/z 73+): The major contribution on this PTR-MS mass chan-nel (on average) originated from MEK (74%) and methyl-propanal (23%) as determined with the GC interface. These compounds were below the detection limit of the FTIR in-strument.
Hydroxyacetone (m/z 75+): The PTRMS/FTIR ratio for this compound is 0.74±0.29 similar to observations by Christian et al. (2004), who suggested that including data with low S/N ratios from the FTIR instrument might cause much of this discrepancy. The fragmentation of hydroxyace-tone in the PTRMS instrument was small during this study: more than 80% remained on the parent ion (m/z 75). We de-tected traces of methyl acetate on this ptrms mass channel. Based on a reaction rate constant of 2.8×10⁻⁹cm3/s and no fragmentation (Spanel and Smith, 1998), the contribution of methylacetate would be <3%.
Methyl furans and Hexanal (m/z 83+): According to GC-PTR-MS, the two isomers 3- and 2- methyl furan contributed more than 95% to this mass channel. Hexanal dehydrates and has a major fragment (>80%) on this mass channel, however the contribution of hexanal (2%) was minor. We did not ob-serve significant fragmentation of methyl furans.
2,3-Butanedione (m/z 87+): The GC-PTR-MS data showed 2,3 butanedione as the major species (80%) on this mass channel, with contributions from 2-pentanone (9%) and 3-pentanone (4%). 7% of the signal could not be identified. 34% of 2,3-butanedione showed a fragment on m/z 59+(see also Fig. 2).
Substituted Furans and Furfurals (m/z 97+): GC-PTRMS measurements showed various peaks eluting in the dimethyl – and ethyl furan region accounting for 79% of the chro-matogram peak area. The remaining 21% were divided be-tween 3-furaldehyde (20%) and 2 furaldehyde (1%). Friedli et al. (2001) have observed 2,4 and 2,5 methyl furan as well as 2-ethyl furans, which are likely candidates for the PTR-MS signal on this mass channel. Further measurements will be necessary to fully characterize this PTR-MS mass chan-nel.
3.1.3 Aromatics:
Benzene (m/z 79+): Benzene contributed 90% to this
PTR-MS mass channel. Smaller amounts from the ethyl benzene fragment (10%) were due to slightly higher collisional ener-gies in the drift tube region used during this work than during other studies (Warneke et al., 2001).
Toluene (m/z 93+): Toluene contributed 100% to this PTR-MS mass channel within experimental uncertainty.
Phenol (m/z 95+): The PTR-MS/FTIR intercomparison is shown in Fig. 6. The slope corresponds to a PTR-MS/FTIR ratio of 1.02. This comparison suggests that phenol is the major compound detected on this PTR-MS mass channel.
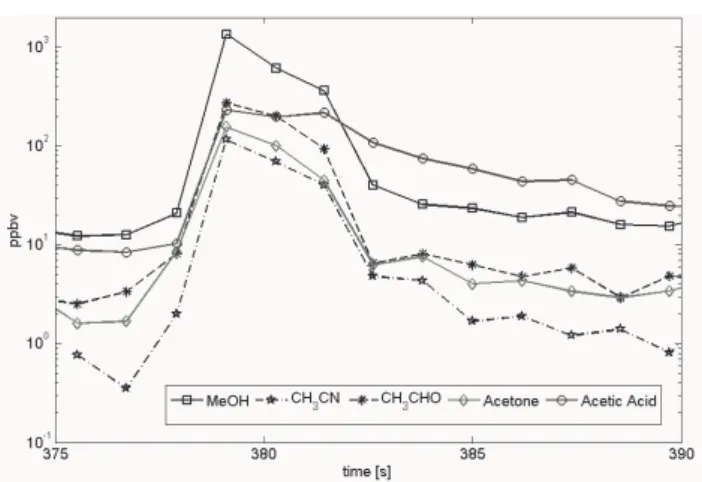
Fig. 7. Concentrations during a biomass burning plume
penetra-tion on 29 August 2004. Plotted are methanol (MeOH), acetonitrile (CH3CN), acetaldehyde (CH3CHO), acetone and acetic acid.
Phenol could not be accurately recovered using the GC-PTR-MS coupling and contributed only 25% to the total signal of the GC-PTR-MS measurements. Two more peaks eluted in the GC-PTRMS chromatogram, one of which likely corre-sponded to vinylfuran, which is commonly observed in fires (Friedli et al., 2001) and the other remains unidentified at this point. Based on the intercomparison with FTIR, the overall bias due to interferences on this mass channel is small, part of which is likely vinyl furan.
Xylenes and Ethylbenzene (m/z 107+): Xylenes (m,p,o) account for 78% and ethylbenzene for the remaining 22% on this PTR-MS mass channel. In this study we did not see significant amounts of benzaldehyde, which would also be detected on m/z 107+. This contrasts observations by Green-berg et al. (2006) who detected large amounts of benzalde-hyde in pyrolysis experiments at low temperature(<150◦C). It has been previously suggested that xylenes and ethyl-benzene are produced at high temperatures (e.g. >500◦C) – e.g. (Browne, 1958). While some losses of benzaldehyde in our GC interface can not be entirely excluded, our measure-ments indicate that the production of benzaldehyde in smol-dering vegetation seems small compared to the production of xylenes and ethyl benzene. Future measurements using dif-ferent fuels and burning conditions will be necessary to bet-ter understand the influence of benzaldehyde on this PTRMS mass channel.
C9benzenes (m/z 121+): The GC-PTRMS data show that peaks on this mass channel eluted in the region of C9 ben-zenes (e.g. trimethylbeneben-zenes); we therefore attribute the signal on this PTR-MS mass channel to C9 benzenes. Pos-sible fragmentation of higher molecular aromatics has been observed by Warneke et al. (2003a), who report that propyl-benzenes can give a fragment on m/z 79+(e.g. 56%) Here we use a generic calibration that is based on 1,3,5 trimethylben-zene. No significant peaks on m/z 79+during GC-PTR-MS
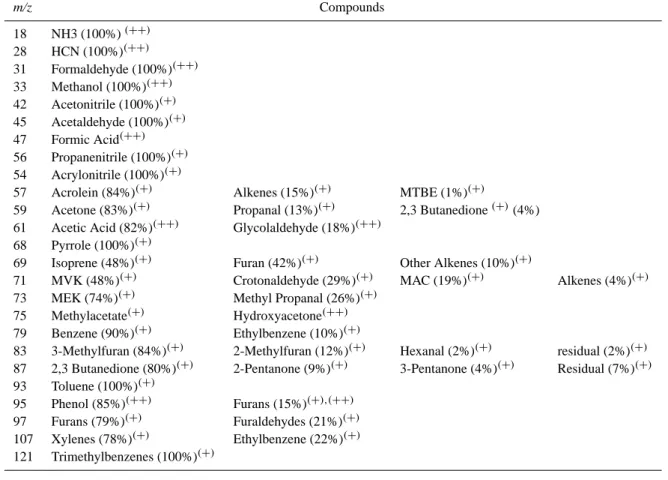
Table 1. PTR-MS compound assignment based on GC-PTR-MS measurements (+) and PTR-MS/FTIR intercomparison (++). (m/z: mass/charge ratio detected by PTRMS).
m/z Compounds 18 NH3 (100%)(++) 28 HCN (100%)(++) 31 Formaldehyde (100%)(++) 33 Methanol (100%)(++) 42 Acetonitrile (100%)(+) 45 Acetaldehyde (100%)(+) 47 Formic Acid(++) 56 Propanenitrile (100%)(+) 54 Acrylonitrile (100%)(+)
57 Acrolein (84%)(+) Alkenes (15%)(+) MTBE (1%)(+)
59 Acetone (83%)(+) Propanal (13%)(+) 2,3 Butanedione(+)(4%) 61 Acetic Acid (82%)(++) Glycolaldehyde (18%)(++)
68 Pyrrole (100%)(+)
69 Isoprene (48%)(+) Furan (42%)(+) Other Alkenes (10%)(+)
71 MVK (48%)(+) Crotonaldehyde (29%)(+) MAC (19%)(+) Alkenes (4%)(+) 73 MEK (74%)(+) Methyl Propanal (26%)(+)
75 Methylacetate(+) Hydroxyacetone(++) 79 Benzene (90%)(+) Ethylbenzene (10%)(+)
83 3-Methylfuran (84%)(+) 2-Methylfuran (12%)(+) Hexanal (2%)(+) residual (2%)(+) 87 2,3 Butanedione (80%)(+) 2-Pentanone (9%)(+) 3-Pentanone (4%)(+) Residual (7%)(+) 93 Toluene (100%)(+)
95 Phenol (85%)(++) Furans (15%)(+),(++) 97 Furans (79%)(+) Furaldehydes (21%)(+) 107 Xylenes (78%)(+) Ethylbenzene (22%)(+) 121 Trimethylbenzenes (100%)(+)
runs suggested little contribution of propyl-benzenes, how-ever further study is needed to characterize the abundance of different isomers on this ptrms masschannel.
3.2 Airborne measurements
The airborne FTIR (AFTIR) instrument sealed off and mea-sured the contents of a cell with a 1/e exchange time of 2– 3 s after flying thru the fire plume for 5–100 s (Yokelson et al., 2007). The PTR-MS instrument monitored individual masses sequentially with dwell times between 0.1 and 0.5 s while flying thru the plume. While the AFTIR sample is es-sentially a “grab sample” reflecting a line thru part of the plume, the PTR-MS sample is a series of point measurements that can be integrated over the whole plume. Fire plumes are normally internally well-mixed just 18 meters above the flames (Christian et al., 2004) and we assume that they are internally well-mixed at the altitudes relevant to airborne plume sampling (∼200–2000 m above ground): VOC ratios from the two instruments should therefore be directly com-parable, which is further supported by the synthesis of the results from the different instruments (Yokelson et al., 2007).
Fig. 8. Integrated and instantaneous ratio of methanol (MeOH)
and acetonitrile (CH3CN) concentration enhancements obtained
from the biomass burning plume shown in Fig. 7. Best fits for methanol/acetonitrile ratios are 11.0±5.0 (instantaneous) and 10±0.5 (integrated).
Figure 7 shows a typical example of a biomass burn-ing plume penetration for selected VOCs obtained by the PTRMS instrument above a fire in Mato Grosso sampled ∼1500 m above ground on 29 August 2005. Each timestamp on the x-axis indicates the beginning of a measurement cy-cle. In order to capture a plume, sampling rates greater than 1 Hz are desirable. The PTR-MS instrument was typically set up at these sampling rates, however in most cases more than one species was measured (e.g. up to 15), resulting in vari-able, sometimes longer duty cycles (e.g.‘2–18 s). In order to obtain accurate emission ratios between different VOCs mea-sured at different times, we correlated the integrated concen-trations along a flight path through the smoke plume. Fig-ure 7 also allows to asses damping effects due to sampling losses of various VOCs in the inlet line. The rise time of in-dividual VOCs in the plume shown in Fig. 7 is very similar. Methanol mixing ratios exhibited a decline in this particular plume, which were at 10% of their peak value within 3–4 s. In comparison the acetic acid concentration reached 10% of its peak value within ∼7 s. Overall this observation is con-firmed by laboratory tests, showing that sampling losses in the PTR-MS inlet design are not major.
Figure 8 shows excess methanol concentrations ratioed to excess acetonitrile concentrations for the same fire on 29 August. The dash-dotted line depicts the ratios of directly measured concentrations and the solid line reflects the ratio between integrated concentrations along the flight path. In the limit the correlation of the in-situ data and the plume-integrated data should yield the same ratio. Due to a finite duty cycle of the PTR-MS we find that the integrated emis-sion ratios are more robust. For this particular case we obtain an emission ratio of 11.0±5.0 for the direct (instantaneous) concentration correlation and 10±0.5 for the integrated con-centration correlation between methanol and acetonitrile. As can be seen in Fig. 8, the integrated concentration ratios de-crease the uncertainty due to variable timeshifts caused by sequentially measured VOCs, measurement noise and the concentration variation in a smoke plume. The path inte-grated correlation also reduces the bias due to the effect of slower rise times in the sampling line which can occur for more sticky compounds such as acetic acid.
The FTIR and PTRMS datasets were combined using methanol as an internal standard since methanol is abundant and measured with high accuracy by both instruments. Be-cause of this, we were able to calculate emission factors by the carbon mass balance method that are presented by Yokel-son et al. (2007).
3.3 Comparison of field and laboratory data
Table 2 compares VOCs emitted by burning tropical vege-tation as measured by the PTR-MS instrument under labo-ratory and field conditions. The values are expressed as a ratio to acetonitrile, which serves as a unique biomass burn-ing marker. At the outset, it should be mentioned that the
lab and field fires were significantly different. The labora-tory fires burned mostly foliage while the field fires burned a mixture of foliage and woody material. Plants are know to concentrate their nitrogen in the leaves (Ward et al., 1996). Trunks and wood typically contain less than half as much nitrogen. Our emissions measurements suggest that the lab-oratory fuels had higher nitrogen content than in the field since NH3 and NOx emissions were about twice as high in the lab (Yokelson et al., 2007; Christian et al., 2007a1). Secondly, the lab fires burned with relatively more flam-ing combustion as is shown by the study-average modified combustion efficiencies (MCEs) (0.91±0.02 for the field and 0.95±0.03 for the lab). Despite these differences in the fires, however, on average, we get remarkable agreement between the laboratory and field VOC/acetonitrile emission ratio (ratio laboratory/field is 0.99±0.31. In addition, the HCN/acetonitrile ratio, as measured by PTR-MS, did not differ significantly between the laboratory and field datasets (ratio laboratory/field=0.9). This is consistent with the ob-servation of Yokelson et al. (2003a) that the HCN emission was not strongly dependent on MCE for African savanna fires. Taken together, these observations suggest that the emission factors of HCN and acetonitrile might be less sen-sitive to the nitrogen content of the burned vegetation than can be the case for the inorganic nitrogen species, such as NH3 and NOx. Some species (m/z 33+ and 83+) listed in
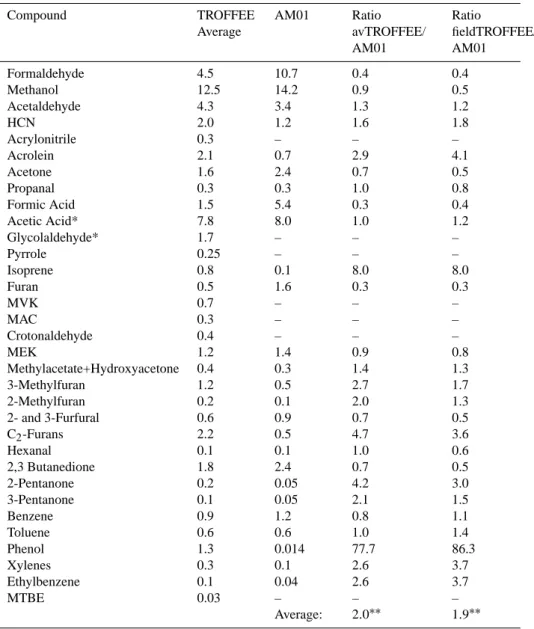
Table 2 show larger differences (>1.5). This might partly re-flect different fuel chemistry or combustion efficiencies. Ta-ble 3 shows the average emission ratio of individual species with respect to acetonitrile monitored on each PTRMS mass channel and partitioned according to the GC-PTR-MS and FTIR measurements. We used the average between emis-sion ratios obtained in the field and laboratory as well as the field emission ratios alone for a comparison with a re-cent literature review by Andreae et al. (2001b). The overall averaged emission ratio for compounds investigated in this study (not including phenol) is 2.0 times higher than emis-sion ratios for biomass burning from tropical forests recom-mended by Andreae et al. (2001b). Oxygenated compounds account for most of the higher average emission ratios com-pared to Andreae et al. (2001b); in particular the emissions of some individual compounds are significantly higher for tropical fires than values reported by Andreae et al. (2001b). Our measurements suggest that emission ratios for isoprene, acrolein, hydroxyacetone plus methylacetate, methylfurans, ethylfurans+furfural, xylenes plus ethylbenzene and phenol are higher than previously reported. In particular phenol seems to be significantly higher than values reported by An-dreae et al. (2001b). The large difference for phenol could indicate analytical challenges (e.g. sampling losses, losses in cans etc.) for conventional GC-analysis used in previous studies. In summary, formaldehyde, acetic acid, methanol and acetaldehyde are among the most abundant oxygenated species emitted from tropical fires.
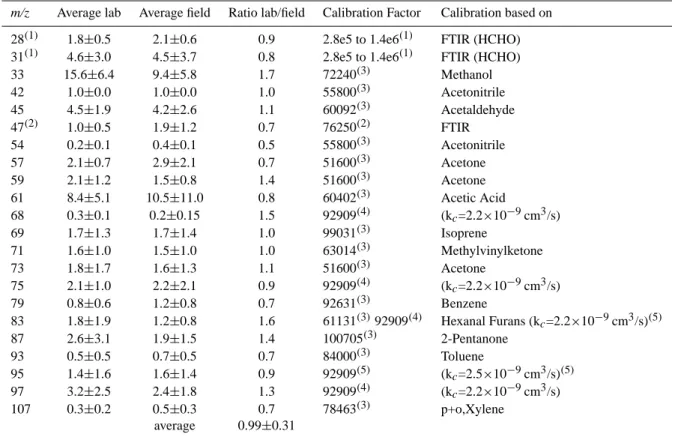
Table 2. PTRMS mass to charge (m/z) signals for all tropical laboratory fires and field data reported as a ratio (e.g. ppbv/ppbv) with respect
to acetonitrile (m/z 42+). Also listed are calibration factors (based on Eq. 1) used in this study and the method describing how these were
determined.
m/z Average lab Average field Ratio lab/field Calibration Factor Calibration based on 28(1) 1.8±0.5 2.1±0.6 0.9 2.8e5 to 1.4e6(1) FTIR (HCHO) 31(1) 4.6±3.0 4.5±3.7 0.8 2.8e5 to 1.4e6(1) FTIR (HCHO) 33 15.6±6.4 9.4±5.8 1.7 72240(3) Methanol 42 1.0±0.0 1.0±0.0 1.0 55800(3) Acetonitrile 45 4.5±1.9 4.2±2.6 1.1 60092(3) Acetaldehyde 47(2) 1.0±0.5 1.9±1.2 0.7 76250(2) FTIR 54 0.2±0.1 0.4±0.1 0.5 55800(3) Acetonitrile 57 2.1±0.7 2.9±2.1 0.7 51600(3) Acetone 59 2.1±1.2 1.5±0.8 1.4 51600(3) Acetone 61 8.4±5.1 10.5±11.0 0.8 60402(3) Acetic Acid 68 0.3±0.1 0.2±0.15 1.5 92909(4) (kc=2.2×10⁻⁹cm3/s) 69 1.7±1.3 1.7±1.4 1.0 99031(3) Isoprene 71 1.6±1.0 1.5±1.0 1.0 63014(3) Methylvinylketone 73 1.8±1.7 1.6±1.3 1.1 51600(3) Acetone 75 2.1±1.0 2.2±2.1 0.9 92909(4) (kc=2.2×10⁻⁹cm3/s) 79 0.8±0.6 1.2±0.8 0.7 92631(3) Benzene 83 1.8±1.9 1.2±0.8 1.6 61131(3)92909(4) Hexanal Furans (kc=2.2×10⁻⁹cm3/s)(5) 87 2.6±3.1 1.9±1.5 1.4 100705(3) 2-Pentanone 93 0.5±0.5 0.7±0.5 0.7 84000(3) Toluene 95 1.4±1.6 1.6±1.4 0.9 92909(5) (kc=2.5×10⁻⁹cm3/s)(5) 97 3.2±2.5 2.4±1.8 1.3 92909(4) (kc=2.2×10⁻⁹cm3/s) 107 0.3±0.2 0.5±0.3 0.7 78463(3) p+o,Xylene average 0.99±0.31 (1)corrected using FTIR HCHO calibration: see text. (2)corrected using FTIR calibration: see text.
(3)calibration factor based on measured standard using the compound listed in column 6. (4)based on a default reaction rate constant (k
c) and scaled to a measured calibration factor (e.g. acetone: (kc=3.9×10⁻⁹cm3/s)) after correcting for possible fragmentation.
(5)same as(4)but using a rate constant adopted from Zhao and Zhang, 2004.
study were higher for laboratory experiments (lab: 0.66±0. 2%) than previously published values – (e.g. (Andreae et al., 2001b): 0.25%, (Christian et al., 2003): 0.12±0.09%, (Holzinger et al., 1999): 0.13±0.07%, (Holzinger et al., 2005), 0.2 %, (Karl et al., 2003): 0.15±0.05%). Our field measurements (0. 25±0.08%) on the other hand are lower than ratios obtained in laboratory fires. Despite the differ-ence of acetonitrile/CO ratios between laboratory and field observations the VOC emission ratios with respect to ace-tonitrile (Tables 2 and 3) vary much less. In comparison the methanol/CO ratios obtained from the PTRMS instru-ment was 3.8% in the laboratory. Ground-based FTIR mea-surements of smoldering vegetation in the field exhibited a methanol/CO ratio of 4.1% (Christian et al., 2007), while airborne measurements (Yokelson et al., 2007) showed a ra-tio of 2.2%. These values compare favorably with a recent space borne methanol/CO ratio reported to be 1.6% (Dufour et al., 2007). Our observations could indicate that the CO
emissions were more variable than VOC emissions for the particular fires investigated in this study.
3.4 Emission ratios as a function of plume age
Despite the inherent variability of the initial VOC/CO emis-sion ratios from fires, there is ample evidence that photo-chemistry alters many VOC/CO ratios downwind (Goode et al., 2000; Hobbs et al., 2003; Jost et al., 2003). For example, Jost et al. (2003) report a 2 fold increase of acetone/CO ratios in a biomass burning plume over Namibia 2 hours downwind of the fire. These authors also measured a range between 6.6 and 20 for 1–10 d old plumes (ppt/ppb). Similarly, Andreae et al. (2001b) and more recently Holzinger et al. (2005) re-port acetone/CO ratios that are significantly enhanced in 3– 10 d old plumes (19.5 and 18 ppt/ppb). De Gouw et al. (2006) did not observe evidence of strong secondary production of VOCs in samples of a several days old Alaskan forest
Table 3. Emission ratios with respect to acetonitrile (ppbv/ppbv) obtained from the TROFFEE study and compared to a recent literature
review by (Andreae et al., 2001b) (AM01). Average emission ratios (column 2) are defined as the mean between laboratory and field emission ratios from Table 2. Emission factors for tropical fuels reported by AM01 were converted to emission ratios with respect to acetonitrile (ppbv/ppbv) and are listed in column 3. The last two columns depict the relative difference (ratio) between TROFFEE and AM01. avTROFFEE/AM01 (column 4) uses average emission ratios between laboratory and field measurements. fieldTROFFEE/AM01 (column 5) uses only field emission ratios obtained during the TROFFEE study.
Compound TROFFEE Average AM01 Ratio avTROFFEE/ AM01 Ratio fieldTROFFEE/ AM01 Formaldehyde 4.5 10.7 0.4 0.4 Methanol 12.5 14.2 0.9 0.5 Acetaldehyde 4.3 3.4 1.3 1.2 HCN 2.0 1.2 1.6 1.8 Acrylonitrile 0.3 – – – Acrolein 2.1 0.7 2.9 4.1 Acetone 1.6 2.4 0.7 0.5 Propanal 0.3 0.3 1.0 0.8 Formic Acid 1.5 5.4 0.3 0.4 Acetic Acid* 7.8 8.0 1.0 1.2 Glycolaldehyde* 1.7 – – – Pyrrole 0.25 – – – Isoprene 0.8 0.1 8.0 8.0 Furan 0.5 1.6 0.3 0.3 MVK 0.7 – – – MAC 0.3 – – – Crotonaldehyde 0.4 – – – MEK 1.2 1.4 0.9 0.8 Methylacetate+Hydroxyacetone 0.4 0.3 1.4 1.3 3-Methylfuran 1.2 0.5 2.7 1.7 2-Methylfuran 0.2 0.1 2.0 1.3 2- and 3-Furfural 0.6 0.9 0.7 0.5 C2-Furans 2.2 0.5 4.7 3.6 Hexanal 0.1 0.1 1.0 0.6 2,3 Butanedione 1.8 2.4 0.7 0.5 2-Pentanone 0.2 0.05 4.2 3.0 3-Pentanone 0.1 0.05 2.1 1.5 Benzene 0.9 1.2 0.8 1.1 Toluene 0.6 0.6 1.0 1.4 Phenol 1.3 0.014 77.7 86.3 Xylenes 0.3 0.1 2.6 3.7 Ethylbenzene 0.1 0.04 2.6 3.7 MTBE 0.03 – – – Average: 2.0∗∗ 1.9∗∗ ∗acetic acid/glycolaldehyde ratio based on FTIR data
∗∗excluding phenol
fire plume based on VOC/CO ratios. This could have been partly due to the fact that significant secondary production occurs within a couple of hours after emission (Jost et al., 2003). Any VOC/CO enhancement observed further down-wind could be hard to detect without knowing the primary emission ratios from the fire, which can vary significantly depending on fuel type and temporal evolution of the fire.
Due to concentrated, regional biomass burning haze during this study we were not able to follow individual plumes for more than ∼20 min, making it difficult to see sig-nificant changes in VOC ratios in specific plumes. However we can divide our dataset into 3 rough “smoke-age” cate-gories. The laboratory measurements (LM) captured smoke ∼10 s after the release. During plume penetrations (P P ) in the field we sampled the smoke composition several minutes
(∼ e.g. 1–15 min) after initial production. Transit flights through regional haze layers (H L) in the afternoon were ex-pected to probe mixed age smoke with a sample average age on the order of a few hours to a day. As expected, solely on the basis of smoke age, the emission ratios listed in Table 2 based on laboratory data and data from plume penetrations in the field compared well. We compare these initial emission ratios to VOC/acetonitrile ratios measured in the aged smoke that comprised the regional haze.
Methanol: For methanol we find ratios of 15.6±6.4 (LM),
9.4±5.8 (P P ) and 18±6 (H L). The field data suggest that the methanol/acetonitrile ratios in the aged regional haze (H L) could be almost twice as high as during plume pen-etrations (P P ). On the other hand the laboratory data (LM) show that the emission ratios in fresh plumes can be almost as high as in aged air masses (H L). This inherent variabil-ity of methanol emission ratios makes it difficult to prove that any effects are caused by post-emission photochemistry. Within the variability we do not see significantly altered ra-tios for methanol. Holzinger et al. (2005) reported an av-erage methanol/acetonitrile ratio of 19 in an aged smoke plume in Europe, which is close to our measurements. How-ever, our data suggest that secondary production of methanol might play a minor role on timescales investigated in the present study supporting conclusions drawn by de Gouw et al. (2006). Primary emission ratios can be quite variable and could explain some differences reported in the literature. The methanol to CO ratio observed in the field during TROF-FEE was 2.2%. A recent space-borne measurement of an aged burning plume reported a ratio of 1.6% (Dufour et al., 2007). These observations suggest that secondary production of methanol in biomass burning plumes most likely plays a minor role.
Acetaldehyde: We do not see a dramatic change of the
emission ratio for acetaldehyde, which are 4.5±1.9 (LM), 4.2±2.6 (P P ) and 4.2±1.7 (H L), respectively. This could be due to the fact that production and loss terms of some reactive species counter balance each other.
Acetone: The acetone/acetonitrile emission ratios obtained
from the laboratory measurements and the plume penetration flights are 2.1±1.2 (LM) and 1.5±0.8 (P P ), respectively. In haze layers we observe a slightly higher ratio of 3.0±0.8. Biogenic emissions of acetone are typically much smaller than those of methanol (Karl et al., 2004). The 30–50% increase of the acetone mixing ratio in aged smoke could support the idea that the production of this compound in the plume downwind can be important Trentmann et al. (2005). For comparison Jost et al., (2003) reported a lower range of the acetone/acetonitrile emission ratio (1 d old) of 3.9. This would be consistent with our observations if the smoke in regional haze had aged for about 1 day on average.
4 Conclusions
We investigated VOC emissions from burning vegetation us-ing PTR-MS, FTIR and GC-PTR-MS. This combination al-lowed identifying 72% of all species detected by the PTR-MS instrument over the whole mass range up to 205 amu. The results show that a wide range of oxygenated species (OVOC) are produced and dominate non-methane hydrocar-bon (NMHC) emissions from fires (OVOC/NMHC ∼4:1). Among the most abundant oxygenated compounds were formaldehyde, acetaldehyde, methanol, acetone and acetic and formic acid. We also report emission ratios for com-pounds, such as methyl vinyl ketone, methacrolein, croton-aldehyde, pyrrole and acrylonitrile, which were previously not quantified in the field and therefore not included in com-prehensive emission compilations. Polyfunctional organic compounds detected in the higher mass range but not identi-fied are present at individually small mixing ratios. Whether their summed concentration could play a significant role in gas-phase radical chemistry or partition onto aerosols due to heterogeneous losses and contribute to secondary organic aerosol formation should be addressed in future experiments. Acetonitrile proved to be a valuable marker for biomass burning and was used to normalize VOC emissions from fires. The amount of acetonitrile generated from burning vegetation in these experiments apparently did not depend on the nitrogen content of the fuel. The study average ace-tonitrile/CO ratios were 0.66±0.20% for the laboratory and 0.25±0.08% for the field measurements during TROFFEE.
Analysis of VOC ratios under laboratory, plume and haze conditions was consistent with production of some species such as acetone due to secondary chemistry in an aging plume, which needs to be taken into account for regional and global modeling exercises.
The combination of laboratory and field measurements has proven an effective way to quantify the amount and fate of biomass burning emissions.
Acknowledgements. The authors thank our pilot P. Celso and
J. Carvalho, E. Alvarado, J. C. dos Santos and G. Nishioka for excellent logistical support in Brazil. We also want to thank M. Po-tosnak for his valuable expertise in providing an automation code for the GC-PTR-MS interface and C. Grayless and T. Lemieux (University of Colorado) for providing branches from various tropical tree species. The planned fire and airborne research was supported largely by NSF grant ATM0228003. The National Center for Atmospheric Research is sponsored by the National Science Foundation.
References
Andreae, M., Talbot, R., Andreae, T. and Harris, R.: Formic and acetic acid over the central Amazon region, Brazil, 1. Dry season, J. Geophys. Res., 93, 1616–1624, 1988.
Andreae, M. O., Artaxo, P., Fischer, H., Freitas, S. R., Gregoire, J. M., Hansel, A., Hoor, P., Kormann, R., Krejci, R., Lange, L., Lelieveld, J., Lindinger, W., Longo, K., Peters, W., de Reus, M., Scheeren, B., Dias, M. A. F. S., Strom, J., van Velthoven, P. F. J., and Williams, J.: Transport of biomass burning smoke to the upper troposphere by deep convection in the equatorial region, Geophys. Res. Lett., 28, 951–954, 2001a.
Andreae, M. O. and Merlet, P.: Emission of trace gases and aerosols from biomass burning, Global Biogeochem. Cy., 15, 955–966, 2001b.
Bertschi, I. T., Yokelson, R. J., Ward, D. E., Christian, T. J., and Hao, W. M.: Trace gas emissions from the production and use of domestic biofuels in Zambia measured by open-path Fourier transform infrared spectroscopy, J. Geophys Res., 108, 8469, doi:10.1029/2002JD002158, 2003.
Blake, N. J., Blake, D. R., Sive, B. C., Chen, T. Y., Rowland, F. S., Collins, J. E., Sachse, G. W., and Anderson, B. E.: Biomass burn-ing emissions and vertical distribution of atmospheric methyl halides and other reduced carbon gases in the South Atlantic re-gion, J. Geophys. Res.-Atmos., 101, 24 151–24 164, 1996. Carvalho, J. A., Costa, F. S., Veras, C. A. G., Sandberg, E. C.,
Alvarado, E. C., Gielow, R., Serra, A. M., and Santos, J. C.: Biomass fire consuption and carbon release rates of rainforest-clearing experiments conducted in northern Mato Grosso, Brazil, J. Geophys. Res., 106, 17 877–17 887, 2001.
Christian, T. J., Kleiss, B., Yokelson, R. J., Holzinger, R., Crutzen, P. J., Hao, W. M., Saharjo, B. H., and Ward, D. E.: Comprehen-sive laboratory measurements of biomass-burning emissions: 1. Emissions from Indonesian, African, and other fuels, J. Geophys. Res.-Atmos., 108, 4719, doi:10.1029/2003JD003704, 2003. Christian, T. J., Kleiss, B., Yokelson, R. J., Holzinger, R., Crutzen,
P. J., Hao, W. M., Shirai, T. and Blake, D. R.: Comprehen-sive laboratory measurements of biomass-burning emissions, in : First intercomparison of open-path FTIR, PTR-MS, and GC- MS/FID/ECD, J. Geophys. Res.-Atmos., 109, D02311, doi:10.1029/2003JD003874, 2004.
Crutzen, P. J. and Andreae, M. O.: Biomass Burning in the Trop-ics: impact on atmospheric chemistry and biogeochemical cy-cles, Science, 250, 1669–1678, 1990.
Crutzen, P. J., Delany, A. C., Greenberg, J., Haagenson, P., Heidt, L. E., Lueb, R., Pollock, W., Seiler, W., Wartburg, A., and Zim-merman, P.: Tropospheric Chemical Composition Measurements in Brazil During the Dry Season, J. Atmos. Chem., 2, 233–256, 1985.
de Gouw, J. A., Warneke, C., Stohl, A., Wollny, A. G., Brock, C. A., Cooper, O. R., Holloway, J. S., Trainer, M., Fehsenfeld, F. C., Atlas, E. L., Donnelly, S. G., Stroud, V., and Lueb, A.: Volatile organic compounds composition of merged and aged forest fire plumes from Alaska and western Canada, J. Geophys. Res.-Atmos., 111, D10303, doi:10.1029/2005JD006175, 2006. de Gouw, J. A. and Warneke, C.: Measurements of volatile
or-ganic compounds in the earths atmosphere using proton-transfer-reaction mass spectrometry, Mass Spectrom. Rev., 26(2), 223– 257, 2007.
Dufour, G., Boone, C. D., Rinsland, C. P., and Bernath, P. F.:
First space-borne measurements of methanol inside aged tropical biomass burning plumes using the ACE-FTS instrument, Atmos. Chem. Phys. Discuss., 6, 3945–3963, 2006,
http://www.atmos-chem-phys-discuss.net/6/3945/2006/. Ferek, R. J., Reid, J. S., Hobbs, P. V., Blake, D. R. and Liousse,
C.: Emission factors of hydrocarbons, halocarbons, trace gases and particles from biomass burning in Brazil, J. Geophys. Res.-Atmos., 103, 32 107–32 118, 1998.
Friedli, H. R., Atlas, E., Stroud, V. R., Giovanni, L., Campos, T., and Radke, L. F.: Volatile organic trace gases emitted from North American wildfires, Global Biogeochem. Cy., 15, 435– 452, 2001.
Goode, J. G., Yokelson, R. J., Ward, D. E., Susott, R. A., Babbitt, R. E., Davies, M. A., and Hao, W. M.: Measurements of excess O3,
CO2, CO, CH4, C2H2, HCN, NO, NH3, HCOOH, CH3COOH,
HCHO, and CH3OH in 1997 Alaskan biomass burning plumes
by airborne Fourier transform infrared spctroscopy (AFTIR), J. Geophys. Res., 105, 22 147–122 166, 2000.
Greenberg, J., Lee, B., Helmig, D., and Zimmerman, P.: Fully au-tomated gas chromatograph-flame ionization detector system for the in situ determination of atmospheric non-methane hydrocar-bons at low parts per trillion concentration, J. Chromotogr., 676, 389–398, 1994.
Greenberg, J. P., Friedli, H., Guenther, A. B., Hanson, D., Harley, P., and Karl, T.: Volatile organic emissions from the distillation and pyrolysis of vegetation, Atmos. Chem. Phys., 6, 81–91, 2006, http://www.atmos-chem-phys.net/6/81/2006/.
Griffith, D. W. T.: Synthetic calibration and quantitative analysis of gas-phase FT-IR spectra, Applied Spectroscopy, 50, 59–70, 1996.
Hansel, A., Singer, W., Wisthaler, A., Schwarzmann, M., and Lindinger, W.: Energy dependencies of the proton transfer re-actions H3O++CH2O double left right arrow CH2OH++H2O,
Int. J. Mass Spectrom., 167, 697–703, 1997.
Hobbs, P. V., Sinah, P., Yokelson, R. J., Christian, T. J., Blake, D. R., Gao, S., Kirchstetter, T. W., Novakov, T., and Pilewskie, P.: Evo-lution of gases and particles from a savanna fire in South Africa, J. Geophys. Res., 108, 8485, doi:8410.1029/2002JD002352, 2003.
Holzinger, R., Warneke, C., Hansel, A., Jordan, A., Lindinger, W., Scharffe, D. H., Schade, G., and Crutzen, P. J.: Biomass burn-ing as a source of formaldehyde, acetaldehyde, methanol, ace-tone, acetonitrile, and hydrogen cyanide, Geophys. Res. Lett., 26, 1161–1164, 1999.
Holzinger, R., Williams, J., Salisbury, G., Klupfel, T., de Reus, M., Traub, M., Crutzen, P. J., and Lelieveld, J.: Oxygenated compounds in aged biomass burning plumes over the Eastern Mediterranean: evidence for strong secondary production of methanol and acetone, Atmos. Chem. Phys., 5, 39–46, 2005, http://www.atmos-chem-phys.net/5/39/2005/.
Jost, C., Trentmann, J., Sprung, D., Andreae, M. O., McQuaid, J. B., and Barjat, H.: Trace gas chemistry in a young biomass burn-ing plume over Namibia: Observations and model simulations, J. Geophys. Res., 108, 8482, doi: 8410.1029/2002JD002431, 2003.
Karl, T., Guenther, A., Spirig, C., Hansel, A., and Fall, R.: Seasonal variation of biogenic VOC emissions above a mixed hardwood forest in northern Michigan, Geophys. Res. Lett., 31, 2186–2188, 2004.
Karl, T., Hansel, A., Mark, T., Lindinger, W., and Hoffmann, D.: Trace gas monitoring at the Mauna Loa Baseline observatory using proton-transfer reaction mass spectrometry, Int. J. Mass Spectrom., 223, 527–538, 2003.
Kaufman, Y. J., Hobbs, P. V., Kirchhoff, V. W. J. H., Artaxo, P., Remer, L. A., Holben, B. N., King, M. D., Ward, D. E., Prins, E. M., Longo, K. M., Mattos, L. F., Nobre, C. A., Spinhirne, J. D., Ji, Q., Thompson, A. M., Gleason, J. F., Christopher, S. A., and Tsay, S. C.: Smoke, Clouds, and Radiation – Brazil (SCAR-B) experiment, J. Geophys. Res.-Atmos., 103, 31 783–31 808, 1998. Koppmann, R., Khedim, A., Rudolph, J., Poppe, D., Andreae, M. O., Helas, G., Welling, M., and Zenker, T.: Emissions of organic trace gases from savanna fires in southern Africa during the 1992 Southern African Fire Atmosphere Research Initiative and their impact on the formation of tropospheric ozone, J. Geophys. Res.-Atmos., 102, 18 879–18 888, 1997.
Lindinger, W., Jordan, A., and Hansel, A.: Proton-transfer-reaction mass spectroscopy (PTR-MS): on-line monitoring of volatile or-ganic compounds at pptv levels, Chem. Soc. Rev., 27, 347–534, 1998.
Lobert, J. M., Scharffe, D. H., Hao, W. M., and Crutzen, P. J.: Importance of biomass burning in the atmospheric budgets of nitrogen-containing gases, Nature, 346, 552–554, 1990. Mason, S. A., Field, R. J., Yokelson, R. J., Kochivar, M. A., Tinsley,
M. R., Ward, D. E., and Hao, W. M.: Complex effects arising in smoke plume simulations due to inclusion of direct emissions of oxygenated organic species from biomass combustion, J. Geo-phys. Res., 106, 12 527–512 537, 2001.
Mauzerall, D. L., Logan, J. A., Jacob, D. J., Anderson, B. E., Blake, D. R., Bradshaw, J. D., Heikes, B., Sachse, G. W., Singh, H., and Talbot, B.: Photochemistry in biomass burning plumes and implications for tropospheric ozone over the tropical South At-lantic, J. Geophys. Res.-Atmos., 103, 8401–8423, 1998. McKeen, S. A., Mount, G., Eisele, F., Williams, E., Harder, J.,
Goldan, P., Kuster, W., Liu, S. C., Baumann, K., Tanner, D., Fried, A., Sewell, S., Cantrell, C., and Shetter, R.: Photochemical modeling of hydroxyl and its relationship to other species during the Tropospheric OH Photochemistry Experiment, J. Geophys. Res.-Atmos., 102, 6467–6493, 1997.
Norman, M., Hansel, A., and Wisthaler, A.: O+2 as reagent ion in the PTR-MS instrument: detection of gas-phase ammonia, Int. J. Mass Spectrom., 265(2–3), 382–387, 2007.
Roberts, J. Williams, J., Baumann, K., Buhr, M. P., Goldan, P. D, Holloway, J., Huebler, G., Kuster, W. C., McKeen, S. A., Ryer-son, T.B., Trainer, M., Williams, E. J., Fehsenfeld, F. C., Bert-man, S. B., Nouaime, G., Seaver, C., Grodzinsky, G., Rodgers, M., and Young, V. L: Measurements of PAN, PPN, MPAN made during the 1994 and 1995 Nashville intensives of the Southern Oxidant Study: Implications for regional ozone production from biogenic hydrocarbons, J. Geophys. Res., 103, 22 473–22 490, 1998.
Singh, H. B., Salas, L. J., Chatfield, R. B., Czech, E., Fried, A., Walega, J., Evans, M. J., Field, B. D., Jacob, D. J., Blake, D., Heikes, B., Talbot, R., Sachse, G., Crawford, J. H., Avery, M. A., Sandholm, S. and Fuelberg, H.: Analysis of the atmospheric dis-tribution, sources, and sinksof oxygenated volatile organic chem-icals based on measurements over the Pacific during TRACE-P, J. Geophys. Res., 109, D15307, doi:10.1029/2003JD003883, 2004. Sinha, P., Hobbs, P. V., Yokelson, R. J., Bertschi, I. T., Blake,
D. R., Simpson, I. J., Gao, S., Kirchstetter, T. W., and No-vakov, T.: Emissions of trace gases and particles from sa-vanna fires in southern Africa, J. Geophys. Res., 108, 8487, doi:10.1029/2002JD002325, 2003.
Spanel P. and D. Smith: SIFT studies of the reactions of H3O+,
NO+and O+2 with a series of volatile carboxylic acids and esters, Int. J. Mass Spectrom., 172, 137–147, 1998.
Trentmann, J., Yokelson, R. J., Hobbs, P. V., Winterrath, T., Christian, T. J., Andreae, M. O., and Mason, S. A.: An analysis of the chemical processes in the smoke plume from a savanna fire, J. Geophys. Res.-Atmos., 110, D12301, doi:10.1029/2004JD005628, 2005.
Ward, D. E., Hao, W. M., Susott, R. A., Babbitt, R. E., Shea, R. W., Kauffman, J. B., and Justice, C. O.: Effect of fuel composi-tion on combuscomposi-tion efficiency and emission factors for African savanna ecosystems, J. Geophys. Res.-Atmos., 101, 23 569– 23 576, 1996.
Warneke, C., de Gouw, J. A., Goldan, P. D., Kuster, W. C., and Fall, R.: Validation of atmospheric measurements by proton-transfer-reaction mass spectrometry using a gas-chromatographic pre-separation method, Environ. Sci. Technol., 37, 2494–2501, 2003a.
Warneke, C., De Gouw, J. A., Kuster, W. C., Goldan, P. D., and Fall, R.: Validation of atmospheric VOC measurements by proton-transfer-reaction mass spectrometry using a gas-chromatographic preseparation method, Environ. Sci. Technol., 37, 2494–2501, 2003b.
Warneke, C., van der Veen, C., Luxembourg, S., de Gouw, J. A., and Kok, A.: Measurements of benzene and toluene in ambi-ent air using proton-transfer-reaction mass spectrometry: cali-bration, humidity dependence, and field intercomparison, Int. J. Mass Spectrom., 207, 167–182, 2001.
Yokelson, R. J., Bertschi, I. T., Christian, T. J., Hobbs, P. V., Ward, D. E., and Hao, W. M.: Trace gas measurements in nascent, aged, and cloud-processed smoke from African savanna fires by air-borne Fourier transfrom infrared spectroscopy (AFTIR), J. Geo-phys. Res., 108, 8478, doi:8410.1029/2002JD002322, 2003a. Yokelson, R. J., Christian, T. J., Bertschi, I. T., and Hao, W. M.:
Evaluation of adsorption effects on measurements of ammonia, acetic acid, and methanol, J. Geophys. Res.-Atmos., 108, 8478, doi:10.1029/2002JD002322, 2003b.
Yokelson, R. J., Karl, T., Artaxo, P., Blake, D., Christian, T. J., Grif-fith, D. W. T., Guenther, A., and Hao, W. M.: The Tropical For-est and Fire Emissions Experiment: Overview and airborne fire emission factor measurements., Atmos. Chem. Phys., 7, 5175– 5196, 2007,
http://www.atmos-chem-phys.net/7/5175/2007/.
Yokelson, R. J., Susott, R., Ward, D. E., Reardon, J., and Griffith, D. W. T.: Emissions from smoldering combustion of biomass measured by open-path Fourier transform infrared spectroscopy, J. Geophys. Res.-Atmos., 102, 18 865–18 877, 1996.
Yokelson, R. J., Susott, R., Ward, D. E., Reardon, J., and Griffith, D. W. T.: Emissions from smoldering combustion of biomass measured by open-path Fourier transform infrared spectroscopy, J. Geophys. Res.-Atmos., 102, 18 865–18 877, 1997.
Zhao, J. and R. Zhang: Proton transfer reaction rate constants be-tween hydronium ion and volatile organic compounds, Atmos. Environ., 38, 2177–2185, 2004.