HAL Id: hal-02457292
https://hal.univ-lorraine.fr/hal-02457292
Submitted on 24 Jun 2020HAL is a multi-disciplinary open access
archive for the deposit and dissemination of sci-entific research documents, whether they are pub-lished or not. The documents may come from teaching and research institutions in France or abroad, or from public or private research centers.
L’archive ouverte pluridisciplinaire HAL, est destinée au dépôt et à la diffusion de documents scientifiques de niveau recherche, publiés ou non, émanant des établissements d’enseignement et de recherche français ou étrangers, des laboratoires publics ou privés.
Distributed under a Creative Commons Attribution - NonCommercial - NoDerivatives| 4.0 International License
Pore network properties of sandstones in a fault damage
zone
Claire Bossennec, Yves Géraud, Isabelle Moretti, Luca Mattioni, Didier
Stemmelen
To cite this version:
Claire Bossennec, Yves Géraud, Isabelle Moretti, Luca Mattioni, Didier Stemmelen. Pore network properties of sandstones in a fault damage zone. Journal of Structural Geology, Elsevier, 2018, 110, pp.24-44. �10.1016/j.jsg.2018.02.003�. �hal-02457292�
Title:
Pore network properties of sandstones in a fault
damage zone
Author names and affiliations:
BOSSENNEC Claire a*, GERAUD Yves a, MORETTI Isabelle b, MATTIONI Luca b,
STEMMELEN Didier c
a) GeoRessources, Université de Lorraine, France
GeoRessources, ENSG Campus Brabois, Université de Lorraine,
2, Rue du Doyen Marcel Roubault, BP 10162, 54505 Vandoeuvre-lès-Nancy Cedex – France Mails: [email protected], [email protected]
b) ENGIE, Paris La Défense, France
1 place Samuel de Champlain, Faubourg de l'Arche, 92930 Paris La Défense cedex, France Mails: [email protected]; [email protected]
c) LEMTA, Université de Lorraine, France
LEMTA, ENSEM Campus Brabois, Université de Lorraine,
2 avenue de la Forêt de Haye, BP 90161, 54505 Vandoeuvre-lès-Nancy Cedex Mails: [email protected]
Corresponding author: BOSSENNEC Claire
Address: GeoRessources, ENSG Campus Brabois, Université de Lorraine, 2, Rue du Doyen Marcel Roubault, BP 10162, 54505 Vandoeuvre-lès-Nancy Cedex – France
Mail: [email protected], Tel: +33(0)372744513 Submitted to: Journal of Structural Geology
Keywords:
Abstract
The understanding of fluid flow in faulted sandstones is based on a wide range of techniques. These depend on the multi-method determination of petrological and structural features, porous network properties and both spatial and temporal variations and interactions of these features. The question of the multi-parameter analysis on fluid flow controlling properties is addressed for an outcrop damage zone in the hanging wall of a normal fault zone on the western border of the Upper Rhine Graben, affecting the Buntsandstein Group (Early Triassic). Diagenetic processes may alter the original pore type and geometry in fractured and faulted sandstones. Therefore, these may control the ultimate porosity and permeability of the damage zone. The classical model of evolution of hydraulic properties with distance from the major fault core is nuanced here. The hydraulic behavior of the rock media is better described by a pluri-scale model including: 1) The grain pluri-scale, where the hydraulic properties are controlled by sedimentary features, the distance from the fracture, and the impact of diagenetic processes. These result in the ultimate porous network characteristics observed. 2) A larger scale, where the structural position and characteristics (density, connectivity) of the fracture corridors are strongly correlated with both geo-mechanical and hydraulic properties within the damage zone.
1. Introduction
The understanding of fluid-flow characteristics and their controlling factors has a large spectrum of applications. These include natural risk evaluation, an understanding of mechanics of faulting, resource prospection and production (ore, hydrocarbons, geothermal resources). Much recent research has focused on understanding the characteristics and parameters (geometrical, structural, chemical) of pore, fracture and fault networks, along with their impact on flow properties (Caine et al., 1996, 2010; Wibberley et al., 2008; Faulkner et al., 2010; Loveless et al., 2011; Bense et al., 2013). A fault zone is defined as a lithological heterogeneous and structurally anisotropic discontinuity in the rock. This is caused by deformation and displacement of blocks of rock, delimiting the footwall and the hanging wall (Caine et al., 1996). In a fault zone, deformation of the rock results in different size objects from pluri-metric fractures or minor faults, to micrometric cracks. The term “fracture” or “fault” will be reserved here for metric to pluri-centimetric discontinued planes. In contrast, discontinuities of less than a centimeter will be referred as “cracks”.
The overall global structure of a fault zone includes a fault core surrounded by damage zone domains (Chester and Logan, 1986; Antonellini and Aydin, 1994; Caine et al., 1996, 2010; Heynekamp et al., 1999; Jourde et al., 2002; Fossen et al., 2005; Faulkner et al., 2010; Bense et al., 2013). The damage zone has characteristics that vary according to the rock type: 1) For brittle consolidated rocks, in the model of Caine et al. (1996) the damage zone is defined as an increased fracture density and contains minor faults compared to the protolith. 2) For porous sandstones, models of the damage zone from Heynekamp et al., (1999) modified by Loveless et al., (2011), include minor faults and deformation bands (Antonellini and Aydin, 1994; Flodin et al.,
2001; Labaume and Moretti, 2001; Jourde et al., 2002; Odling et al., 2004; Fossen and Bale, 2007; Fossen, 2010), but fractures are mostly absent.
In porous rocks, fluid flow properties are strongly influenced by the pore network geometry and its evolution during diagenesis. Significant modifications occur if these are affected by fault zones. Diagenetic processes are all post-depositional ones (e.g. physical, chemical and biological reactions to reach a physico-chemical equilibrium between grains and pore fluids). These lead to modification of sediments (Worden and Burley, 2003). The processes are ubiquitous in sandstones. They are active during burial and the possible uplift cycle of the basin; including compaction, temperature increase and lithification. They occur in both un-deformed protolith (interstitial pore fluids) and deformation zones (fractures, deformation bands, or at a larger scale on a fault core), and depend on the chemistry of the fluids, mineralogy and morphology of grains and temperature. The diagenetic processes that affect sandstones are detailed in Worden and Burley, (2003), and are merely summarized here as a reminder: 1) Authigenesis through quartz and feldspar precipitation in the pore space. Sources for silica can be assorted, such as quartz intergranular dissolution, grain chemical compaction, feldspar dissolution, smectite or kaolinite illitization (Worden and Morad, 2000; Worden and Burley, 2003; Tournier et al., 2010). 2) Mechanical compaction. 3) Dissolutions from chemical compaction and fluid leaching. 4) Neomorphysm, recrystallization and replacement of clays and feldspars: sheets of illite partially fill and compartmentalize the void spaces, especially those of micro- and meso-pores. Illite is either detrital clay mineral, or is also formed during advanced diagenesis (burial and fluid-rock interaction). The latter is issued from the transformation of smectite into illite, through intermediate mixed-layer illite/smectite; and/or is a product of K-feldspar albitization with the presence of kaolinite (Gaupp et al., 1993; McKinley et al., 2009; Worden and Morad, 2009; Fischer et al., 2012).
These processes interact with one another, because of their potential co-eval formation (Clauer et al., 2008; Worden and Morad, 2009).They have an impact on the pore network and reservoir quality of sandstones, though their quantification is rarely determined (Bjorlykke and Egeberg, 1993; Bjorkum, 1996; Worden and Burley, 2003; Eichhubl et al., 2009; Henares et al., 2016).
Transfer properties within the fault zone depend on the properties of the fault core and of the damage zones. In the latter, the permeability parallel to the fault can be enhanced using the fracture network (Fossen et al., 2007; Bense et al., 2013). Hydraulic behavior of the damage zone depends on distinct factors, which are scale-related:
1) Concerning the fracture network scale; namely its geometry, length and aperture distribution of fractures, orientation, density, connectivity, and infilling of micro-structures. The drain effect of the fracture network in the damage zone has to be nuanced by taking into account the local heterogeneities enhanced by diagenetic processes specific to fault zones. Faults and fractures can be cemented (partly or completely), and lead to a compartmentalization of the reservoir (Jolley et al., 2010).
2) At the scale of the pore network, faulting results in changes of grain shape and size (physical and chemical compaction, cataclasis) (Schueller et al., 2013; Farrell and Healy, 2017), and increased cementation (a higher surface of quartz is available to cement nucleation). In sandstones, where intergranular spaces represent the large majority of the total porosity, cataclasis and compaction, combined with cementation, can change the amount of porosity, and its pore size distribution. This directly impacts on the permeability of the media.
The fault models presented above are not applicable to all rock types, and do not take into consideration the multi-scale impact of both deformation and diagenetic
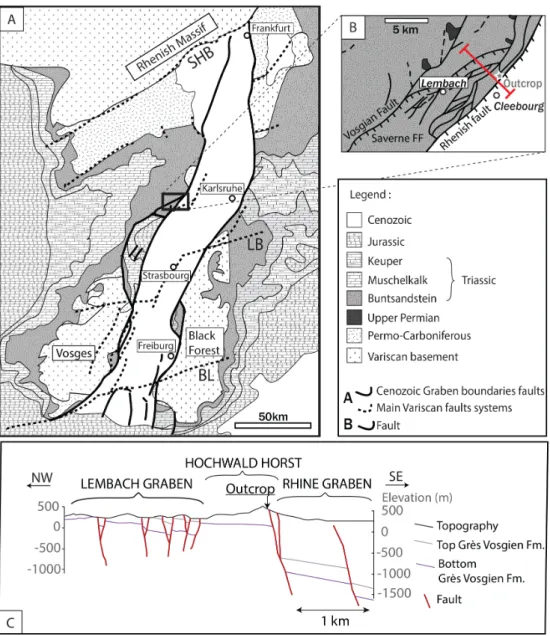
processes. For example, the model for porous sandstones (Loveless et al., 2011) indicates deformation bands in the damage zone. These are not observed in our case study. We propose here another type of fault damage zone model for lithified porous sandstones in a normal faulting context, for the faulted sandstones of Cleebourg (GPS coordinates: 32U, 418833 E, 5429554 N) (Fig. 1).
In this paper, we integrate the characterization of sedimentary and diagenetic heterogeneities, and the spatial organization of the structural features. Thus we can estimate their control on hydraulic and geo-mechanical properties. Our results suggest that transfer properties of the fault zone depend on macrostructure organization (fracture corridors, micro-faults). This organization controls the microstructure of rock (sedimentary and diagenetic characteristics), and associated grain scale pore network properties. Here, we show that the distance to the fault-core, and the fracture network characterization at the fault scale, are not sufficient to describe and understand transfer and geo-mechanical property distributions. The characterization of the evolution of the pore network properties requires investigation at both intermediate scale of a single fracture and that of grain scale (variable diagenesis of the pore network). We also demonstrate that this multiple embedded boxes approach is useful to understand the distribution pattern of hydraulic and geo-mechanical properties within the damage zone, and its implications in terms of fault zone behavior.
After defining the geological context of the case study, the results obtained by applied methodology will be presented. These will be specifically on aspects of petrography, porous network properties (combined X-Ray, MIP and NMR quantification), crack pattern, P-waves, and Young’s Modulus properties. These results are discussed in terms of multi-parameter integration. Thus the effects of properties and damage-zone compartmentalization, of sedimentary and diagenetic heritage, of fractures and
modification of the porous network through cracks, and fluid/rock interactions on fluid flow can be deciphered.
2. Geological settings
2.1.1.Regional geology
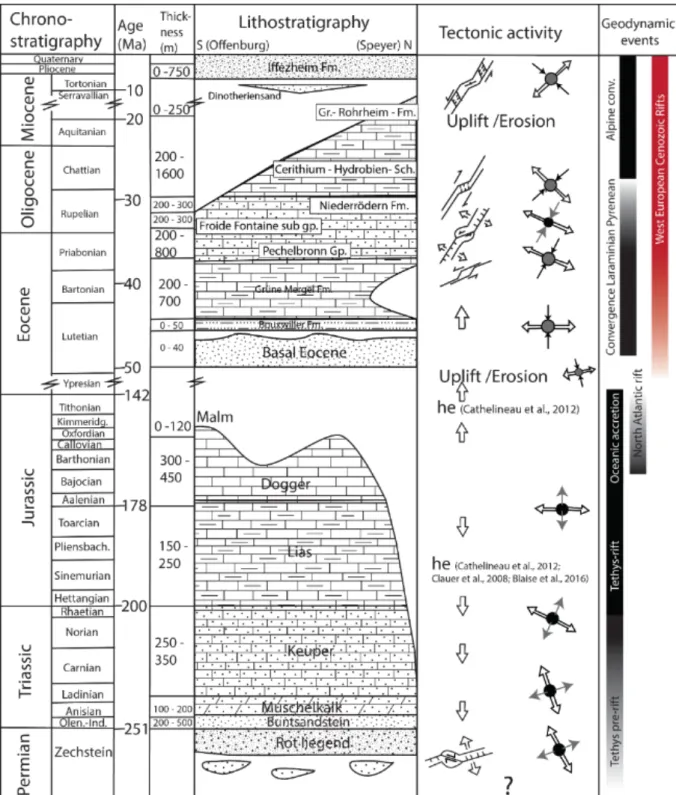
The Upper Rhine Graben (URG), with a 300 km length and 40-50 km width in a NNE-SSW to N-S trend (Fig.1), is a typical example of syn-orogenic Cenozoic continental foreland rifting (Ziegler, 1992; Merle and Michon, 2001; Bourgeois et al., 2007; Edel et al., 2007; Ford et al., 2007; Ziegler and Dèzes, 2007). The URG is limited by the Vosges and Black Forest massifs, respectively constituting the western and eastern shoulders. To the north, the URG is bounded by the Rhenish Massif, and to the south by the Jura Massif, a folded alpine structure. This basin is segmented into several sub-basins, which are delimited toward the URG axis by oblique faults. The stratigraphic column of the URG area is presented in Figure 2, with associated insight into the regional tectonic calendar.
The group studied is the Buntsandstein Gp., also known locally as “Grès Vosgien Fm”, which dates from the Early Triassic (Olenekian) period. Due to its high porosity, this group constitutes often a good reservoir for both geothermal and hydrocarbon resources (Haffen, 2012; Haffen et al., 2015; Böcker et al., 2016). These Early Triassic sandstones were deposited in fluvial and playa-lake systems, at the southern border of the Western Germany sag basin (Bourquin et al., 2006, 2009; Soyk, 2015).
The Buntsandstein Gp. forms the bottom of the sedimentary pile topping the basement. These sandstones have undergone a complex burial history and associated diagenetic events (Clauer et al., 2008; Dresmann et al., 2010; Blaise et al., 2016). The area of the future URG was in subsidence from the Triassic to Jurassic eras (Ziegler, 1990, 1992).
This phase was followed by an uplift-erosion phase from the Cretaceous to Early Eocene periods. At the Late Eocene period, a first phase of left-lateral shears started, along the Paleozoic inherited fault system (Ziegler et al., 2004; Edel et al., 2007). Several sub-basins developed and nucleated, with a NNE-SSW orientation. These were sub-parallel to σ1
,
the major horizontal stress. During Oligocene, the major riftphase took place. During Early Oligocene, there was an activation (or even reactivation) of regional fault systems, in a normal displacement (Schumacher, 2002). The minimum principal stress σ3 is estimated to be horizontal and oriented WNW-ESE
(Schumacher, 2002; Derer et al., 2005), with subsidence in the URG Basin, and uplift and erosion on the Graben shoulders (Timar-Geng et al., 2006; Dresmann et al., 2010; Brockamp et al., 2011). During Late Oligocene, the regional stress field evolved towards a σ3 oriented NE-SW, accompanied by sinistral shearing displacement along
the major faults oriented NS. From Miocene to current times, the global stress field returned to its initial configuration, accompanied by left-lateral shear, and the development of small pull-apart basins. It maintained the uplift of shoulders of the Vosges – Black Forest Massif areas (Schumacher, 2002; Ziegler et al., 2004; Timar-Geng et al., 2006). These listed tectonic events initiated and/or reactivated fault zones and fracture networks, and involved superficial and deep fluid flows (Lampe et al., 2001; Stober and Bucher, 2015).
‘Insert Figure 1 here’ ‘Insert Figure 2 here’
2.1.2.Outcrop localization and structural context
On the western border of the URG, the Saverne Fracture Field (SFF) is delimited by the Vosgian Fault and Rhenish Fault (Eisbacher and Fielitz, 2010). These two major faults delimit normal conjugate to left-lateral shear fault systems, forming a set of small horsts and grabens, tilted eastward. This configuration allows the outcropping of deeply buried reservoir analogs, from Permian up to Jurassic deposits.
On the N-E extremity of the SFF, the Lower Triassic formations outcrop on the western part of the Hochwald Horst (Fig. 1.B, C). The outcrop studied is the quarry of Cleebourg that is exploited for ornamental stones. In terms of stratigraphy, the “Grès Vosgien Fm” outcrop of Cleebourg belongs to the Lower Buntsandstein Formation (Ménillet et al., 1989; Bourquin et al., 2006) (Fig. 2). These sandstones are described as fine to medium grained sandstones, with a relatively good sorting. Selected strata for sampling show a fully pervasive bleaching, described as “Haardtrand Fazies” (Soyk, 2015), and belong to playa-lake sand sheet deposits.
The northern face of the quarry consists of a large fault zone, well described by Bauer et al., (2015), with a 14 meters thick inner fault core, surrounded by a 5 meters thick outer fault core. This outer fault core zone is surrounded by a 40 meters thick damage zone, from which the external limit is not outcropping. The inner core zone is constituted of multiple slip surfaces, deformation bands and fractures, separating different units with different lithologies (clays, silts, and sands) and in various consolidation states. The outer core zone is characterized by high densities of fractures separating less deformed host-rock lenses. The border between the fault core and the damage zone is clearly defined by a slip surface. Despite the high porosity of the sandstone, the deformation in the damage zone is mostly brittle, with fractures
distributed in corridors, with higher fracture intensity, and some associated minor faults. Some fractures present slight to strong brown iron hydroxide staining.
3. Sampling and analytical procedure
3.1. Damage zone features and sampling
The word matrix as used here describes the porous media in the rock from which fracture porosity is excluded (rock matrix) (Warren and Root, 1963). To decipher the impact of fractures on matrix properties (in terms of diagenetic heterogeneities and hydraulic behavior), the area selected for sampling was restricted to two continuous sedimentary layers in the damage zone of the fault zone. The core zone (comprising the inner and outer fault core) was not considered, due to weak outcropping conditions and poor lithification.
In the damage zone, 22 samples were collected as oriented plugs and blocks. Aiming to link diagenetic process variations with hydraulic and mechanical rock property changes, we performed the following measurements and observations: petrography, petro-physical, and elastic rock properties determination. Uncertainty remained on initial properties of the protolith in the area, as the outer border of the damage zone was not outcropping.
3.2. Petrography for diagenetic sequence determination
Standard 30 µm-thick polished thin sections were prepared for petro-structural analysis. Special focus has been directed towards quartz cementation quantification, through cathode-luminescence observations performed on a cold cathode cathodyn OPEA with a 10-12kV, intensity 6, and 250-300 µa. Cathodoluminescence allows generations of quartz cements, grain deformation, and recrystallization to be determined easily. At the pore scale, the deformation of grains was described in terms
of microstructure. Combined secondary electron microscopy (SEM) analysis of micro textural habits and X-Ray Diffraction results were used to decipher clay types and proportions. Attention was paid to petrography, to determine spatial heterogeneities in terms of diagenetic processes, both in matrices and fractures. Mineralogy is expressed in percentage of total surface area on thin section, and determined by computer assisted point-counting (minimum 300 per picture, 4 pictures per sample).
3.3. Fracture network characterization methods:
Fracture network characterization at the outcrop scale is based on the results collected on cross-section H1 by Bauer et al., (2015) and the methods described therein.
3.4. Crack networks at the thin-section scale
Crack intensities were characterized in two ways, adapted from Nelson (2001): • Number of cracks per meter (i.e. P10). This was quantified by counting, with a
constant scale of observation (magnification = 200), the number of cracks crossing a 2 mm long scanline on a thin-section picture with the same orientation as the outcrop scanline.
• Total length of cracks per surface unit (i.e. P21). This was measured by selecting 4 spots of 1 mm diameter for each thin section, all the cracks being visible at a constant scale of observation (magnification = 200).
3.5. Porosity and permeability 3.5.1.Porosity
Porosity using water and gas saturation was determined using a helium pycnometer and triple mass methods. Water and Helium porosity gave a value of connected porosity.
Mercury Injection Porosimetry (MIP) (Ritter and Drake, 1945) was performed to compute the distribution of porosity versus threshold size. The experimental process was divided into three steps: (1) a first drainage with varying pressure from 0.003 MPa to 220 MPa, allowing the measure of pore throat radii distribution to the smallest pore throats of 0.001 µm; (2) imbibition; (3) second drainage. This protocol was applied to 3 to 4 cm3 small cores from all the samples, using Micromeritics AutoPore IV, with pore
throat radii measure accuracy from 0.003 to 500 µm. Equilibrium time settings were 20 s for low pressure cell (0.003 MPa to 0.2 MPa), and 60 s for high pressure cell (0.2 to 220 MPa).
3.5.2.Permeability
Permeability measurements were carried out using two methods: 1) On the outcrop directly with a transportable air-permeameter Tiny Perm (II) 2) in the laboratory, on sampled plugs using a Nitrogen permeameter, with a Hassler cell, at a confining pressure of 1.5 MPa and stabilized atmospheric foot pressure, establishing a steady state gas flow. At least 8 steps of head pressure were measured per sample, and the Klinkenberg correlation was applied to correct measurements from gas-slippage (Klinkenberg, 1941). Permeabilities were estimated in millidarcy (mD).
3.6. Elastic rock properties and deduced mechanical properties
To estimate mechanical rock properties, propagation velocities of P- and S-waves were measured, on 16 dry samples, with 250 kHz electrodes installed on the PunditLab Proceeq ® tool. Dynamic Young’s Modulus, Poisson’s ratio and the fissuration ratio were calculated, to estimate variations of rigidity and compressibility of the media, and
to estimate the effective amount of fractures in the media. To determine Poisson’s ratio (ν), Eq. (1), and Young’s Modulus (E), Eq.(2), formulae are the following (Homand et al., 2000): 𝜈 = ! "!" #$ #%# " $!"#%#$#" (1) 𝐸 = 𝜌%&²($)*)($!,*) $!* (2)
These dynamic moduli differ from static moduli by their method of establishment. Static moduli are defined according to the results of a mechanical experiment as compression/shear tests, whereas dynamic moduli are based on acoustic properties. Within the theory of elasticity, both methods should have given identical results. Though for rock media, which are not perfectly elastic, differences were observed between static and dynamic moduli (Homand et al., 2000). These differences were explained by a strain value effect. The strain value (a dimensionless value, which is a function of displacement divided by the wavelength) of both methods differed from 10 -8 to 10-6 for dynamic to a minimum of 10-4 for static methods (Zinszner and Pellerin,
2007).
The P-wave propagation is perturbed by crack porosity. The measure of the P-wave propagation velocity was used to estimate the rate of open discontinuities in the sample. Fissuration rate (FR) determination was based on the continuity indicator (IC), defined as the ratio of measured P-wave propagation velocity Vp on Vp*. Vp* is the
P-wave propagation velocity calculated from the mineralogical content, as the arithmetic weighted mean of Vi, propagation velocity in each mineral phase, and the coefficient
of weight Ci, as a proportion of the mineral phase i in the whole rock, Eq.(3), (Homand
et al., 2000). For non-cracked rocks, IC, written ICp, was defined by the experimental
defined in Eq.(5), as the relative difference between the ICp (for non-cracked rocks) (Eq.(4)) and IC calculated from Eq.(3).
𝐼𝐶(%) = 100%&%&∗, with 𝑉&∗ = ∑ 𝑐
.𝑉&,.
. (3)
𝐼𝐶𝑝 = 100(1 − 1.4𝜙) (4) 𝐹𝑅 = 1 −01&01 (5)
3.7. Nuclear Magnetic Resonance (NMR) relaxometry
Nuclear Magnetic Resonance (NMR) methods are based on the measurement of the magnetization decay of water molecule hydrogen nuclei and were helpful to estimate the real pore size distribution (Dunn et al., 2002; Zinszner and Pellerin, 2007; Yao et al., 2010; Vincent et al., 2011; Faÿ-Gomord et al., 2016).
In this study, T2, e.g. the transverse relaxation time along a plan perpendicular to B0, was used, and measured with a Carr-Purcell-Meiboom-Gill sequence (CPMG), at regular time intervals 2τ (or TE) of 150 µs. The diffusion processes were supposed to be fast, and the inter-echo times (TE) used in experiments were very low. Thus, the term of diffusivity can be neglected in Eq. (6) of T2 concerning V/S, (respectively the compartment of porous media volume and surface):
$ 2" = $ 2"'()*+ 𝜌3 4 %+ (2567)"8 $, (6)
where T2 bulk is the bulk relaxation time of free water (2.6 s at 25°C), and ρs the specific
surface relaxivity (constant for each sample, determined by calibration with X-ray tomography data, see section 3.9). TE is the inter-echo time, γ the gyromagnetic ratio, G the average local magnetic field gradient, and D the auto-diffusion coefficient of the fluid.
Considering a model of spherical particles, pore radii were approximated from equation (7). Combining equations (6) and (7), the void radius was expressed as a proxy of relaxation time, as written in equation (8).
4 % ≈ 9 : (7) $ 2" = $ 2"'()*+ 𝜌3 9 : (8) 3.8. X-ray micro-tomography
The porosity quantification by crossed use of X-ray tomography and MIP is strongly dependent on the scanning resolution (Peng et al., 2012). X-ray tomography imaging was thus performed on a Phoenix Nanotom S ®, at the highest resolution, i.e. with a magnification of 250. This allowed a resolution of 1 voxel = 1 µm3. Five representative
samples of the different facies, with small chips of 3*5*3 mm, were analyzed to calibrate the meso-pore network characteristics (connectivity, percentage of porosity, tortuosity, and equivalent pore radius).
The 3D image of each sample was treated with VG Studio software (Volume Graphics), to extract the porosity and estimate volume, surface, and sphericity. Equivalent radii could be determined from the volume and sphericity for each connected volume, assuming a pore to be a deformed sphere. These connected volumes are added from the largest to the smallest, to build an equivalent of an X-ray cumulated porosity curve.
3.9. Combination of pore access size (MIP) and pore volume quantifications (NMR and X-ray tomography)
A major challenge was the building of a porous network model that integrated the throat distribution obtained with MIP, and the void size determined from NMR measurements
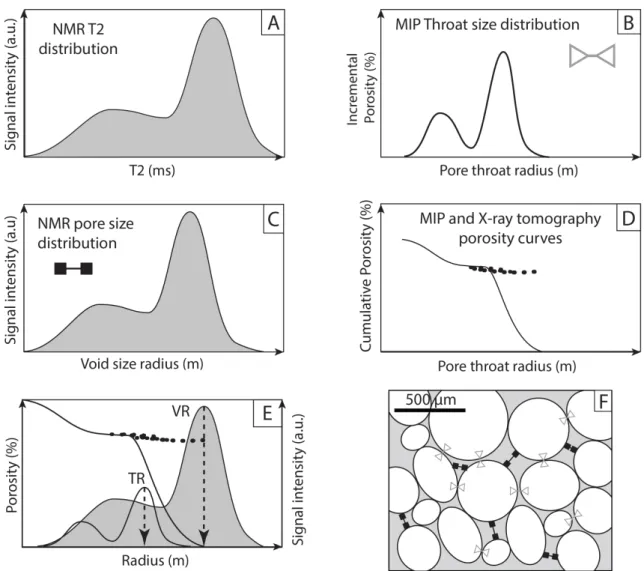
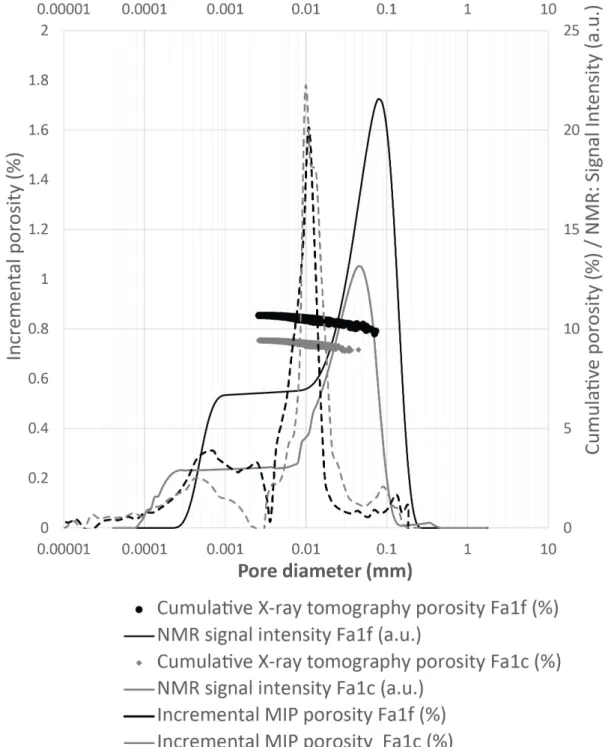
and X-ray tomography images. Previous studies presented computed data on pore networks of X-ray, tomography, SEM (Bera et al., 2011), and energy dispersive X-ray spectroscopy (EDS) (De Boever et al., 2015). The methodology we proposed combined MIP, NMR, SEM and X-Ray tomography data on pore fabric, and is illustrated in Figure 3.
NMR T2 distribution was converted into an equivalent pore radius distribution and was
superposed onto X-ray pore size distributions that fitted large pore sized MIP cumulative porosity curves (>20µm). The largest pores observed by X-ray tomography corresponded to the NMR and MIP first peak. Thus, using this calibration, quantification of smaller pore size by NMR data was then possible. Such pores had not been directly detected by X-ray tomography. A comparison of NMR and MIP results allowed the quantification of several small pore families and pore network parameters (e.g. pore throat size, void size, tortuosity, and surface). Quality control with SEM imagery confirmed the correct size for the void dimension determined by NMR and MIP.
‘Insert Figure 3 here’
4. Results
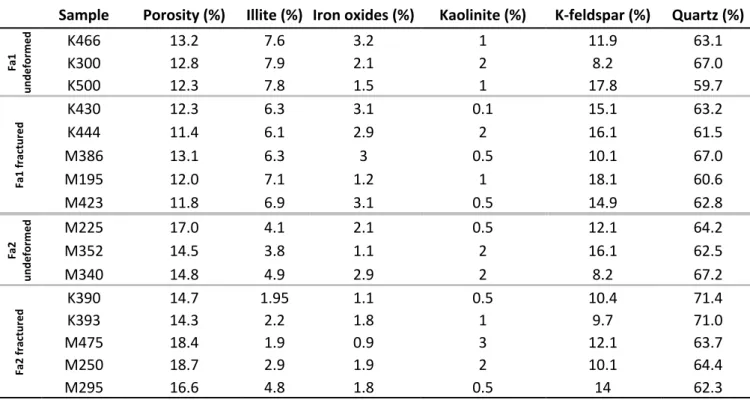
The total rock mineralogy, diagenetic steps, and pore network morphology were described through thin section petrography, MIP and SEM analysis. Detailed mineralogical compositions were determined by point counting on thin sections (Table 1). First, a description of the sedimentary and diagenetic facies is presented. The structural aspect of the petro-facies will then be described, along with associated pore network, crack patterns and petro-physical properties.
4.1.Fracture network in the damage zone
4.1.1.Fracture network at outcrop scale (Fracture P10)
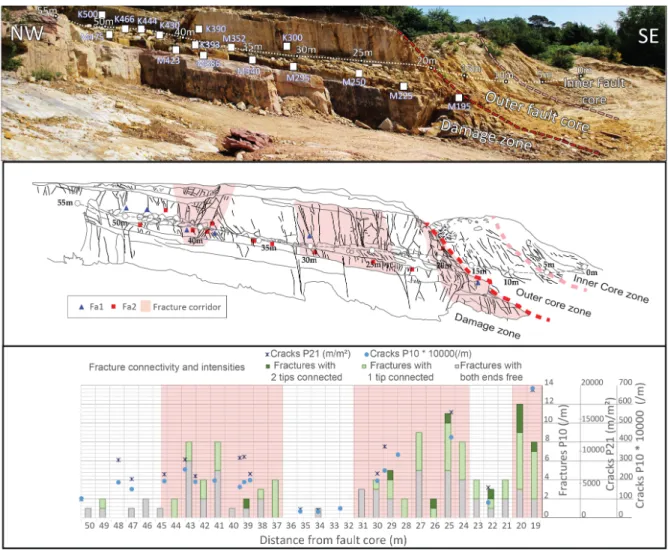
As detailed by Bauer et al., (2015), the damage zone outcropping at the north wall of the quarry is affected by a fracture network, in which three corridors are identified (Fig.4). Fractures are mostly fault synthetic (dip ESE; strike-direction: NNE-SSW), with a secondary minor orthogonal fracture set (strike N-S and E-W). Corridors are defined here when fracture intensity is higher than 4, for two successive one-meter intervals. Due to the presence of protolith lenses on the scan line, some intervals in the corridors can have lower fracture densities. The corridor (1) starts in direct contact with a slip surface delimiting the outer fault core. This corridor starts at the distance of 19 m, and finishes at the distance of 21 m from the inner fault core datum. The deformation is the most developed in this corridor, with up to 12 fractures/m, and an average of 10 fractures/m. This fracture corridor contains two minor antithetic faults, and one minor synthetic fault, relative to the major fault. Displacements of the minor faults ranges from 2 to 6 cm. The second corridor, located between distance 24 m and distance 30 m contains intervals with a fracture density of between 2 and 11 fractures/m, and average density of 5.85 fractures/m. This corridor also includes a minor fault, synthetic to the major fault core. The third corridor, located between distance 37 m and distance 44 m has a fracture density from 1 to 8 fractures/m, and an average density of 4.28 fractures/m. Connectivity between fractures increases toward the fault core and is enhanced in the corridors (with more than 50% of connected fractures). The fracture corridors have an average lateral thickness of 5 meters, and the distance between corridors tends to decrease toward the fault core.
4.1.2.Crack intensity as number of cracks (/m) (P10)
P10 Crack intensity values range from 3.9x10⁵ to 65.7x10⁵ cracks/m (Fig. 4.C). The
crack intensity is higher for samples from fractured corridors than in samples from low fracture intensity blocks, where intensities are less than 10x105 cracks/m. Three
high-crack intensity corridors are identified on both high-crack and fracture intensity profiles (Fig. 4C).
4.1.3.Total crack length (m/m²) (P21)
Total crack length intensity (P21) values range from 1345 to 18530m/m². Three
high-fracture intensity corridors are recognized, with P21 above 2000 m/m².
Crack intensity distributions (P21 and P10), represented in Figure 4C, show the same trend, with slightly higher peaks for P21, in samples where cracks are well-developed and propagated through longer distances, with intergranular cracks. The envelopes for crack and macro-fracture P10 intensities are similar.
4.2. Damage zone characterization: 4.2.1.Petrography
Samples can be divided in two lithofacies (Fa1 and Fa2) with respect to their mineralogical and pore network features. Both petro-facies are present in the two strata sampled, equally in low fractured areas and in fracture corridors.
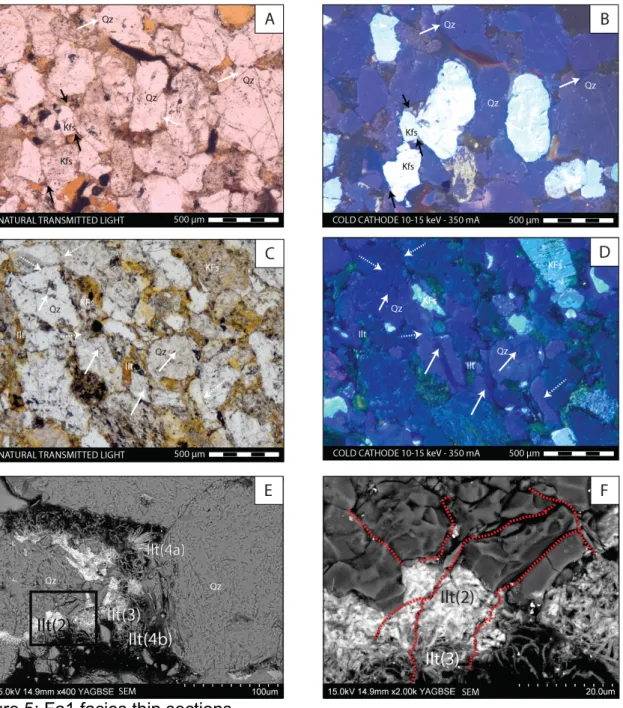
The first facies Fa1 (Fig. 5, Table 1), is characterized by a medium to fine sub-mature sandstone, with average grain size ranging from 220 to 350 µm, and porosity from 11.43 to 13.4%. The framework is mainly composed of quartz (58.5 to 67 %) and K-feldspar (8.2 to 18.1 %) sub-angular to sub-rounded grains with well-developed clay coating and rare thin syntaxial cements (0.6 to 2.6%) on both quartz and feldspar grains (average cement thinner than 20 µm). Illite contents vary between 7.6 and 7.9%.
Illite is present as a coating of grains and as pore infill, and has two morpho-types mixed with varying iron hydroxide contents (varying intensities on SEM, and semi quantitative EDS from respectively 4.3 and 16.7 Fe2O3 wt.%). Kaolinite was observed in very low amounts (less than 3%) on feldspar rims and inside cracks in the feldspar grains and cements.
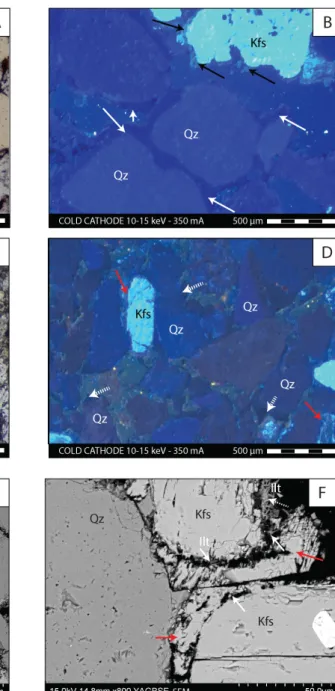
The second facies, Fa2 (Fig. 6, Table 1), is a medium to coarse sandstone, with an average grain size ranging from 350 to 490 µm. Fa2 has thinner illite coatings, and a larger amount of quartz and feldspar diagenetic syntaxic cements (from 5.3 to 9.9 %, with an average thickness for cement between 30 and 60 µm). As for Fa1, the framework is made of sub-rounded grains of quartz (62.3 to 71.4%) and K-feldspar (9.7 to 16.1%). The illite content remains between 1.9 and 4.9%. The same illite morphotypes as described for Fa1 are present in Fa2. The first two morphotypes of illite are relatively similar, consisting mostly of tangled ribbons associated with iron and titanium hydroxides (SEM – XRD) (Fig. 5). A third illite morphotype present in fractured samples has a fibrous habitus.
‘Insert Figure 5’ ‘Insert Figure 6’
4.2.2.Pore network and hydraulic properties
The distributions of pore throats (MIP) and pore size (NMR, tomography) for all facies are both bi-modal, suggesting at least two families of pore voids (P1) and (P2) and two families of throats (S1) and (S2) with the following characteristics (Fig. 7, Table 2), For undeformed Fa1 samples, (S1) has a throat diameter of 1.14 to 2.39 µm; (P1) a pore size of 8 to 20 µm. This family represents 24 to 28 % of the total porosity; (S2) has a throat diameter of 16.15 to 22.59 µm; (P2) a pore size of 55-105 µm. For Fa1, this family represents 72 to 76 % of total porosity.
Pore network properties of fractured Fa1 samples are similar to undeformed facies in terms of bi-modal distribution of pore and pore throat diameters, with the following features (Fig. 7): here the f index indicates fractured facies.
(S1f) has a throat diameter of 0.69 to 1.87 µm; (P1f) a pore diameter of 5 to 12 µm. This family represents 25 to 77 % of the total porosity. (S2f) has a throat diameter of 9.85 to 12.57 µm; (P2f) a pore diameter of 38 to 50 µm. This family represents 23 to 75 % of the total porosity. Total porosities of fractured and undeformed Fa1 facies are similar, at around 12 %. The permeability for fractured Fa1 sandstone varies from 42 mD up to 235 mD (average 142 mD), and is higher than for low-fractured Fa1 sandstones (with permeability ranging from 28 to 60 mD, average 40 mD).
Similar to Fa1, undeformed Fa2 sample distributions of pore throat and void sizes are bi-modal (Fig. 8, Table 2). However, the ranges of families (P1) and (P2) differ slightly for Fa2 facies, with the following values: (S1) has a throat diameter of 0.45 to 0.66 µm; (P1) a pore size of 5.9 to 8.2 µm representing 12 to 38 % of the total porosity. (S2) represents a throat diameter of 18.8 to 25.5 µm and (P2) a pore size of 120 to 135 µm. (P2) represents 62 to 88 % of the total porosity.
Pore network features for fractured Fa2 facies have the following values (Fig. 8): (S1f) with a throat diameter of 1.23 to 3.17 µm; (P1f) void diameters from 11.2 to 17.1 µm. This family represents 12 to 44 % of the total porosity. (S2f) corresponds to a throat diameter of 22.3 to 34.5 µm, and (P2f) void diameter ranges from 45 to 130 µm. This family represents 56 to 88 % of the total porosity. Porosities of fractured and undeformed Fa2 facies are equivalent, ranging from 14.3 to 18.7 %, with an average of 16.1 %. The permeability of undeformed Fa2 samples ranges from 100 to 164 mD (average 132 mD), and that of fractured Fa2 samples from 139 to 845 mD for (average 480 mD).
‘Insert Figure 7’ ‘Insert Figure 8’ ‘Insert table 1’ ‘Insert table2’
4.2.3.Geo-mechanical properties
Mechanical properties were calculated for each sample from measurements of Vp and
Vs (for propagation velocities, see Table 3). The profiles are represented in Figure 9,
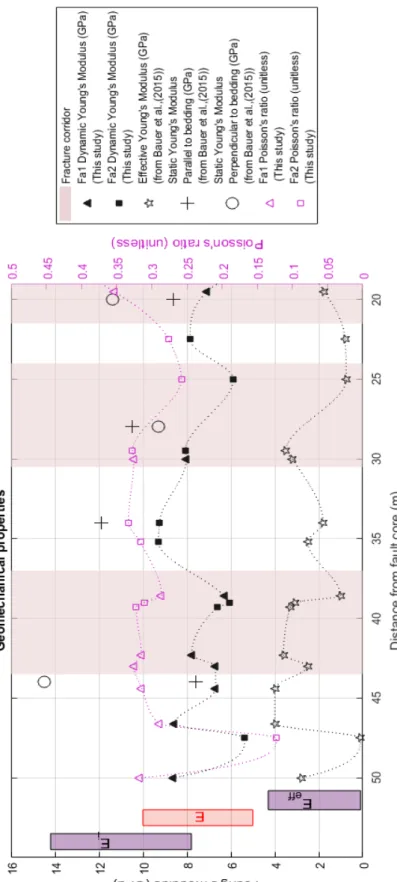
and values are listed in Table 3. For Fa1 samples, dynamic Young’s Moduli E values range from 6.28 to 8.62 GPa, and for Fa2 samples, from 5.36 to 9.29 GPa. With respect to their location within the damage zone, E range from 5.36 GPa in fracture corridors up to 9.29 GPa in low fractured blocks (Fig. 9) and globally decrease toward the fault core. Poisson’s ratios are relatively constant (at around 0.3), with no clear relationship between micro-fracture intensity or macro fracture intensity, nor with distance from the fault core. Both facies have fissuration ratio values of between 29 and 47 %. For Fa1the fissuration ratios are on average higher than for Fa2 (respectively av. 42 % and av. 35%)).
‘Insert Figure 9’ ‘Insert Table 3’
5. Discussion
The impact on rock properties of the presence of fracture corridors and differential diagenetic evolution in the damage zone can be described by a three embedded scales model: 1) at the grain scale, micro-fractures modify pore network properties; 2) at the scale of one fracture and its own volume of influence, dynamic mechanical properties of rocks are affected by micro-fracturing; 3) at the scale of damage zone, overprinting
of each corridor occurs. Furthermore, deformation has an impact on rock properties at the scale of the entire damage zone, leading to heterogeneous hydraulic behavior.
5.1. Diagenetic para-sequences
Through observations of thin sections (using optical microscopy and SEM), a diagenetic sequence has been built up (Fig. 10) that is consistent with diagenetic sequences previously reported in the literature (Haffen, 2012; Blaise et al., 2013; Soyk, 2015).
During the early stages of burial, a clay-ferruginous grain coating is established, (phase (I)). The nature of the original clay mineral remains unknown. However, according to depositional environment and other mineral phases observed, it might be a kaolinite coating as described by Surma et al., (2003), or a smectite/illite coating, which was then fully transformed into Illite (1), as proposed in other studies (Clauer et al., 2008; Blaise et al., 2016).
Phase (II) is a cementation phase, occurring on feldspar grains with the formation of feldspar syntaxial cement, followed by quartz cementation (quartz overgrowth around the grains surrounded by thin illite coatings) (Fig. 5,Fig. 6).
Phase (III) consists of the illitization of several mineral phases, and is divided into several steps for each mineralogical contemporaneous reaction with the same reactants and products, and the same temperature required (above 80°C). It is probably preceded by a kaolinitization phase of feldspar grains and cements.
Morphotypes of illite (2) and (3) are relatively similar, consisting mostly of tangled ribbons associated with iron and titanium hydroxides (SEM – XRD) (Fig. 5). All previously described phases are present in all samples, irrespective of facies and fracture density. It is thus possible to group phases I, II, and III, as prior-to-fracture diagenetic events.
Phase (IV) is only described for fractured facies, where several later diagenetic processes occurred. For samples from low fractured blocks, post-fracture illite precipitations are observed in pores. This morphotype of illite (4a) is fibrous with a completely different morphology to illites (1), (2), and (3) and is not combined with any hydroxides.
For highly fractured samples, feldspar and quartz cements are partly dissolved, forming their current border morphology. Cements present combined micro-fractures and dissolved zones. In these cavities a later precipitation of small sheets of illite crystals, a morphotype of illite (4b), occurs. In several samples from highly-fractured domains, generation (4a) of illite has also been observed. Unfortunately, no geometrical arrangement allowed the discrimination of which of generations (4a) or (4b) occurred first. A latter pore-infilling kaolinite is observed at a very low quantity (<3 %) in 4 samples containing a macro-fracture.
‘Insert Figure 10’
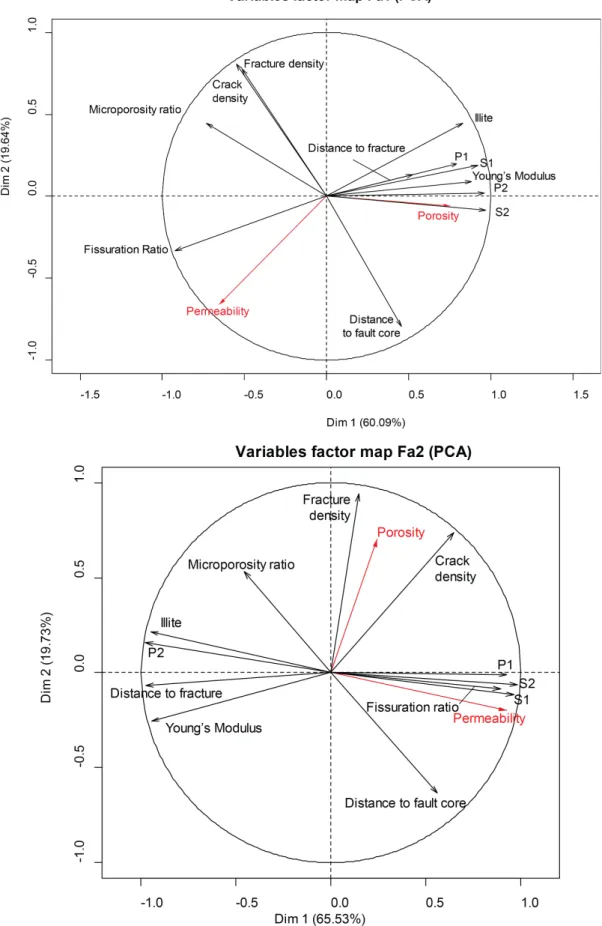
5.2. Microstructural and petro-physical property relationships
To better decipher the interdependency between fracture distribution visible at a
macroscopic scale, pore network features, microstructural characteristics, and
permeability, a Principal Component Analysis (PCA) is performed. This concerns two
datasets: Fa1 and Fa2 samples (Fig. 11). The main conclusion drawn is that the control
of pore network properties ensured by the structure of the damage zone is not directly
linked to the fault core distance. However, at the macroscopic scale, strain in the
damage zone induces the development of corridors with decreasing fracture intensity,
lowering the thickness of a corridor with its distance from the fault core. The control
scale of petrophysical properties depends on the organization within the corridors,
crack intensities increase toward the fault core, but the distance from the fault core is
not a controlling factor for microstructures or matrix permeability. Effectively, PCA
shows that there is a poor correlation between the distance to the fault core and pore
dimension (S1: Micro-pore throat size, S2: Meso-pore throat size, P1: Micro-pore void
size, P2: Meso-pore void size).
The petrophysical parameters can be divided into two categories, with specific
microstructural controls operating on each:
The fissuration ratio, permeability, dynamic Young’s Modulus, % of illite all have a
property relationship with linked behavior for both facies. Thus, their evolution is only
controlled by the distance from the closest fracture. The fissuration ratio is positively
correlated with an increase in permeability. This suggests that an increased number of
open discontinuities toward the fracture plan facilitates the connectivity of the crack
network, and an improved permeability (Fig. 12). Furthermore, the decreasing
percentage of illite simplifies the percolation of fluids through the intergranular voids,
which also improves the permeability.
‘Insert figure 11’
‘Insert figure 12’
For both facies, porosity, cementation rate, throat diameters (S1 and S2), and
micro-pore void diameters (P1) show different behavior depending on the facies considered.
These properties are dependent on the distance from fracture and facies, and they
influence the type of pore network and permeability.
For Fa1, the pore network dimensions increase (P1, S1, P2, and S2) when
permeability increases (Fig. 13). Pore voids and throats are affected by cataclastic
collapse observed in SEM imaging (Figs. 5E and 5F). This reduces pore network dimensions and global porosity. For this facies, permeability is mostly controlled by the connectivity of cracks, as illustrated by the positive correlation between fissuration ratio and permeability.
For Fa2, permeability increases toward the fracture, and is associated with an increase in throat diameter (S1 and S2), and of micro-pore voids (P1). Different strain mechanisms explain the pore network evolution with the distance to the fracture. The P2 pore size decreases towards the fracture and this can be explained by pore crushing (as for Fa1). Here this process is counterbalanced by the widening of pore throats upon dissolution of cements around grains, affecting S1, S2 and P1 dimensions. This is illustrated by SEM pictures (Figs. 6E and 6F), and the decrease in the cementation rate close to a fracture. In fractured Fa2 samples, K-feldspar grains and cements are partly transformed into illite. K-feldspar and quartz cement rims have a developed system of etches and concavities, interpreted as chemical corrosion. Permeability of Fa2 is controlled by connectivity (fissuration ratio and permeability correlate positively), but also by throat size widening.
From a microstructural point of view, the deformation mechanisms are different for each facies (Fig. 12): For Fa1, the deformation tends to be expressed as a cataclastic flow, with strong grain crushing, lowered Young’s Modulus (E), and reduction of pore network dimensions. The Fa2 facies shows a mixed brittle and cataclastic flow behavior (low (E) near fracture planes), with fractures and cracks remaining open. For the same fissuration ratio, Fa2 samples have higher permeabilities than Fa1, suggesting a preservation of open discontinuities. This type of deformation allows fluid flow and dissolution of cements, leading to the modification of the pore fabric. For the same stress, Fa1f and Fa2f fractured facies have a lower Young's Modulus, and will show more strain than the undeformed Fa1c and Fa2c facies. The slightly higher ratio
between Fa2 curves than Fa1 ones also suggests that the strain will be more developed for Fa2 than for Fa1.
‘Insert figure 13’
5.3. Hydraulic and geo-mechanical properties at the damage zone scale
To understand the hydraulic and geo-mechanical properties at the damage zone scale, an intermediate scale must be introduced. This is the single fracture and its surrounding matrix scale, a link between the grain scale and the damage zone scale. At this intermediate scale of the single fracture, the evolution of petro-physical and mechanical properties varies with the distance from the fracture (Fig. 13). It is possible to define a damage zone for each fracture plane, as deformation processes impact the grain scale features within a limited distance around the fracture (Fig. 14). For Fa1, with cataclastic deformation, the average limit of the fracture damage zone can be settled for this case study at around 0.3 m. Above this distance from the fracture plane, dynamic Young’s Moduli are similar to areas far from the fracture plane. Pore crushing and clogging don’t affect pore dimensions significantly. For Fa2, where fracturing is combined with dissolution, this limit of the fracture damage zone is far higher (above 0.8 m). Pore dimensions and dynamic Young’s Moduli values are not completely stabilized, because dissolution affects a wider volume than grain crushing. For the two facies, this limit of the fracture damage zone varies because mechanisms of deformation and secondary diagenetic sequences produce two different porous networks. These have different controlling factors, one on permeability, and the other on geo-mechanical properties.
The changes in dynamic Young’s Moduli with the distance from the fracture are also representative of geo-mechanical behavior. At the damage zone scale, it will be
expressed by a preferential reactivation of fracture corridors when stress is applied. The media tends to have the properties of fractured facies.
This suggests dependency between the thickness of the fracture damage zone and the deformation type and diagenetic processes affecting the matrix around a single fracture. Strain processes are not only open cracks and reduced mechanical properties, as suggested by Bauer et al., (2015), but also cement dissolution and weakening of contacts between grains. Thus, diagenetic processes control microstructures of rocks and also affect Young’s Modulus and P-wave propagation properties, as has already been observed in other studies (Major et al., 2014; Faÿ-Gomord et al., 2016; Korneva et al., 2016).
‘Insert figure 14’
These interpretations can be integrated into a larger fault zone scale model (Fig. 15.A). Considering the fracture network corridor pattern, it is possible to combine this with the notion of fracture damage zones. The impact of the fractured corridors on compartmentalization of the damage zone results in permeability and geo-mechanical anisotropy. In this case study, three types of behavior can be differentiated: structural position, sedimentary inheritance and fluid/rock interaction:
1) In slightly fractured areas, fractures modify the pore network properties at the
fracture scale, with permeability increase, and weakening of geo-mechanical
resistance in a limited area around the fracture plan (Fig. 15B).
The fracture intensity decreases far from the fault core, causing an increase of the spacing between fractures. Thus a decrease in the coalescence of the fracture damage zones is evidenced, which directly affects the permeability. Two types of behavior are thus identified for fracture corridors, depending on their proximity to the fault core.
2) Far from the fault core, the medium is more likely to present a behavior similar to that observed for samples close to fracture planes, as damage zones of single fractures interfere and enhance hydraulic properties (Fig. 15C). These freshly opened corridors have the following features: a highly permeable fracture corridor, with a high fissuration ratio. A medium fracture intensity, suggesting mixed fracturing and cataclastic flow deformation. In the case of Fa2 facies, cement dissolution increases micropore throat and void sizes, along with meso-pore throat size. Pore collapse mainly affects meso-pore voids as a side effect of cataclasic flow. These two mechanisms of deformation on sandstones had already been recognized in previous studies (Ballas et al., 2013; Saillet and Wibberley, 2013; Soliva et al., 2013; Farrell et al., 2014; Farrell and Healy, 2017).
3) Close to the fault core, fracture intensity and connectivity increase (Bauer et al., 2015). In these corridors, relationships of permeability versus fracture intensity at the fault scale remain valid, with a bulk permeability of the media increased in high fracture intensity corridors. Fracture network in these corridors is due to proximity to the fault core, and the geo-mechanical properties of the fracture walls. These features lead to a high to medium permeability in fracture corridors, with high fracture intensity (structural inheritance). During reactivation, deformation becomes more cataclastic. Grain crushing is increased, with pore collapse affecting meso-pore voids and throats, and illite clogging is a side effect of fracturing. This explains the slight decrease in permeability, despite the increase of fracture intensity for corridors that touch the fault core.
6. Conclusion
Understanding the hydraulic behavior of fractured sandstones in a normal fault damage zone requires the precise description of the fracture network at different scales. The fault-model proposed here is one with a strong impact of interactions between fracture network and pore network features on the overall permeability estimation. To access the pore network properties, an intermediate scale of observation was used to estimate the interaction volume between a single fracture and its surrounding rock-volume. For both facies studied, this threshold varies because mechanisms of deformation and secondary diagenetic sequences produce two distinct porous networks. This is consistent with a previous study that quantified the pore fabric of deformed sandstones (Farrell and Healy, 2017). Different behavior of the corridors has been defined, due to differential rock properties (initial facies, fracture intensity, and diagenetic processes). All these factors control reservoir compartmentalization and increase the complexity of fluid flow pathways in the damage zone. In this case study, the conduit behavior of the damage zone in sandstones is favored within fracture corridors (Eichhubl et al., 2009; Williams et al., 2016), with a dynamic architecture also influenced by a sedimentary heritage and pre-deformation diagenesis (consistent with conclusions from Farrell and Healy, (2017) for the pore fabric aspects, and with those of Knipe et al., (1998); Odling et al., (2004); Pei et al., (2015); Peacock et al., (2017) at the damage zone scale). This approach and the issuing conceptual model of the fault damage zone permeability pattern can be used in a double porosity model, for these types of reservoir or analogues, involving a strong knowledge of structural and pore network features.
Acknowledgements
This work was supported by a PhD grant from ENGIE and the University of Lorraine. We would like to thank Rauscher Company for access to the quarry and sampling authorizations. All the GeoRessources and LEMTA laboratories and ENGIE collaborators are also thanked for numerous advice, settings supplies and help with measurements. Special thanks are due to Dr. Sebastien Leclerc from LEMTA, Dr. Marc Diraison from GeoRessources, and Dr. Andrei Lecomte and Christophe Morlot, from SCMEM (Université de Lorraine), for SEM and X-ray tomography data treatment respectively. We are also grateful to the editor Dr. Toru Takeshita, the reviewers Dr. Fabrizio Agosta, Dr. Nathalie Farrell, and the third anonymous reviewer for their time and suggestions for improvement of the manuscript.
References
Antonellini, M., Aydin, A., 1994. Effect of faulting on fluid flow in porous sandstones:petrophysical properties. American Association of Petroleum Geologists Bulletin 78, 355–377. https://doi.org/10.1306/8D2B1B60-171E-11D7-8645000102C1865D
Ballas, G., Soliva, R., Sizun, J.P., Fossen, H., Benedicto, A., Skurtveit, E., 2013. Shear-enhanced compaction bands formed at shallow burial conditions; implications for fluid flow (Provence, France). Journal of Structural Geology 47, 3– 15. https://doi.org/10.1016/j.jsg.2012.11.008
Bauer, J.F., Meier, S., Philipp, S.L., 2015. Architecture, fracture system, mechanical properties and permeability structure of a fault zone in Lower Triassic sandstone, Upper Rhine Graben. Tectonophysics 647–648, 132–145. https://doi.org/10.1016/j.tecto.2015.02.014
Bense, V.F., Gleeson, T., Loveless, S.E., Bour, O., Scibek, J., 2013. Fault zone hydrogeology. Earth-Science Reviews 127, 171–192. https://doi.org/10.1016/j.earscirev.2013.09.008
Bera, B., Mitra, S.K., Vick, D., 2011. Understanding the micro structure of Berea Sandstone by the simultaneous use of micro-computed tomography (micro-CT) and focused ion beam-scanning electron microscopy (FIB-SEM). Micron 42, 412– 418. https://doi.org/10.1016/j.micron.2010.12.002
Bjorkum, P.A., 1996. How Important is Pressure in causing Dissolution of Quartz in Sandstones? Journal of Sedimentary Research 66, 147–154.
Bjorlykke, K., Egeberg, P.K., 1993. Quartz cementation in sedimentary basins., American Association of Petroleum Geologists Bulletin. https://doi.org/10.1306/BDFF8EE8-1718-11D7-8645000102C1865D
Blaise, T., Barbarand, J., Kars, M., Ploquin, F., Aubourg, C., Brigaud, B., Cathelineau, M., El Albani, A., Gautheron, C., Izart, A., Janots, D., Michels, R., Pagel, M., Pozzi, J.-P., Boiron, M.-C., Landrein, P., 2013. Reconstruction of low burial (< 100 °C) in sedimentary basins: A comparison of geothermometer sensitivity in the intracontinental Paris Basin. Marine and Petroleum Geology 53, 1–17. https://doi.org/10.1016/j.marpetgeo.2013.08.019
Blaise, T., Clauer, N., Cathelineau, M., Boiron, M.-C., Techer, I., Boulvais, P., 2016. Reconstructing fluid-flow events in Lower-Triassic sandstones of the eastern Paris Basin by elemental tracing and isotopic dating of nanometric illite crystals. Geochimica et Cosmochimica Acta 176, 157–184. https://doi.org/10.1016/j.gca.2015.12.018
Böcker, J., Littke, R., 2015. Thermal maturity and petroleum kitchen areas of Liassic Black Shales (Lower Jurassic) in the central Upper Rhine Graben, Germany.
International Journal of Earth Sciences. https://doi.org/10.1007/s00531-015-1188-9
Böcker, J., Littke, R., Forster, A., 2016. An overview on source rocks and the petroleum system of the central Upper Rhine Graben, International Journal of Earth Sciences. Springer Berlin Heidelberg. https://doi.org/10.1007/s00531-016-1330-3 Bourgeois, O., Ford, M., Diraison, M., Le Carlier de Veslud, C., Gerbault, M., Pik, R., Ruby, N., Bonnet, S., 2007. Separation of rifting and lithospheric folding signatures in the NW-Alpine foreland. International Journal of Earth Sciences 96, 1003–1031. https://doi.org/10.1007/s00531-007-0202-2
Bourquin, S., Guillocheau, F., Péron, S., 2009. Braided rivers within an arid alluvial plain (example from the lower triassic, western german basin): Recognition criteria and expression of stratigraphic cycles. Sedimentology 56, 2235–2264. https://doi.org/10.1111/j.1365-3091.2009.01078.x
Bourquin, S., Peron, S., Durand, M., 2006. Lower Triassic sequence stratigraphy of the western part of the Germanic Basin (west of Black Forest): Fluvial system evolution through time and space. Sedimentary Geology 186, 187–211. https://doi.org/10.1016/j.sedgeo.2005.11.018
Brockamp, O., Schlegel, A., Clauer, N., 2011. Mesozoic hydrothermal impact on Rotliegende and Bunter immature sandstones of the High Rhine trough and its adjacent eastern area (southern Black Forest, Germany). Sedimentary Geology 234, 76–88. https://doi.org/10.1016/j.sedgeo.2010.12.001
Caine, J.S., Bruhn, R.L., Forster, C.B., 2010. Internal structure, fault rocks, and inferences regarding deformation, fluid flow, and mineralization in the seismogenic Stillwater normal fault, Dixie Valley, Nevada. Journal of Structural Geology 32, 1576–1589. https://doi.org/10.1016/j.jsg.2010.03.004
Caine, J.S., Evans, J.P., Forster, C.B., 1996. Fault zone architecture and permeability structure. Geology 24, 1025–1028. https://doi.org/10.1130/0091-7613(1996)024<1025
Cathelineau, M., Boiron, M.-C., Fourcade, S., Ruffet, G., Clauer, N., Belcourt, O., Coulibaly, Y., Banks, D.A., Guillocheau, F., 2012. A major Late Jurassic fluid event at the basin/basement unconformity in western France: 40Ar/39Ar and K–Ar dating,
fluid chemistry, and related geodynamic context. Chemical Geology 322–323, 99– 120. https://doi.org/10.1016/j.chemgeo.2012.06.008
Cathelineau, M., Fourcade, S., Clauer, N., Buschaert, S., Rousset, D., Boiron, M.-C.C., Meunier, A., Lavastre, V., Javoy, M., 2004. Dating multistage paleofluid percolations: A K-Ar and O-18/O-16 study of fracture illites from altered Hercynian
plutonites at the basement/cover interface (Poitou High, France). Geochimica et Cosmochimica Acta 68, 2529–2542. https://doi.org/10.1016/j.gca.2003.10.037 Chester, F.M., Logan, J.M., 1986. Implications for Mechanical Properties of Brittle
Faults from Observations of the Punchbowl Fault Zone, California. Pure and Applied Geophysics 124, 79–106.
Clauer, N., Liewig, N., Ledesert, B., Zwingmann, H., 2008. Thermal history of Triassic sandstones from the Vosges Mountains-Rhine Graben rifting area, NE France, based on K-Ar illite dating. Clay Minerals 43, 363–379. https://doi.org/10.1180/claymin.2008.043.3.03
De Boever, W., Derluyn, H., Van Loo, D., Van Hoorebeke, L., Cnudde, V., 2015. Data-fusion of high resolution X-ray CT, SEM and EDS for 3D and pseudo-3D chemical and structural characterization of sandstone. Micron 74, 15–21. https://doi.org/10.1016/j.micron.2015.04.003
basin geometry and early syn-rift tectono-sedimentary evolution. International Journal of Earth Sciences 94, 640–656. https://doi.org/10.1007/s00531-005-0515-y
Dresmann, H., Keulen, N., Timar-Geng, Z., Fügenschuh, B., Wetzel, A., Stünitz, H., 2010. The south-western Black Forest and the Upper Rhine Graben main border fault: Thermal history and hydrothermal fluid flow. International Journal of Earth Sciences 99, 285–297. https://doi.org/10.1007/s00531-008-0391-3
Dunn, K.J., Bergman, D.J., LaTorraca, G.A., 2002. Nuclear Magnetic Resonance: Petrophysical and Logging Applications, Handbook of Geophysical Exploration: Seismic Exploration. Elsevier Science.
Edel, J.-B.J.B., Schulmann, K., Rotstein, Y., 2007. The Variscan tectonic inheritance of the Upper Rhine Graben: evidence of reactivations in the Lias, Late Eocene– Oligocene up to the recent. International Journal of Earth Sciences 96, 305–325. https://doi.org/10.1007/s00531-006-0092-8
Eichhubl, P., Davatzes, N.C., Becker, S.P., 2009. Structural and diagenetic control of fluid migration and cementation along the Moab fault , Utah. AAPG Bulletin 93, 653–681. https://doi.org/10.1306/02180908080
Eisbacher, G.H., Fielitz, W., 2010. Karlsruhe und seine Region - Nordschwarzwald, Kraichgau, Neckartal, südlicher Odenwald, Oberrhein-Graben, Pfälzerwald und westliche Schwäbische Alb., Sammlung g. ed. Schweizerbart Science Publishers, Stuttgart, Germany. 342 p.
Farrell, N.J.C., Healy, D., Taylor, C.W., 2014. Anisotropy of permeability in faulted porous sandstones. Journal of Structural Geology 63, 50–67. https://doi.org/10.1016/j.jsg.2014.02.008
Journal of Structural Geology 104, 125–141. https://doi.org/10.1016/j.jsg.2017.09.010
Faulkner, D.R., Jackson, C.A.L., Lunn, R.J., Schlische, R.W., Shipton, Z.K., Wibberley, C.A.J., Withjack, M.O., 2010. A review of recent developments concerning the structure, mechanics and fluid flow properties of fault zones. Journal of Structural Geology 32, 1557–1575. https://doi.org/10.1016/j.jsg.2010.06.009
Faÿ-Gomord, O., Soete, J., Katika, K., Galaup, S., Caline, B., Descamps, F., Lasseur, E., Fabricius, I.L., Saïag, J., Swennen, R., Vandycke, S., 2016. New insight into the microtexture of chalks from NMR analysis. Marine and Petroleum Geology 75, 252–271. https://doi.org/10.1016/j.marpetgeo.2016.04.019
Fischer, C., Dunkl, I., Von Eynatten, H., Wijbrans, J.R., Gaupp, R., 2012. Products and timing of diagenetic processes in Upper Rotliegend sandstones from Bebertal (North German Basin, Parchim Formation, Flechtingen High, Germany).
Geological Magazine 149, 827–840.
https://doi.org/10.1017/S0016756811001087
Flodin, E.A., Aydin, A., Durlofsky, L.J., Yeten, B., 2001. Representation of Fault Zone Permeability in Reservoir Flow Models. SPE Annual Technical Conference and Exhibition 1–10. https://doi.org/10.2118/71617-MS
Ford, M., Le Carlier de Veslud, C., Bourgeois, O., 2007. Kinematic and geometric analysis of fault-related folds in a rift setting: The Dannemarie basin, Upper Rhine Graben, France. Journal of Structural Geology 29, 1811–1830. https://doi.org/10.1016/j.jsg.2007.08.001
Fossen, H., Johansen, T.E.S., Hesthammer, J., Rotevatn, A., 2005. Fault interaction in porous sandstone and implications for reservoir management; examples from southern Utah. AAPG Bulletin 89, 1593–1606.
https://doi.org/10.1306/07290505041
Fossen, H., 2010. Deformation bands formed during soft-sediment deformation: Observations from SE Utah. Marine and Petroleum Geology 27, 215–222. https://doi.org/10.1016/j.marpetgeo.2009.06.005
Fossen, H., Bale, A., 2007. Deformation bands and their influence on fluid flow. AAPG Bulletin 91, 1685–1700. https://doi.org/10.1306/07300706146
Fossen, H., Schultz, R.A., Shipton, Z.K., Mair, K., 2007. Deformation bands in sandstone: a review. Journal of the Geological Society 164, 1–15. https://doi.org/10.1144/0016-76492006-036
Gaupp, R., Matter, A., Platt, J., Ramseyer, K., Walzebuck, J., 1993. Diagenesis and fluid evolution of deeply buried Permian (Rotliegende) gas reservoirs, northwest Germany. American Association of Petroleum Geologists Bulletin 77, 1111–1128. https://doi.org/10.1306/BDFF8E0C-1718-11D7-8645000102C1865D
Haffen, S., 2012. Caractéristiques géothermiques du réservoir gréseux du Buntsandstein d’Alsace. University of Strasbourg.
Haffen, S., Géraud, Y., Diraison, M., 2015. Geothermal, structural and petrophysical characteristics of Buntsandstein sandstone reservoir in the Upper Rhine Graben. Proceedings World Geothermal Congress 2015. Melbourne, Australia, 11.
Henares, S., Caracciolo, L., Fern, J., Yeste, L.M., Unit, S., Court, R., Cross, B., Park, E., 2016. Diagenetic constraints on heterogeneous reservoir quality assessment : A Triassic outcrop analog of meandering fl uvial reservoirs. 9, 1–22. https://doi.org/10.1306/04041615103
Heynekamp, M.R., Goodwin, L.B., Mozley, P.S., Haneberg, W.C., 1999. Controls on Fault-Zone Architecture in Poorly Lithified Sediments , Rio Grande Rift , New
Mexico : Implications for Fault-Zone Permeability and Fluid Flow.
Homand, F., Duffaut, P., Bérest, P., Billaux, D., Boulon, M., Cornet, F., David, C., Durville, J.L., Gentier, S., Giraud, A., Ghoreychi, M., Henry, J.P., Kondo, D., Londe, P., Pellet, F., Piguet, J.P., Sarda, J.P., Shao, J.F., Souley, M., 2000. Manuel de mécanique des roches - Tome 1 Fondements. Ecole des Mines de Paris. 60 p.
Jolley, S.J., Fisher, Q.J., Ainsworth, R.B., 2010. Reservoir compartmentalization: an introduction. Geological Society, London, Special Publications 347, 1 LP-8. Jourde, H., Flodin, E.A., Aydin, A., Durlofsky, L.J., Wen, X.H., 2002. Computing
permeability of fault zones in eolian sandstone from outcrop measurements. AAPG Bulletin 86, 1187–1200. https://doi.org/10.1306/61EEDC4C-173E-11D7-8645000102C1865D
Klinkenberg, L.J., 1941. The permeability of porous media to liquids and gases. Drilling and Production Practice. American Petroleum Institute.
Knipe, R.J., Jones, G., Fisher, Q.J., 1998. Faulting , fault sealing and fluid flow in hydrocarbon reservoirs : an introduction. In: Jones, G., Fisher, Q.J., Knipe, R.J. (Eds.), Faulting, Fault Sealing and Fluid Flow in Hydrocarbon Reservoirs. London, 147.
Korneva, I., Tondi, E., Balsamo, F., Agosta, F., 2016. Deformation mechanisms and petrophysical properties of chert and limestone fault rocks within slope-to-basin succession (Gargano Promontory, Southern Italy). Tectonophysics 690, 52–62. https://doi.org/10.1016/j.tecto.2016.05.026
Labaume, P., Moretti, I., 2001. Diagenesis-dependence of cataclastic thrust fault zone sealing in sandstones. Example from the Bolivian Sub-Andean Zone. Journal of Structural Geology 23, 1659–1675.
https://doi.org/10.1016/S0191-8141(01)00024-4
Lampe, C., Person, M., Nöth, S., Ricken, W., 2001. Episodic fluid flow within continental rift basins: Some insights from field data and mathematical models of the Rhine Graben. Geofluids 1, 42–52. https://doi.org/10.1046/j.1468-8123.2001.11005.x
Loveless, S., Bense, V., Turner, J., 2011. Fault architecture and deformation processes within poorly lithi fi ed rift sediments , Central Greece. Journal of Structural Geology 33, 1554–1568. https://doi.org/10.1016/j.jsg.2011.09.008 Major, J.R., Eichhubl, P., Dewers, T.A., Urquhart, A.S., Olson, J.E., Holder, J., 2014.
The effect of CO2-related diagenesis on geomechanical failure parameters; fracture testing of CO2-altered reservoir and seal rocks from a natural analog at Crystal Geyser, Utah. 48th US Rocks Mechanics/Geomechanics Symposium. McKinley, J.M., Worden, R.H., Ruffell, A.H., 2009. Smectite in Sandstones: A Review
of the Controls on Occurrence and Behaviour During Diagenesis. Clay Mineral Cements in Sandstones. Blackwell Publishing Ltd., 109–128. https://doi.org/10.1002/9781444304336.ch5
Ménillet, F., Coulombeau, C., Geissert, F., Konrad, H.J., Schwoerer, P., 1989. Notice explicative, Carte géol. France (1/50000), feuille LEMBACH (168). Bureau de recherches géologiques et minières, Orléans.
Merle, O., Michon, L., 2001. The formation of the West European rift: A new model as exemplified by the Massif Central area., Bulletin de la Societe Geologique de France. https://doi.org/10.2113/172.2.213
Nelson, R.A., 2001. 1 - Evaluating Fractured Reservoirs: Introduction. In: Nelson, R.A. (Ed.), Geologic Analysis of Naturally Fractured Reservoirs (Second Edition). Gulf Professional Publishing, Woburn, 1–100.
https://doi.org/https://doi.org/10.1016/B978-088415317-7/50004-X
Odling, N.E., Harris, S.D., Knipe, R.J., 2004. Permeability scaling properties of fault damage zones in siliclastic rocks. Journal of Structural Geology 26, 1727–1747. https://doi.org/10.1016/j.jsg.2004.02.005
Peacock, D.C.P., Dimmen, V., Rotevatn, A., Sanderson, D.J., 2017. A broader classi fi cation of damage zones. 102. https://doi.org/10.1016/j.jsg.2017.08.004
Pei, Y., Paton, D.A., Knipe, R.J., Wu, K., 2015. A review of fault sealing behaviour and its evaluation in siliciclastic rocks. Earth-Science Reviews 150, 121–138. https://doi.org/10.1016/j.earscirev.2015.07.011
Peng, S., Hu, Q., Dultz, S., Zhang, M., 2012. Using X-ray computed tomography in pore structure characterization for a Berea sandstone: Resolution effect. Journal of Hydrology 472–473, 254–261. https://doi.org/10.1016/j.jhydrol.2012.09.034 Ritter, H.L., Drake, L.C., 1945. Pressure Porosimeter and Determination of Complete
Macropore-Size Distributions. Pressure Porosimeter and Determination of Complete Macropore-Size Distributions. Industrial & Engineering Chemistry Analytical Edition 17, 782–786. https://doi.org/10.1021/i560148a013
Saillet, E., Wibberley, C.A.J., 2013. Permeability and flow impact of faults and deformation bands in high-porosity sand reservoirs: Southeast Basin, France, analog. AAPG Bulletin 97, 437–464. https://doi.org/10.1306/09071211191
Schueller, S., Braathen, A., Fossen, H., Tveranger, J., 2013. Spatial distribution of deformation bands in damage zones of extensional faults in porous sandstones: Statistical analysis of field data. Journal of Structural Geology 52, 148–162. https://doi.org/10.1016/j.jsg.2013.03.013