HAL Id: hal-03011293
https://hal.archives-ouvertes.fr/hal-03011293
Submitted on 22 Nov 2020HAL is a multi-disciplinary open access archive for the deposit and dissemination of sci-entific research documents, whether they are pub-lished or not. The documents may come from teaching and research institutions in France or abroad, or from public or private research centers.
L’archive ouverte pluridisciplinaire HAL, est destinée au dépôt et à la diffusion de documents scientifiques de niveau recherche, publiés ou non, émanant des établissements d’enseignement et de recherche français ou étrangers, des laboratoires publics ou privés.
Fault Stability Across the Seismogenic Zone
Jérôme Aubry, F Passelègue, J Escartin, J Gasc, D Deldicque, A Schubnel
To cite this version:
Jérôme Aubry, F Passelègue, J Escartin, J Gasc, D Deldicque, et al.. Fault Stability Across the Seismogenic Zone. Journal of Geophysical Research : Solid Earth, American Geophysical Union, 2020, 125 (8), pp.e2020JB019670. �10.1029/2020jb019670�. �hal-03011293�
This article has been accepted for publication and undergone full peer review but has not been through the copyediting, typesetting, pagination and proofreading process which may lead to differences between this version and the Version of Record. Please cite this article as doi: 10.1029/2020JB019670
Aubry Jérôme (Orcid ID: 0000-0002-1907-0872)
Fault Stability Across the Seismogenic Zone
J. Aubry1*, F. X. Passelègue2, J. Escartín1, J. Gasc1, D. Deldicque1 and A. Schubnel1
1Laboratoire de Géologie, École Normale Supérieure/CNRS UMR 8538, PSL Research
University, 24 Rue Lhomond, F-75005 Paris, France.
2École Polytechnique Fédérale de Lausanne, CH-1015 Lausanne, Switzerland.
*Corresponding author: Jérôme Aubry ([email protected])
Key points
Fault slip behavior is mainly controlled by roughness and asperity nucleation size.
Plastic deformation can coexist with the occurrence of laboratory earthquakes.
Fault weakening initiation depends on asperity hardness while weakening efficiency depends
Abstract
Across the seismogenic zone, the transition from brittle to plastic deformation
corresponds to a semi-brittle regime where brittle fracturing and plastic flow coexist at high
strength conditions. Thorough experimental investigations on brittle-plastic transition are
crucial to understand why natural faults behave in stable or unstable ways at varying crustal
depths and why large earthquakes generally nucleate at the base of the seismogenic zone. To
investigate semi-brittle deformation in carbonates and the conditions promoting it, we reported
here the results of experiments performed on Carrara marble saw-cut faults in triaxial
conditions. We studied the influence of the confining pressure (ranging between 45 and 180
MPa), axial loading rates (0.01 µm s-1 and 1 µm s-1) and initial fault roughness (smooth and
rough) on fault (in-)stability across the brittle-plastic transition. We conclude that laboratory
earthquakes may nucleate on inherited fault interfaces at brittle-plastic transition conditions.
The occurrence of laboratory earthquakes associated with increasing plastic deformation are
promoted at high confining pressure, on smooth fault interfaces, or when the loading rate is
slow. In a rather counterintuitive manner, increasing initial roughness promotes stable sliding
and a larger amount of plastic deformation. Furthermore, we show that stable sliding tends to
produce mirror-like surfaces, while stick-slips are associated with matte surfaces, on which the
size of the asperities grows with increasing confining pressure. Finally, our results seem to
Plain Language Summary
The regime where both brittle and plastic deformation processes are active is known as
the semi-brittle regime. Understanding fault stability within this regime is crucial because large
earthquakes nucleate at the base of this intermediate regime. To look at the slip behavior of
fault surfaces within the semi-brittle regime, we performed experiments on simulated faults
made of Carrara marble, a rock standard prone to be deformed in the semi-brittle field at room
temperature and pressure conditions of the Earth’s upper crust in the laboratory. Through
distinctive seismic cycle experiments on artificial laboratory faults, we investigated slip
behavior (stable slip, slow slip or stick slip) as a function of pressure, background loading rates
and initial roughness. We conclude that (i) fault slip behavior is controlled by fault roughness,
(ii) plastic deformation can coexist with the occurrence of laboratory earthquakes (i.e. unstable
faults) within the semi-brittle regime and (iii) asperity hardness and melt viscosity influence
slip weakening.
Keywords
1. Introduction
The recent discovery of a broad range of fault slip behaviors from slow to fast velocities
(Peng and Gomberg, 2010; Obara and Kato, 2016; Passelègue et al., 2019) has shed a new light
on the heterogeneous character of natural faults. Although observed, this spectrum of fault slips
is not completely understood in terms of physical mechanisms. From the weakening stage to
the observation of a repetitive slip pattern during the seismic cycle, the dynamics of sliding
controls the stability of faults across the seismogenic zone.
From shallow to deep, two distinct deformation regimes, called brittle and plastic,
influence fault stability and reactivation. From friction laws, the limit between the brittle and
plastic deformation fields has been interpreted as a limit between velocity weakening (stable
regime) and velocity strengthening (unstable regime) friction (Shimamoto and Logan, 1986;
Tse and Rice, 1986). Faults are theoretically known to be unstable in the upper crust because
rock deformation is accommodated by brittle mechanisms, such as frictional sliding and
micro-fracturing, inducing strain localization along crustal faults. Conversely, in the lower crust
(typically at depth greater than 20 km), faults are expected to be more stable since deformation
is accommodated by (temperature dependent) intra-crystalline plasticity (e.g. by twinning,
grain boundary diffusion or dislocation glide), which may be distributed within the rock
(Paterson and Wong, 2005).
Between these two distinct end-members, brittle and plastic deformation mechanisms
coexist in a transitional semi-brittle regime (Fredrich et al., 1989; Evans et al., 1990). From
plastic flow laws, the top of the semi-brittle layer has been defined as the depth at which the
pressure and temperature conditions allow plastic processes to initiate at natural plate boundary
strain rates (Hirth and Tullis, 1994; Kohlstedt et al., 1995; De Bresser and Spiers, 1997). This
regime is critical because large earthquakes nucleate and propagate within the semi-brittle
interactions between brittle and plastic deformation processes regarding fault weakening and
stability within this deformation regime remain unclear.
Because calcite is prone to deform plastically at room temperature under relatively
moderate confining pressures (Fredrich et al., 1989; De Bresser and Spiers, 1997), carbonates
can be used to investigate earthquake nucleation within the semi-brittle regime. An extensive
number of laboratory studies have experimented the transition from brittle to semi-brittle rock
deformation in intact carbonates (Fredrich et al., 1989; Vajdova et al., 2004, 2010; Schubnel et
al., 2006; Wong and Baud, 2012; Nicolas et al., 2017), carbonate fault gouges (Verberne et al.,
2013, 2014, 2015; Smith et al., 2015) or carbonate saw-cut samples (Harbord, 2018; Passelègue
et al., 2019). Studies on intact samples highlighted a transition from localized to ductile (i.e.
distributed) deformation with increasing confining pressure. At low sliding velocities, fault
gouge and saw-cut experiments highlighted the velocity strengthening behavior of calcite, the
formation of slicken-sides or mirror-like surfaces (Fondriest et al., 2013), similar to that
observed in the field (Siman-Tov et al., 2013) and a transition to velocity weakening with
increasing temperature (Verberne et al., 2015; Passelègue et al., 2019).
While this transition from brittle to plastic deformation mechanisms is primarily
controlled by pressure and temperature (Fredrich et al., 1989), fault roughness may also play a
key role as it controls the actual stress conditions at contacting asperities, the geometry of
localized asperities, and thus fault weakening. The influence of fault roughness on slip behavior
has been studied from natural observations (Sagy et al., 2007; Bistacchi et al., 2011; Jolivet et
al., 2013), numerical models (Fang and Dunham, 2013; Zielke et al., 2017) and rock mechanics
experiments (Renard et al., 2012; Harbord et al., 2017).
In this study, we investigate the macro- and microscopic behaviors of Carrara marble
laboratory faults to understand earthquake nucleation, fault stability and the interactions
found in the central Apennines (Mecherri et al., 2007), a region where destructive earthquake
swarms (Galli et al., 2008; Chiarabba et al., 2009) coexist with slow aseismic sliding (Amoruso
et al., 2002; Scarpa et al., 2008).
We performed 14 triaxial deformation experiments on saw-cut cylindrical specimens
deformed under varying confining pressure (45, 90, and 180 MPa), loading rates (0.01 µm s-1
and 1 µm s-1) and initial fault roughness conditions (smooth or rough). In addition, we imaged
the evolution of fault surfaces using surface profilometry and microanalysis equipment. In light
of our results, we finally discuss earthquake nucleation, fault stability and strain partitioning
2. Materials and Methods
2.1 Sample characterization and preparation
The starting material used in the experiments is a type C-D Bianco Carrara Marble,
from Apuan Alps (Carrara, Italy). This rock, a standard in rock mechanics is composed of
calcite grains (>98%, 150 µm average grain size) and accessory grains of quartz, pyrite and
epidote of few microns in diameter (Fredrich et al., 1989). We used cylindrical samples (80
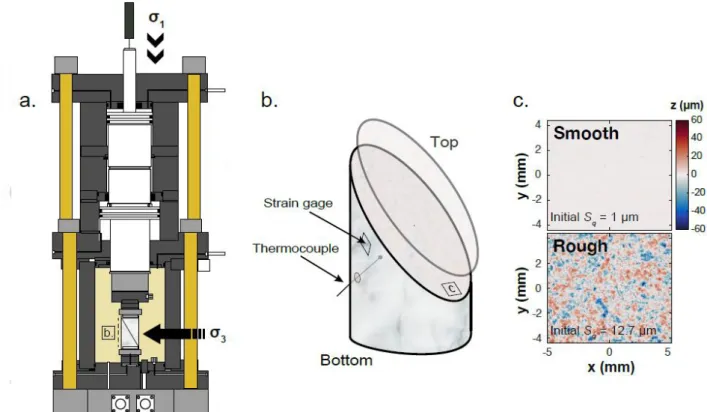
mm in length and 40 mm in diameter) with a saw-cut interface at 30° with respect to the vertical
axis (Figure 1b). After cutting, each side of the interface is flattened with a surface grinder and
roughened either with #1200 or #50 wet silicon carbide grit sandpapers. This resulted in initial
average RMS roughness 𝑆𝑞 of 1 µm and 12.7 µm for the initially smooth and rough fault
interfaces, respectively (Figure 1c, see Sec. 5.2). Roughening stage was performed for only 3
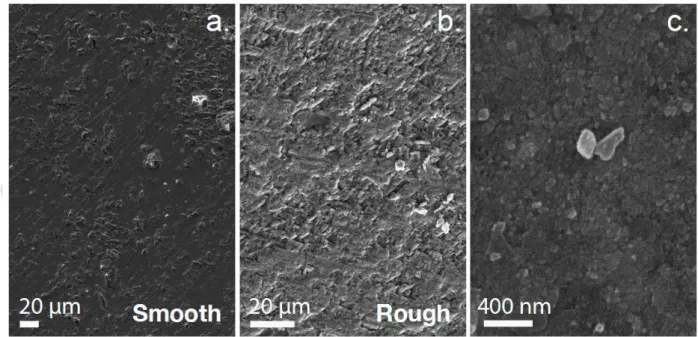
minutes in order to minimize the formation of nanograins and amorphous material.
Nevertheless, SEM imaging of fault interfaces at the end of the polishing process revealed
irregular surfaces with nanoparticles of calcite, supposed to be produced by mechanical
abrasion (Figure 2).
In addition, a thermocouple was inserted 1-2 mm away from the fault surface in order
to record temperature evolution (Figure 1b), in a similar way as that of previous studies
(Lockner et al., 2017; Aubry et al., 2018). Only smooth fault interfaces were equipped with
thermocouple. Strain gages (8.28 mm, 120 Ω, FCB-2-11-F type, Tokyo Sokki Kenkyujo Co.,
Ltd, Japan) were glued directly onto the rock surface (close to the thermocouple location) to
record axial and radial strains during the triaxial experiments (maximum record of 4%
deformation; Figure 1b). The sample was isolated from the oil confining medium using a
2.2 Experimental setup and parameters recorded during the experiments
The triaxial cell used for these experiments is an auto-compensated oil-loaded triaxial
cell with an approximated stiffness of 1 MN mm-1, installed at the Laboratoire de Géologie de l’École Normale Supérieure, Paris, France (Figure 1a; Fortin et al., 2007; Schubnel et al., 2005; Aubry et al., 2018). During compression, the total axial shortening 𝐷𝐿𝑉𝐷𝑇 was measured by an
external linear variable differential transducer (i.e. LVDT, mm), and was approximately of 5
mm at the end of all experiments. Experiments were conducted at constant axial displacement
rate while maintaining the confining pressure constant (resolution of ±0.5 MPa). Two different
loading rates, from slow to fast (0.01 and 1 µm s-1), were investigated. These loading rates refer
to the axial displacement rate of the piston as measured by the LVDT before stiffness
correction. True sample axial shortening was computed by correcting the external axial
measurement for machine stiffness. All displacements discussed in the following correspond
to the displacement 𝐷 recorded for each static stress drop (i.e. overall reduction in shear stress
on fault due to slip) and projected along the fault plane. In order to discuss strain partitioning,
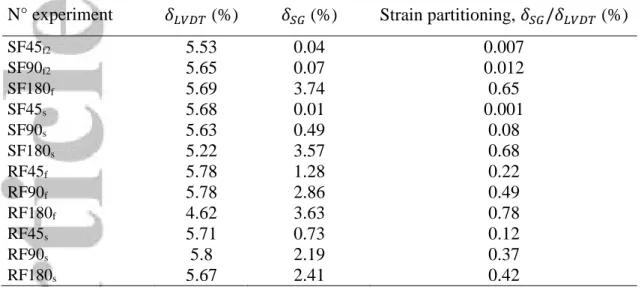
total axial strain 𝛿𝐿𝑉𝐷𝑇 (%) was measured using the LVDT and compared to the local axial
strain 𝛿𝑆𝐺 (%) measured using strain gages. In the following, strain partitioning is defined as
the ratio of local matrix strain 𝛿𝑆𝐺 to total sample axial strain 𝛿𝐿𝑉𝐷𝑇.
Axial (σ1) and confining (σ3) stresses (resolution of ±0.5 MPa), displacements (±0.1
µm), strains (±10-5) and temperature (±0.05 °C) were all recorded at a sampling rate of 10 Hz
during the experiments. Hereafter, the normal (σn) and shear (𝜏) stresses (MPa) acting on the
fault interface result from the projection of the principal stress on the fault plane. Fault friction
μ is thus defined as the ratio between shear and normal stresses resolved on the fault plane.
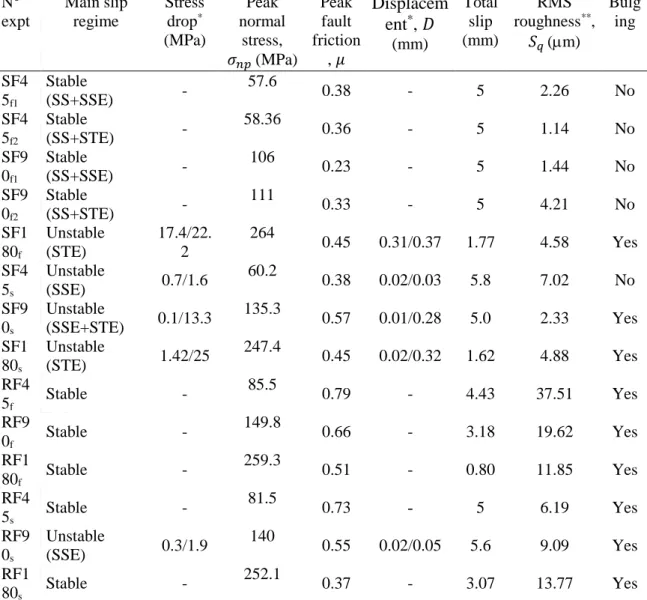
Mechanical data are summarized in Table 1 for all the experiments performed in this study.
Strain partitioning and shortening data are summarized in Table 2. Thermocouple data are
2.3 Post-mortem analysis
After the experiments, several microanalysis observations were performed. First, the
microtopography of each sample (top and bottom fault surfaces) was measured before and after
the experiments using a non-contact surface profilometer at the Centre de Recherche et de
Restauration des Musées de France in Le Louvre (Paris, France). Microtopography data were
acquired over an area of 20×9 mm from a same starting point. Scanning velocity was 1597 µm
s-1 and measuring steps along x and y axis were 4.88 µm. Raw microtopography data were then
processed with the MountainsMap (DigitalSurf, Besançon, France) and Matlab softwares.
When a topographic spot was not measurable at a given location on the fault surface during
scanning (e.g. holes or poorly reflective areas), the topography was interpolated from
neighboring areas. In the following, we only present the interpolated microtopography data of
footwall interfaces, expected to be representative of both sides of the fault.
Scanning electron microscopy (SEM igma, Ecole Normale Supérieure, Laboratoire
de Géologie, Paris, France) was used to image the fault surface at the micro and the nano-scale
after each experiment. Samples were systematically gold coated. Electron back-scattering
diffraction (EBSD, Oxford instruments, Ecole Normale Supérieure, Laboratoire de Géologie,
Paris, France) mapping was performed on some specimens, on cross sections going from the
fault interface to 3-4 mm within the footwall. Measurement steps were 1 µm both in the
directions parallel and perpendicular to slip. EBSD data were analyzed using the MTEX
toolbox (Bachmann et al., 2010) on Matlab. Grain misorientations were inferred using the
crystal parameters of calcite. Finally, transmission electron microscopy (TEM, JEM 2011
UHR/EDX, Institut des Matériaux, Paris, France) was performed on focused-ion beam (FIB)
3. Results
We report here the results of 14 experiments performed at confining pressures of 45,
90 and 180 MPa, loading rate velocities of 0.01 and 1 µm s-1, either on initially smooth or rough
fault interfaces. Each mechanical curve is associated with the experiment run name: SF for “smooth fault”, RF for “rough fault”, a number indicating the confining pressure tested (45 MPa in blue, 90 MPa in green and 180 MPa in red) and a first letter subscript showing if the
experiment has been performed under fast (1 µm s-1, f subscript) or slow (0.01 µm s-1, s
subscript) velocities. See Table 1 for more details on these experiments.
3 Mechanical and temperature data
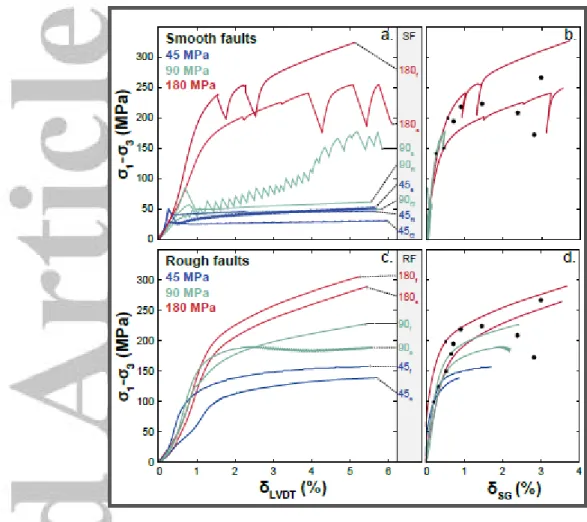
Stress-strain curve relationships are presented in Figure 3. Fault and bulk deformation
(𝛿𝐿𝑉𝐷𝑇) refer to the total axial shortening of the samples. Bulk deformation (𝛿𝑆𝐺) corresponds
to the strain measured locally by strain gages. Note that the difference between the two is that
the external measurement of the axial displacement recorded the total shortening of the sample,
including fault slip, while local strains only measured elastic and plastic contributions to
shortening (both terms were also included in total strain measurements).
3.1 Mechanical data on smooth faults
During experiments conducted at low pressures of 45 and 90 MPa, and a loading rate
of 1 µm s-1 (SF45f1, SF45f2, SF90f1 and SF90f2), a first initial elastic loading was observed, up
to a critical point at which a single stress drop event occurred. This event was followed by a
stable slip regime until the end of the experiments on smooth fault interfaces (Figure 3a). For
these experiments, peak fault friction coefficients 𝜇 ranged between 0.23 and 0.38, stress drops
ranged between 2.9 and 19 MPa and displacements 𝐷 ranged between 0.04 and 0.28 mm (Table
1). Stress drop was either very fast with a stick-slip (audible) or over few seconds with slow
differed (Figure 3a). Stress-strain relationship first increased linearly and departed from it
beyond a critical yield stress (marked with a black dot in Figure 3b) after which stick-slips
prevailed at a maximum differential stress of about 250 MPa (Figure 3a). Compared to results
obtained at lower confinement, higher peak fault friction coefficients (between 0.35 and 0.45),
static stress drops (between 17.4 and 22.2 MPa) and single event fault displacements (between
0.32 and 0.37 mm) were observed (Table 1).
At a loading rate of 0.01 µm s-1, stick or slow slips sequences were systematically
observed (Figure 3a). At 45 MPa (SF45s), 142 slow-slips occurred at peak differential stresses
ranging between 25 and 50 MPa (Figure 3a), corresponding to peak fault friction ranging
between 0.22 and 0.38. Displacements for each single slow-slip ranged from 0.02 and 0.04
mm, with static stress drops between 0.7 and 1.6 MPa (Table 1). At 90 MPa confining pressure
(SF90s), 29 stick-slip events were recorded, showing a substantial hardening above yield stress
around 140 MPa (Figure 3a). For this experiment, individual stress drops ranged from 0.1 to
13.3 MPa, peak fault friction coefficients ranged from 0.15 to 0.57, and single displacements
ranged from 0.01 to 0.28 mm (Table 1). At 180 MPa (SF180s), 5 stick-slips were observed at
a differential stress of 200 to 250 MPa (Figure 3a), with static stress drops of 1.4-25 MPa,
co-seismic displacements of 0.02-0.32 mm and an average fault friction of ~ 0.4 (Table 1).
Independently of the loading rate (i.e. both at 0.01 or 1 µm s-1), local plastic strain
recorded by strain gages 𝛿𝑆𝐺 was negligible at 45 MPa (Figure 3b). At 90 MPa, strain gages
measured up to 0.5% permanent (plastic) strain for the experiment performed at slow loading
rate (SF90s), highlighting a strain partitioning between fault slip and plastic strain (Figure 3b,
Table 2). At 180 MPa (SF180f, SF180s), strain gages measured up to 3.5% strain independently
of the loading rates (Figure 3b, Table 2). This last observation demonstrates that at relatively
high pressure conditions, most of the sample shortening was accommodated by plastic
3.2 Mechanical data on rough faults
Increasing fault roughness promotes stable sliding, strain hardening and plastic
deformation when compared to the experiments conducted on smooth fault surfaces (Figure
3c). At a loading rate of 1 µm s-1, stable sliding was observed between 45 and 180 MPa
confining pressure (RF45f, RF90f, RF180f). The peak differential stresses were systematically
above yield stress, and reached, after hardening, higher values than those reached on smooth
faults (Figure 3a). Fault friction coefficients μ ranged between 0.79 at 45 MPa, to 0.51 at 180
MPa (Table 1). Strain partitioning between fault slip and plastic strain in the bulk was also
systematically observed, with an increasing plastic strain 𝛿𝑆𝐺 of 1.2, 2.8 and 3.6% at 45 MPa
(RF45f), 90 MPa (RF90f) and 180 MPa (RF180f), respectively (Figure 3d and Table 2).
A slow loading rate (0.01 µm s-1) favored the reactivation of the fault in the form of
small detectable instabilities during the overall stable sliding regime, principally at 90 MPa
(RF90s; Figure 3c). For this specific experiment, static stress drops ranged between 0.3-1.89
MPa and are lower than for smooth faults at the same confining pressures (Table 1). Individual
fault event displacements 𝐷 ranged between 0.02 and 0.05 mm at 90 MPa (Table 1). At this
slow loading rate, permanent stable sliding was observed at 45 and 180 MPa (RF45s and
RF180s; Figure 3c), without any strong fault reactivation. Fault friction evolved from ~ 0.7 at
45 MPa (RF45s), to ~ 0.55 at 90 MPa (RF90s) and finally ~ 0.37 at 180 MPa (RF180s; Table
1). Strain partitioning between fault slip and plastic strain within the bulk was also observed at
this slow loading rate, with plastic strain 𝛿𝑆𝐺 from 0.7 to 2.4% between 45 and 180 MPa (Figure
3d and Table 2).
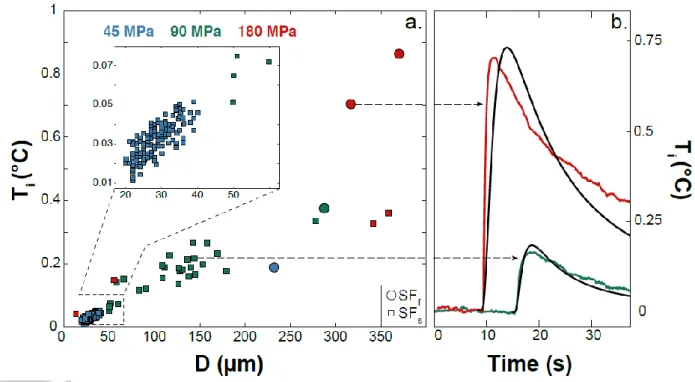
3.3 Footwall temperature evolution
Temperature evolution was measured within the footwall of fault interfaces, 1-2 mm
away from the fault plane with a thermocouple, only during experiments on smooth faults (SF).
pressure (Figure 4a). Temperature increases 𝑇𝑖 ranged from 0.18 to 0.86°C for the experiments
conducted at a loading rate of 1 µm s-1, and from 0.01 to 0.4°C for the experiments performed
at a loading rate of 0.01 µm s-1 (Figure 4a). Some of these representative temperature
measurements allowed us to estimate the amount of frictional heating produced during
individual stick-slip (Figure 4b, Table 3). Two examples illustrating the evolution of
temperature during stick-slip events performed at 90 (SF90s) and 180 MPa (SF180f) are
displayed on Figure 4b. At 90 MPa, a temperature increase of 0.21°C was recorded during a
shear stress drop of 6 MPa (Table 3). At 180 MPa, a temperature increase of 0.7°C was
measured for a shear stress drop of 17.4 MPa (Table 3). In both cases, the temperature
progressively decreased after stick-slip, because of heat diffusion within the bulk of the sample.
4. Microstructural analysis
To investigate the deformation mechanisms active during the experiments, several
microanalysis techniques were used: (i) microtopography using surface profilometry before
and after each experiment (Figure 6), (ii) SEM and TEM imaging (Figures 7, 8 and 9) of the
fault interfaces and (iii) EBSD analyses of the footwall including the sliding surface (Figure
10) with corresponding thin sections (Figure 11).
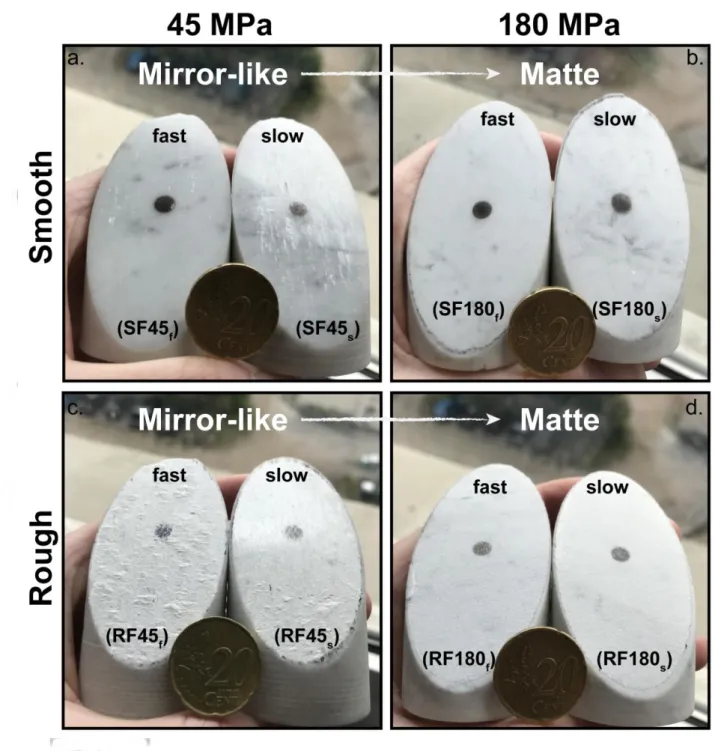
Smooth faults deformed from 45 to 90 MPa exhibited either quasi-stable sliding (a
unique slip event followed by stable sliding) at a loading rate of 1 µm s-1 (SF45f, SF90f)or a
stick-slip regime preferentially at a loading rate of 0.01 µm s-1 (SF45s, SF90s). Post-mortem
fault interfaces resulting from these experiments all displayed mirror-like surfaces with highly
reflective surfaces and elongated gouge striations parallel to the sliding direction (Figure 5a).
At 180 MPa, independently of the loading rates (SF180f, SF180s), we observed a stick-slip
regime resulting in matte fault surfaces (Figure 5b). These matte fault surfaces exhibited large
patches but no visible striations.
As expected, macroscopic roughness was systematically higher for the experiments
conducted on initially rough faults in comparison to the smooth fault interfaces (Figure 5c and
d). At a fast loading rate (1 µm s-1), a thick layer of gouge coated the fault interface deformed
at 45 MPa (RF45f), whether shinny striations were discernible after the experiment performed
at a slow loading rate (RF45s; Figure 5c). Rough faults deformed at 180 MPa were also matte
(RF180f and RF180s; Figure 5d) and the transition from mirror-like surfaces to matte surfaces
with increasing confining pressure was also observed.
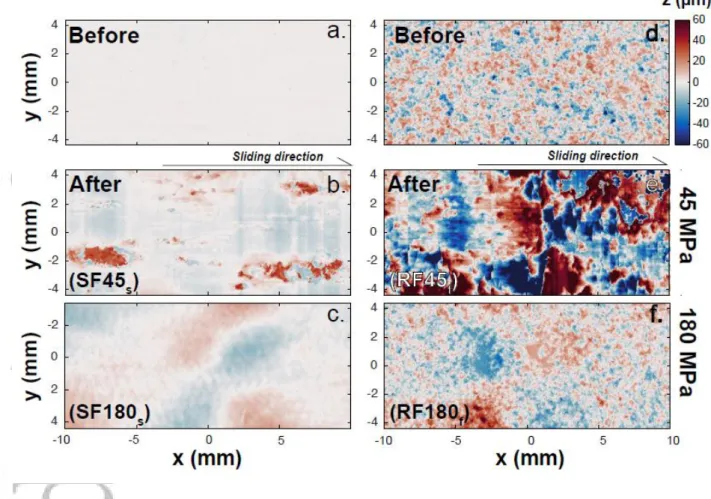
4.2 Microtopography from surface profilometry
Microtopographies measured after experiments are displayed for end-member cases
only: (i) initially smooth faults deformed slowly (at 0.01 µm s-1, SFs, Figure 6b and c) which
exhibited stick-slip, i.e. seismic behavior/unstable slip regime; (ii) initially rough faults,
deformed rapidly (at 1 µm s-1, RFf, Figure 6e and f), which exhibited stable sliding (i.e. aseismic
behavior/stable slip regime).
The roughness of initially smooth fault interfaces (Figure 6a) systematically increases
after the experiments. At 45 MPa (SF45s), elongated and flattened asperities develop as
lows appear as wide flattened domains corresponding to the mirror-like surfaces described
above (Figure 5). Striations along the sliding direction are visible, and crosscut both
topographic highs and lows. At 180 MPa (SF180s), no clear striations are visible and
centimeter-sized asperity patches develop, as well as topographic bumps and holes, in
directions oblique compared to the slip direction (Figure 6c).
Compared to initially smooth fault surfaces, the roughness of initially rough ones
evolves differently (Figure 6d). At 45 MPa (RF45f), roughness increases as large asperities
developed (Figure 6e). These asperities are asymmetric, crenulated and elongated
perpendicular rather than parallel to the sliding direction, forming a stair-case like pavement.
In this case, striations crosscut highs and lows. At 180 MPa (RF180f), roughness does not
evolve much as the initial roughness pattern can easily be recognized, probably because fault
locked due to plastic deformation during the experiment (Figure 6f). Nevertheless, a long
wavelength topography emerges, in a similar way than what is observed for initially smooth
faults.
In summary, striations and brittle asperities due to gouge particles accumulation are
observed at low pressure. However, asperities are flattened and mirror-like only when the fault
surface exhibits stable sliding. At high pressure, a large wavelength topography emerges and
promotes matte fault surfaces both on smooth and rough faults.
4.3 Scanning and transmission electron microscopy observations
The patterns emerging from the microtopography described above is complemented by
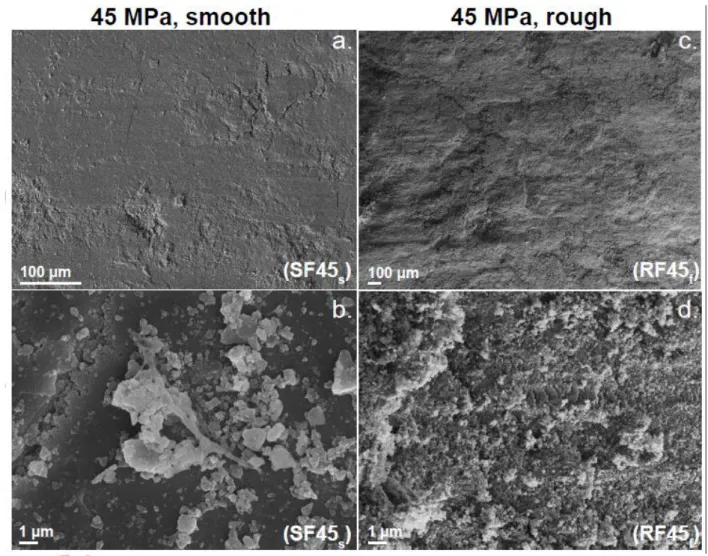
microscopic imaging. At low pressure, striations remain visible at the microscale, in both
smooth and rough faults (Figure 7). The smooth fault appears polished, with low topography
except where gouge particles accumulated to form a scaly fabric, not observed on the entire
fault surface (FS45s, Figure 7a). Holes around tens microns length are found in which
typically micrometric or smaller (Figure 7b). In the case of the rough fault, the surface is
damaged, with a pervasive scaly fabric (RF45f, Figure 7c). In this case, gouge particles are
smaller than on smooth fault, which indicates a higher degree of grain comminution, and cover
the entire surface (Figure 7d).
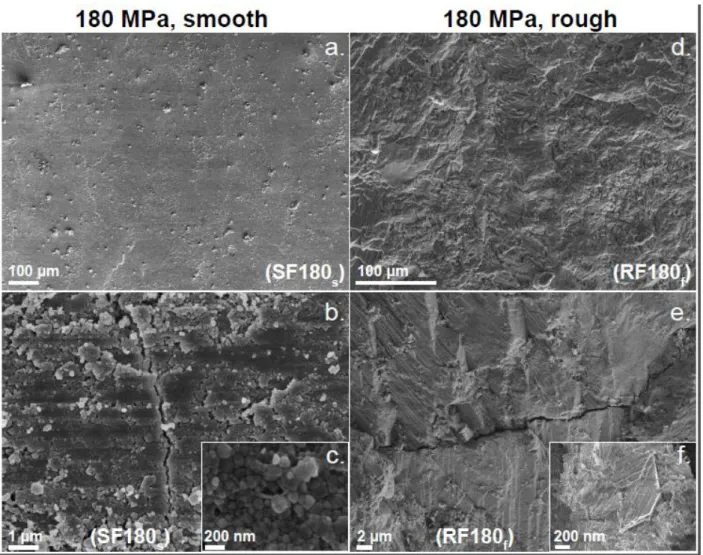
At high pressure, no striations are observed at the millimetric scale (Figure 8). The
smooth fault appears even more polished and with smaller gouge particle clusters (SF180s,
Figure 8a) in comparison with the opposite low pressure case (Figure 7a and b). At high
magnification, the polished surface appears as a fine grained pavement, composed of compact
and euhedral nanoparticles never exceeding 100 nm (Figure 8b). Below this pavement, a
foam-like porous structure can be observed (Figure 8c). The presence of amorphous filaments at
grain junctions suggests that these grains could result from recrystallization and sintering
processes during a fast cooling stage (Figure 8c). This is corroborated by the ubiquitous
observation of cracks cross-cutting the pavement and, for the most part, oriented perpendicular
to the direction of sliding (Figure 8a and b). These cracks may be caused by quick cooling and
associated thermal cracking. At the millimetric scale, no striations are observed on rough
surfaces (RF180f, Figure 8d), most probably because fault slip was limited for these samples.
Again, the surface appears scaly but with less gouge particle compared to the low pressure
case. At the microscale, grains exhibit local “striations” along randomly oriented directions,
probably evidence of mechanical twinning and crystal-plastic deformation (Figure 8e and f).
To further investigate the nanostructure observed at high pressure on initially smooth
samples (Figure 8b and c), focused ion beam (FIB) sections were realized at two locations
where the foam-like porous structures were observed, respectively on samples deformed at 90
(SF90s, Figure 9a-d) and 180 MPa (SF180s, Figure 9e-f). Transmission electron micrographs
reveal the presence of twins within a micrometric calcite crystal situated below a nanograin
present within the nanocrystalline layer, as demonstrated by the diffraction pattern of a selected
area (Figure 9b). The porous structure of the layer is evidenced at higher magnification (Figure
9c). Finally, high-resolution imagery demonstrates that the layer is composed of a mixture of
calcite and lime nanocrystals as well as pores filled by amorphous material (Figure 9c and d).
Similar conclusions can be drawn for the high pressure sample (SF180s, Figure 9e and f), with
the notable differences of the nanocrystalline layer being thicker (close to one micrometer),
and both the individual crystals and the pores being larger. Combined together, the latter
observations demonstrate that frictional heating of the fault surface was intense enough to
trigger calcite decarbonation.
4.4 Electron backscattered diffraction mapping
To document plastic bulk deformation, four EBSD maps were collected on sections of
the fault-walls of specimen undeformed (Figure 10a), and samples deformed slowly at 45
(SF45s, Figure 10b) and 180MPa (SF180s and RF180f, Figure 10c and d) respectively. Grain
misorientation maps document crystal-plastic deformation and provide information on its
spatial distribution relative to the fault surface.
On both types of images, the intensity of intra-crystalline plastic strain clearly increases
with confining pressure (up to 180 MPa: SF180s) and roughness (RF180f), associated to an
increase of twin density and decrease of their thickness (Figure 11). Our observations do not
reveal any strain gradient away from the fault (even for a sample which underwent hundreds
of slow slips and no evidence of plastic strain on the strain gage record; SF45s), suggesting that
plastic strain was accommodated homogeneously within the bulk of the specimen (Figure 10b,
c and d). Stick-slip events themselves did not produce significant near-field intra-crystalline
plastic strain, probably because the high strain rates involved during dynamic rupture
propagation were accommodated by microcracking rather than intra-crystalline plastic
accumulated in between stick-slips, i.e. during the sticking or inter-seismic periods. The
accommodation of plastic strain is promoted when fault roughness increases and stable slip
occurs.
5. Discussion
Our main results highlight: (i) that fault stability depends on confining pressure, loading
rates and initial fault surface roughness; (ii) a strain partitioning transition between shortening
accommodated by fault slip at low pressure, and a contribution to strain accommodation by
homogeneous plastic deformation and fault slip with increasing pressure and roughness; (iii)
the occurrence of stick-slips when crystal-plastic strain was prevalent. Microstructural
observations point towards the role played by roughness evolution, frictional heating and
plasticity during frictional sliding.
5.1 Onset of plasticity and strain partitioning
Our experimental results constrain the conditions at which frictional sliding may coexist
with plastic deformation. Figure 12 shows a gradual transition from deformation being
accommodated exclusively by frictional sliding at low confining pressure (45 MPa, in blue;
SF180f and SF180s) for initially smooth faults. Note that at 90 MPa (SF90s), the transition
occurred during the experiment, with shortening being initially accommodated by fault slip,
and followed by strain hardening above the yield stress (Figure 3b). Note that the fraction of
bulk sample deformation is limited by the length and the location of the strain gage onto the
rock surface.
At 180 MPa, plastic deformation of the bulk accounts for a large part of the total
deformation (SF180f and SF180s, Figure 12a and b). According to SEM and EBSD analyses
(Figures 8 and 10), bulk plastic deformation is mainly attributed to mechanical twinning, and
r-, f- dislocation glide, as observed in previous studies (Turner et al., 1954; Fredrich et al., 1989;
De Bresser and Spiers, 1993, 1997). The activation of plastic processes within the bulk is
expected in the range of confining pressure tested, and is known to be promoted at slow strain
rates (Fredrich et al., 1989; Nicolas et al., 2017). A positive correlation is observed between
initial roughness and plastic deformation. The largest partitioning between plastic and elastic
strains is observed during the experiment performed at fast loading rates with an initially rough
fault interface (SF180f, Figure 12c and Table 2). On rough faults, this partitioning is lowered
when the loading rate is slow (SF180s, Figure 12d and Table 2).
Faster strain rates enhance plastic strain for initially rough faults (Figure 12c), mainly
because higher stresses are attained, while having little effects on initially smooth faults (Figure
12a, Table 2). These new results suggest that the strain partitioning during the seismic cycle at
depth is probably more complicated than for within the brittle upper part of the crust. Strain
partitioning during semi-brittle deformation seems to be not specific to marble (or calcite
bearing lithologies) since it was already observed during cataclastic deformation of saw-cut
samples of porous Berea sandstone by Scott and Nielsen (1991).
More strain being accommodated within the bulk rather than on the fault also reflects
the brittle regime, where the low confining pressure prevented stress build-up on no coupled
faults, but within the semi-brittle regime, where confining pressure and plastic strain hardening
promoted episodic dynamic fault reactivation at higher shear stresses on coupled faults (Figure
3a and c). This may give an insight as to why the largest earthquakes often nucleate at the base
of the seismogenic zone (Das and Scholz, 1983; Hobbs et al., 1986; Shimamoto and Logan,
1986; Hobbs and Ord, 1988; Huc et al., 1998).
5.2 Fault stability, roughness evolution and plastic deformation
A widespread way to discuss fault stability comes from rate and state and critical
nucleation length concepts (Campillo and Ionescu, 1997; Ohnaka and Shen, 1999; Kanamori
and Brodsky, 2004; Latour et al., 2013; Passelègue et al., 2016). Using a simple slip weakening
law, the critical nucleation length L𝑐, above which frictional sliding becomes unstable is given
by Kanamori and Brodsky, 2004:
L𝑐 = GD𝑐 (𝑓𝑠− 𝑓𝑑)𝑛
(1)
where G is the shear modulus of the material (Pa), 𝑛 is the normal stress (Pa) and D𝑐 is the critical slip weakening distance for dynamic stress drop (m) and (𝑓𝑠− 𝑓𝑑) is the friction drop
between static and dynamic friction. Similarly, the transition from aseismic to seismic sliding
is generally interpreted in terms of the (𝑎 − 𝑏) parameter (Ampuero and Rubin, 2008), where a
is a parameter interpreting seismic productivity and 𝑏, the b-value, often used in seismology so
that 𝐿𝑐 can be also formulated as:
𝐿𝑐 = −(𝑎 − 𝑏)GD𝑐 𝑛
(2)
Therefore, the transition from stable to unstable slip is promoted by increasing pressure
concept, the evolution of roughness with slip history is critical in controlling fault stability over
the long term. Fault roughness can be quantified, both parallel or perpendicular to slip direction,
using the RMS roughness 𝑆𝑞 (Bowden and Tabor, 2001; Bouissou et al., 1998; Gadelmawla et
al., 2002) which is the root mean square average of the height profiles. This parameter is
calculated before and after our experiments:
𝑆𝑞= √1 𝐴∫ ∫ 𝑧2𝑑𝑥𝑑𝑦 𝑦𝑚𝑎𝑥 𝑦𝑚𝑖𝑛 𝑥𝑚𝑎𝑥 𝑥𝑚𝑖𝑛 (3)
with 𝐴, the fault surface area (m2) and 𝑧, the height of asperities (m). The value of
the roughness 𝑆𝑞 was 1 mand 12.7 mfor initially smooth and rough faults, respectively. The
value of 𝑆𝑞 for initially smooth faults systematically increased after the experiment. On the
other hand, for initially rough faults, 𝑆𝑞 increased at fast strain rates, i.e. when gouge
production was prevalent, but decreased at low strain rates (Table 1). The dependence of fault
stability regarding the Hurst exponent is under investigation from microtopography data.
Because the critical weakening distance D𝑐 scales with roughness (Marone 1998,
Ohnaka 2003), we mapped fault slip regime (i.e. stable or instable) as a function of 𝑆𝑞, σ𝑛 and
L𝑐 (Figure 13). For this model, we assumed 𝐺 = 24 GPa, according to 𝐺 = 𝜌𝑉𝑠2, with 𝜌 = 2710
kg m-3 and 𝑉𝑠 ~ 3 km s-1 as given by Schubnel et al. (2006), and with (𝑎 − 𝑏) values ranging
from -0.004 and -0.016 as measured experimentally in carbonate gouges (Verberne et al., 2013;
Pluymakers et al. 2016). This evidences that our experimental data partition between stable and
unstable slip for (𝑎 − 𝑏)= -0.008. We interpret the boundaries between these slip regimes in
terms of decreasing asperity nucleation length.
We conclude that unstable slip is favored when 𝐿𝑐 < 𝐿0 (here, 𝐿0 = 8 cm), for low 𝑆𝑞
Passelègue et al. 2019). Smooth interfaces are prone to be more unstable and efficiently
seismically activated (Figure 3a), with the occurrence of events displaying large stress drops
(Goebel et al., 2014, 2017; Harbord et al., 2017) because small initial roughness amplitudes
promote an increase of stress concentration near the fault interface and asperity yielding (Sagy
et Lyakhovsky, 2019). However, no strain gradient away from the fault surface has been
observed during our experiments, even at high confining pressure (Figure 10c and d).
On the contrary, slip stability and seismic quiescence are promoted at high 𝑆𝑞 when
𝐿𝑐 > 𝐿0 (Harbord et al., 2017; Sagy et Lyakhovsky, 2019). This can be explained by the
combined influence of intense gouge production (Marone, 1998) and increasing off-fault
plasticity distribution which limited slip on the interface (Figure 6). Note that plastic
deformation is more important for rough faults than for smooth ones deformed at high pressure
(Figure 3b and d, Figure 12). Concurrently to the increase of contact surface area with normal
stress (Scholz and Engelder, 1976; Dieterich and Kilgore, 1994; Goebel et al., 2014; Badt et
al., 2016), plastic processes including bulging (Figure 10) and twinning (Figure 11) may favor
asperity interlocking (Byerlee, 1967) and rupture arrest (Hok et al., 2010) on rough faults. This
process might explain shallow slip deficit on fault zones across the seismogenic zone (Kaneko
and Fialko, 2011; Roten et al; 2017).
As explained by Sagy et Lyakhovsky (2019), rough faults are prone to develop aseismic
asperities among seismic patches, which stimulate fault reactivation and irregular rupture styles
(Bruhat et al., 2016). In this study, we observed that unstable and stable slip can operate
together on a smooth (SF; e.g. SF45f1) or a rough fault interface (RF; e.g. RF90s). As a number
of experimental works before, we observed that fault reactivation is promoted with decreasing
sliding velocities (Lockner et al. 1986; Moore et al., 1986; Wong and Zhao, 1990). An
important consequence of this observation is that slower deformation in nature should promote
In summary, low roughness and high-normal stress both promote the occurrence of slip
instabilities, while highly rough faults tend to remain locked, generally stable and seismically
silent. The transition from fault stability to instability is largely controlled by confining
pressure and fault roughness, both of which enhancing off-fault stress concentration. With this
in mind, we suggest that the predominance of aseismic and stable slip in natural faulting is due
to rough, heterogeneous and mature faults, which have large nucleation length, a high
capability to produce gouge and off-fault plastic damage.
5.3 Frictional heating and dynamics of faulting within the semi-brittle regime
One of the key findings of this study is that stick-slip instabilities can still occur in
pressure conditions where plastic deformation of the bulk dominates. We now aim at
comparing the energy balance of dynamic faulting within the semi-brittle regime, relative to
that in a purely elastic-brittle lithology such as Westerly granite (Aubry et al., 2018). In order
to quantify the amount of frictional heat produced along the fault interface, we used the method
of Aubry et al. (2018) that exploits temperature data recorded by a thermocouple situated a few
mm away from the fault surface, within the footwall. The frictional heat 𝑄𝑡ℎ (J m-2) produced
on the interface during stick-slip is defined as:
with 𝑞̇0, a constant frictional heat source (in W m-3) for 𝑡𝑤, the typical duration of stick-slip
events (about 20 s; Passelègue et al., 2016) and within the characteristic thermal diffusion
length √𝜋𝜅𝑡𝑤 (m). A finite difference scheme solving the heat equation in one dimension was
used to diffuse heat produced on the interface within the footwall and estimate the temperature
rise predicted at the thermocouple location for various values of 𝑞̇0. Thermocouple data 𝑇𝑖 was
interpolated and then inverted using a least-square fit method. The extremely low temperature
increases produced by the slow slip events at 45 MPa remained difficult to invert (SF45s). Only 𝑄𝑡ℎ= 2𝑞̇0𝑡𝑤√𝜋𝜅𝑡𝑤
a representative subsets of the temperature increases observed during stick-slips at 90 and 180
MPa (Figure 4b) were inverted (Table 3).
Frictional heat produced during stick-slip is compared to the total mechanical work
(Figure 14a), defined as follows:
with 𝜏𝑝 and 𝜏𝑟 the peak and residual shear stresses (Pa), and 𝐷, the co-seismic fault slip (m),
i.e. the co-seismic shortening projected along the fault, corrected for both the rock and the
machine’s elasticity. 𝑄𝑡ℎ increases with increasing 𝐸𝑡𝑜𝑡 and ranged between 3 and 46 kJ m-2 (Table 3). Assuming a thickness of the fault interface twice that of the thermal diffusion length,
this translates into fault surface temperatures 𝑇𝑡ℎ ranging between 100 and 540°C (Table 3).
These temperatures are slightly lower than the range of temperatures expected for
decarbonation, between 600 and 850°C (Rodriguez-Navarro et al., 2009; Han et al., 2010).
Furthermore, we note that the thermocouple is an averaged near-fault point measurement. It is
thus likely that these temperatures underestimate the temperature reached on local asperities
(Aubry et al., 2018).
Interestingly, and as previously observed on Westerly granite, the ratio of available
mechanical work converted into frictional heat (i.e. heating efficiency 𝑅, defined as the ratio
𝑄𝑡ℎ/𝐸𝑡𝑜𝑡) decreases both with increasing 𝐷 and available 𝐸𝑡𝑜𝑡, which suggests dramatic fault
weakening after slipping a few tens of microns only (Figure 14b). On fault surfaces that
underwent stick-slip motion at high pressure, an ultra-thin layer of nanoparticles was found
coating the surfaces after the experiment (Figure 8b and c). Nano-structural investigations
(Figure 9) demonstrated that these layers, less than a micron thick, resulted either from the
decarbonation-degassing reaction produced by frictional heating (Han et al., 2010; De Paola et
al., 2011; i.e. calcite gives carbon dioxide and lime) and/or the recrystallisation of a carbonated 𝐸𝑡𝑜𝑡 =(𝜏𝑝+ 𝜏𝑟)𝐷
melt. The low viscosity of carbonate melts or the high interstitial pressures expected from
decarbonation reactions (Han et al., 2007; Sulem and Famin, 2009) might explain the apparent
plateau or saturation observed in the amount of frictional heat produced at high pressure in
marble when compared to Westerly granite, which also corresponds to a more dramatic
decrease of 𝑅 (Figure 14b). The higher weakening efficiency observed for carbonates (Figure
14b) is explained by the low melt viscosity of carbonates compared to silicate rocks (Kono et
al., 2014). The seismic efficiency (1-𝑅, i.e. the amount of radiated waves vs. mechanical work)
of earthquakes might be lithology-dependent. In other words, higher seismic efficiency are thus
expected in carbonates, dolostones (Passelègue et al., 2019), hydrated rocks such as serpentine
(Brantut et al., 2016) than in anhydrous (continental, oceanic and mantellic) lithologies because
of more dramatic weakening.
Finally, we also shed a light on the role played by asperity hardness on fault weakening
initiation (Engelder and Scholz, 1976). This discussion comes from the concept of critical
weakening velocity 𝑉𝑤 developed by Rice (2006), which states that lowering the asperity
hardness 𝜏𝑐 leads to an increase of the critical weakening velocity 𝑉𝑤. Combined with the
observations of Tabor (1954), who showed that the asperity hardness 𝜏𝑐 of quartz is higher than
that of calcite, we emphasize that low asperity hardness promotes higher weakening velocity
6. Conclusions
Our experimental work on Carrara marble provides constraints regarding fault stability
across the seismogenic zone, at brittle-plastic conditions. A changeover from stable to unstable
slip was observed with increasing confining pressure, decreasing roughness, asperity
nucleation size and loading rates. A transition from mirror-like to matte surfaces is observed
with increasing pressure either on smooth or rough faults for which gouge production was more
intense. Further studies could help to extrapolate these observations to natural tectonic strain
rates.
Because of plastic strain hardening, the semi-brittle regime corresponds to a regime of
maximum fault strength, where the most violent laboratory earthquakes were observed. This
might give insights as to why large crustal earthquakes may nucleate at the base of the
seismogenic zone, on inherited fault interfaces, while country rocks deform in the semi-brittle
deformation regime. At such high stresses, dynamic fault slip triggers instantaneous and
dramatic fault weakening within a few microns of slip, because of the combined effects of
decarbonation and shear-induced melting. At similar conditions, fault weakening in carbonates
is more dramatic than in silicate rocks, which suggests that the earthquake seismic efficiency
has a lithology dependence.
Finally, this study brings some implications on fault coupling maps and seismic
moment balance along natural active faults. Indeed, when performing seismic moment balance,
geodetic studies often suggest seismic moment deficit, while assuming elastic coupling only,
even at depth. Here, we show that plastic deformation can coexist with the occurrence of
laboratory earthquakes. Within the semi-brittle regime (i.e. at depths > 10 km), strain
partitioning between fault slip and plastic deformation prevails, and is promoted with
episodic slip, while most of the interseismic moment is nevertheless accommodated by
Acknowledgments
We thank Y. Pinquier (ENS, Paris, France) for all the help done with the sample
preparation and experimental devices as well as for his full career at ENS. Many thanks to K.
Oubellouch (ENS, Paris, France) for thin sections of Carrara Marble. We thank N. Mélard and
M. Page (C2RMF, Paris, France) for microtopography issues at C2RMF. We thank R. Jolivet,
H. S. Bhat and J. A. Olive (ENS, Paris, France) for fruitful discussions. This study was funded
by the European Research Council grant REALISM (2016-grant 681346) led by A. Schubnel.
The authors declare that they have no competing financial interests. The data that support the
findings of this study are available in Mendeley Data at
References
Amoruso, A., Crescentini, L., Morelli, A., & Scarpa, R. (2002). Slow rupture of an aseismic fault in a seismogenic region of Central Italy. Geophysical Research Letters, 29(24), 72-1. https://doi.org/10.1029/2002GL016027.
Ampuero, J. P., & Rubin, A. M. (2008). Earthquake nucleation on rate and state faults–Aging and slip laws. Journal of Geophysical Research: Solid Earth, 113(B1).
https://doi.org/10.1029/2007jb005082.
Aubry, J., Passelègue, F. X., Deldicque, D., Girault, F., Marty, S., et al. (2018). Frictional heating processes and energy budget during laboratory earthquakes. Geophysical Research
Letters, 45(22), 12-274. https://doi.org/10.1029/2018GL079263.
Bachmann, F., Hielscher, R., & Schaeben, H. (2010). Texture analysis with MTEX–free and open source software toolbox. In Solid State Phenomena (Vol. 160, pp. 63-68). Trans Tech Publications. https://doi.org/10.4028/www.scientific.net/ssp.160.63.
Badt, N., Hatzor, Y. H., Toussaint, R., & Sagy, A. (2016). Geometrical evolution of interlocked rough slip surfaces: The role of normal stress. Earth and Planetary Science Letters, 443, 153-161.
https://doi.org/10.1016/j.epsl.2016.03.026.
Bistacchi, A., Griffith, W. A., Smith, S. A., Di Toro, G., Jones, R., & Nielsen, S. (2011). Fault roughness at seismogenic depths from LIDAR and photogrammetric analysis. Pure and
Applied Geophysics, 168(12), 2345-2363. https://doi.org/10.1007/s00024-011-0301-7.
Bouissou, S., Petit, J. P., & Barquins, M. (1998). Normal load, slip rate and roughness influence on the PMMA dynamics of sliding 2. Characterisation of the stick-slip phenomenon. Wear, 215(1-2), 137-145. http://dx.doi.org/10.1016/s0043-1648(97)00268-8.
Bowden, F. P., & Tabor, D. (2001). The friction and lubrication of solids (Vol. 1). Oxford university press, New-York.
Brantut, N., Passelègue, F. X., Deldicque, D., Rouzaud, J. N., & Schubnel, A. (2016). Dynamic weakening and amorphization in serpentinite during laboratory earthquakes. Geology, 44(8), 607-610. https://doi.org/10.1130/g37932.1.
Bruhat, L., Fang, Z., & Dunham, E. M. (2016). Rupture complexity and the supershear transition on rough faults. Journal of Geophysical Research: Solid Earth, 121(1), 210-224. https://doi.org/10.1002/2015JB012512.
Byerlee, J. D. (1967). Theory of friction based on brittle fracture. Journal of Applied
Physics, 38(7), 2928-2934. https://doi.org/10.1063/1.1710026.
Campillo, M., & Ionescu, I. R. (1997). Initiation of antiplane shear instability under slip dependent friction. Journal of Geophysical Research: Solid Earth, 102(B9), 20363-20371. https://doi.org/10.1029/97jb01508.
Chiarabba, C., Amato, A., Anselmi, M., Baccheschi, P., Bianchi, et al. (2009). The 2009 L’Aquila (Central Italy) Mw 6.3 earthquake: main shock and aftershocks. Geophysical
Research Letters, 36(18). https://doi.org/10.1029/2009GL039627.
Das, S., & Scholz, C. H. (1983). Why large earthquakes do not nucleate at shallow depths.
Nature, 305(5935), 621. https://doi.org/10.1038/305621a0.
De Bresser, J. T., & Spiers, C. J. (1993). Slip systems in calcite single crystals deformed at 300–800 C. Journal of Geophysical Research: Solid Earth, 98(B4), 6397-6409. https://doi.org/10.1029/92JB02044.
De Bresser, J. H. P., & Spiers, C. J. (1997). Strength characteristics of the r, f, and c slip systems in calcite. Tectonophysics, 272(1), 1-23. https://doi.org/10.1016/S0040-1951(96)00273-9.
De Paola, N., Hirose, T., Mitchell, T., Di Toro, G., Viti, C., et al. (2011). Fault lubrication and earthquake propagation in thermally unstable rocks. Geology, 39(1), 35-38. https://doi.org/10.1130/G31398.1.
Dieterich, J. H., & Kilgore, B. D. (1994). Direct observation of frictional contacts: New insights for state-dependent properties. Pure and Applied Geophysics, 143(1-3), 283-302. https://doi.org/10.1007/BF00874332.
Evans, B., Fredrich, J. T., & Wong, T. F. (1990). The brittle-ductile transition in rocks: Recent experimental and theoretical progress. The Brittle-Ductile Transition in Rocks,
Geophysical Monograph Series, 56, 1-20. https://doi.org/10.1029/gm056p000.
Engelder, J. T., & Scholz, C. H. (1976). The role of asperity indentation and ploughing in rock friction—II: Influence of relative hardness and normal load. In International Journal of
Rock Mechanics and Mining Sciences & Geomechanics Abstracts(Vol. 13, No. 5, pp.
155-163). Pergamon. https://doi.org/10.1016/0148-9062(76)90820-2.
Fang, Z., & Dunham, E. M. (2013). Additional shear resistance from fault roughness and stress levels on geometrically complex faults. Journal of Geophysical Research: Solid
Earth, 118(7), 3642-3654. https://doi.org/10.1002/jgrb.50262.
Fondriest, M., Smith, S. A., Candela, T., Nielsen, S. B., Mair, K., et al. (2013). Mirror-like faults and power dissipation during earthquakes. Geology, 41(11), 1175-1178. https://doi.org/10.1130/G34641.1.
Fortin, J., Guéguen, Y., & Schubnel, A. (2007). Effects of pore collapse and grain crushing on ultrasonic velocities and Vp/Vs. Journal of Geophysical Research: Solid Earth, 112(B8). https://doi.org/10.1029/2005JB004005.
Fredrich, J. T., Evans, B., & Wong, T. F. (1989). Micromechanics of the brittle to plastic transition in Carrara marble. Journal of Geophysical Research: Solid Earth, 94(B4), 4129-4145. https://doi.org/10.1029/JB094iB04p04129.
Galli, P., Galadini, F., Pantosti, D., 2008. Twenty years of paleoseismology in Italy.
Gadelmawla, E. S., Koura, M. M., Maksoud, T. M. A., Elewa, I. M., & Soliman, H. H. (2002). Roughness parameters. Journal of materials processing Technology, 123(1), 133-145. https://doi.org/10.1016/s0924-0136(02)00060-2.
Goebel, T. H. W., Candela, T., Sammis, C. G., Becker, T. W., Dresen, G., & Schorlemmer, D. (2014). Seismic event distributions and off-fault damage during frictional sliding of saw-cut surfaces with pre-defined roughness. Geophysical Journal International, 196(1), 612-625. https://doi.org/10.1093/gji/ggt401.
Goebel, T. H., Kwiatek, G., Becker, T. W., Brodsky, E. E., & Dresen, G. (2017). What allows seismic events to grow big?: Insights from b-value and fault roughness analysis in laboratory stick-slip experiments. Geology, 45(9), 815-818. https://doi.org/10.1130/G39147.1.
Han, R., Shimamoto, T., Hirose, T., Ree, J. H., & Ando, J. I. (2007). Ultralow friction of carbonate faults caused by thermal decomposition. Science, 316(5826), 878-881. https://doi.org/10.1126/science.1139763.
Han, R., Hirose, T., & Shimamoto, T. (2010). Strong velocity weakening and powder lubrication of simulated carbonate faults at seismic slip rates. Journal of Geophysical
Research: Solid Earth, 115(B3). https://doi.org/10.1029/2008JB006136.
Harbord, C. W., Nielsen, S. B., De Paola, N., & Holdsworth, R. E. (2017). Earthquake nucleation on rough faults. Geology, 45(10), 931-934. https://doi.org/10.1130/G39181.1.
Harbord, C. W. A. (2018). Earthquake nucleation, rupture and slip on rough laboratory faults. Doctoral dissertation, Durham University.
Hirth, G., & Tullis, J. (1994). The brittle‐plastic transition in experimentally deformed quartz aggregates. Journal of Geophysical Research: Solid Earth, 99(B6), 11731-11747. https://doi.org/10.1029/93JB02873.
Hobbs, B. E., Ord, A., & Teyssier, C. (1986). Earthquakes in the ductile regime?. Pure and
Applied Geophysics, 124(1-2), 309-336. https://doi.org/10.1007/BF00875730.
Hobbs, B. E., & Ord, A. (1988). Plastic instabilities: Implications for the origin of intermediate and deep focus earthquakes. Journal of Geophysical Research: Solid Earth, 93(B9), 10521-10540. https://doi.org/10.1029/jb093ib09p10521.
Hok, S., Campillo, M., Cotton, F., Favreau, P., & Ionescu, I. (2010). Off‐fault plasticity favors the arrest of dynamic ruptures on strength heterogeneity: Two‐dimensional cases. Geophysical Research Letters, 37(2). https://doi.org/10.1029/2009GL041888.
Huc, M., Hassani, R., & Chéry, J. (1998). Large earthquake nucleation associated with stress exchange between middle and upper crust. Geophysical Research Letters, 25(4), 551-554. https://doi.org/10.1029/98gl00091.
Jolivet, R., Lasserre, C., Doin, M. P., Peltzer, G., Avouac, J. P., et al. (2013). Spatio-temporal evolution of aseismic slip along the Haiyuan fault, China: Implications for fault frictional properties. Earth and Planetary Science Letters, 377, 23-33. https://doi.org/10.1016/j.epsl.2013.07.020.
Kanamori, H., & Brodsky, E. E. (2004). The physics of earthquakes. Reports on Progress in
Physics, 67(8), 1429. https://doi.org/10.1088/0034-4885/67/8/r03.
Kaneko, Y., & Fialko, Y. (2011). Shallow slip deficit due to large strike-slip earthquakes in dynamic rupture simulations with elasto-plastic off-fault response. Geophysical Journal
International, 186(3), 1389-1403. https://doi.org/10.1111/j.1365-246X.2011.05117.x.
Kohlstedt, D. L., Evans, B., & Mackwell, S. J. (1995). Strength of the lithosphere: Constraints imposed by laboratory experiments. Journal of Geophysical Research: Solid Earth, 100(B9), 17587-17602. https://doi.org/10.1029/95JB01460.
Kono, Y., Kenney-Benson, C., Hummer, D., Ohfuji, H., Park, C., Shen, G., ... & Manning, C. E. (2014). Ultralow viscosity of carbonate melts at high pressures. Nature Communications, 5(1), 1-8. https://doi.org/10.1038%2Fncomms6091.
Latour, S., Schubnel, A., Nielsen, S., Madariaga, R., & Vinciguerra, S. (2013). Characterization of nucleation during laboratory earthquakes. Geophysical Research Letters, 40(19), 5064-5069. https://doi.org/10.1002/grl.50974.
Lockner, D. A., Summers, R., & Byerlee, J. D. (1986). Effects of temperature and sliding rate on frictional strength of granite. In Friction and Faulting (pp. 445-469). Birkhäuser, Basel. https://doi.org/10.1007/978-3-0348-6601-9_4.
Lockner, D. A., Kilgore, B. D., Beeler, N. M., & Moore, D. E. (2017). The transition from frictional sliding to shear melting in laboratory stick-slip experiments. Fault zone dynamic
processes: Evolution of fault properties during seismic rupture, 105-132. https://doi.org/10.1002/9781119156895.ch6.
Nicolas, A., Fortin, J., Regnet, J. B., Verberne, B. A., Plümper, O., et al. (2017). Brittle and semibrittle creep of Tavel limestone deformed at room temperature. Journal of Geophysical
Research: Solid Earth, 122(6), 4436-4459. https://doi.org/10.1002/2016JB013557.
Marone, C. (1998). Laboratory-derived friction laws and their application to seismic faulting.
Annual Review of Earth and Planetary Sciences, 26(1), 643-696. https://doi.org/10.1146/annurev.earth.26.1.643.
McNulty, B. A. (1995). Pseudotachylyte generated in the semi-brittle and brittle regimes, Bench Canyon shear zone, central Sierra Nevada. Journal of Structural Geology, 17(11), 1507-1521. https://doi.org/10.1016%2F0191-8141%2895%2900052-f.
Meccheri, M., Molli, G., Conti, P., Blasi, P. & Vaselli, L. (2007). The Carrara Marbles (Alpi Apuane, Italy): a geological and economical updated review. Z. dt. Ges. Geowiss., 158/4, p. 719–735. https://doi.org/10.1127/1860-1804/2007/0158-0719.
Moore, D. E., Summers, R., & Byerlee, J. D. (1986). The effects of sliding velocity on the frictional and physical properties of heated fault gouge. Pure and Applied Geophysics, 124(1-2), 31-52. https://doi.org/10.1007/bf00875718.
Obara, K., & Kato, A. (2016). Connecting slow earthquakes to huge earthquakes. Science, 353(6296), 253-257. https://doi.org/10.1126%2Fscience.aaf1512.
Ohnaka, M., & Shen, L. F. (1999). Scaling of the shear rupture process from nucleation to dynamic propagation: Implications of geometric irregularity of the rupturing surfaces. Journal
of Geophysical Research: Solid Earth, 104(B1), 817-844.
https://doi.org/10.1029/1998jb900007.
Ohnaka, M. (2003). A constitutive scaling law and a unified comprehension for frictional slip failure, shear fracture of intact rock, and earthquake rupture. Journal of Geophysical Research:
Solid Earth, 108(B2). https://doi.org/10.1029/2000jb000123.
Passelègue, F. X., Schubnel, A., Nielsen, S., Bhat, H. S., Deldicque, D., et al. (2016). Dynamic rupture processes inferred from laboratory microearthquakes. Journal of Geophysical
Research: Solid Earth, 121(6), 4343-4365. https://doi.org/10.1002/2015JB012694.
Passelègue, F. X., Aubry, J., Nicolas, A., Fondriest, M., Deldicque, D., et al. (2019). From Fault Creep to slow and fast Earthquakes in Carbonates. Geollogy, 47(8): 744-748. https://doi.org/10.1130/G45868.1.
Paterson, M. S., & Wong, T. F. (2005). Experimental rock deformation-the brittle field. Springer Science & Business Media.
Peng, Z., & Gomberg, J. (2010). An integrated perspective of the continuum between earthquakes and slow-slip phenomena. Nature Geoscience, 3(9), 599-607.
https://doi.org/10.1038/ngeo940.
Pluymakers, A. M. H., Niemeijer, A. R., & Spiers, C. J. (2016). Frictional properties of simulated anhydrite-dolomite fault gouge and implications for seismogenic potential. Journal
of Structural Geology, 84, 31-46. https://doi.org/10.1016/j.jsg.2015.11.008.
Renard, F., Mair, K., & Gundersen, O. (2012). Surface roughness evolution on experimentally simulated faults. Journal of Structural Geology, 45, 101-112. https://doi.org/10.1016/j.jsg.2012.03.009.
Rice, J. R. (2006). Heating and weakening of faults during earthquake slip. Journal of
Geophysical Research: Solid Earth, 111(B5). https://doi.org/10.1029%2F2005jb004006.
Rodriguez-Navarro, C., Ruiz-Agudo, E., Luque, A., Rodriguez-Navarro, A. B., & Ortega-Huertas, M. (2009). Thermal decomposition of calcite: Mechanisms of formation and textural evolution of CaO nanocrystals. American Mineralogist, 94(4), 578-593. https://doi.org/10.2138/am.2009.3021.
Roten, D., Olsen, K. B., & Day, S. M. (2017). Off‐fault deformations and shallow slip deficit from dynamic rupture simulations with fault zone plasticity. Geophysical Research
Letters, 44(15), 7733-7742. https://doi.org/10.1002/2017GL074323.
Sagy, A., Brodsky, E. E., & Axen, G. J. (2007). Evolution of fault-surface roughness with slip.
Sagy, A., & Lyakhovsky, V. (2019). Stress patterns and failure around rough interlocked fault surface. Journal of Geophysical Research: Solid Earth, 124(7), 7138-7154.
https://doi.org/10.1029/2018JB017006.
Scarpa, R., Amoruso, A., Crescentini, L., Fischione, C., Formisano, L. A., et al. (2008). Slow earthquakes and low frequency tremor along the Apennines, Italy. Annals of Geophysics.
Scholz, C. H., & Engelder, J. T. (1976). The role of asperity indentation and ploughing in rock friction—I: Asperity creep and stick-slip. In International Journal of Rock Mechanics
and Mining Sciences & Geomechanics Abstracts (Vol. 13, No. 5, pp. 149-154). Pergamon.
https://doi.org/10.1016/0148-9062(76)91557-6.
Scholz, C. H. (1998). Earthquakes and friction laws. Nature, 391(6662), 37. https://doi.org/10.1038/34097.
Schubnel, A., Fortin, J., Burlini, L., & Gueguen, Y. (2005). Damage and recovery of calcite rocks deformed in the cataclastic regime. Geological Society, London, Special
Publications, 245(1), 203-221. https://doi.org/10.1144/GSL.SP.2005.245.01.10.
Schubnel, A., Walker, E., Thompson, B. D., Fortin, J., Guéguen, Y., et al. (2006). Transient creep, aseismic damage and slow failure in Carrara marble deformed across the brittle‐ductile transition. Geophysical Research Letters, 33(17). https://doi.org/10.1029/2006GL026619.
Scott, T. E., & Nielsen, K. C. (1991). The effects of porosity on the brittle‐ductile transition in sandstones. Journal of Geophysical Research: Solid Earth, 96(B1), 405-414. https://doi.org/10.1029/90JB02069.
Shimamoto, T., & Logan, J. M. (1986). Velocity-dependent behavior of simulated halite shear zones: an analog for silicates. See Das et al., 37, 49-63. https://doi.org/10.1029/GM037p0049.
Siman-Tov, S., Aharonov, E., Sagy, A., & Emmanuel, S. (2013). Nanograins form carbonate fault mirrors. Geology, 41(6), 703-706. https://doi.org/10.1130/G34087.1.
Smith, S. A. F., Nielsen, S., & Di Toro, G. (2015). Strain localization and the onset of dynamic weakening in calcite fault gouge. Earth and Planetary Science Letters, 413, 25-36. https://doi.org/10.1016/j.epsl.2014.12.043.
Sulem, J., & Famin, V. (2009). Thermal decomposition of carbonates in fault zones: Slip‐ weakening and temperature‐limiting effects. Journal of Geophysical Research: Solid Earth,
114(B3). https://doi.org/10.1029/2008jb006004.
Tabor, D. (1954). Mohs's hardness scale-a physical interpretation. Proceedings of the Physical
Society. Section B, 67(3), 249. https://doi.org/10.1088/0370-1301/67/3/310.
Tse, S. T., & Rice, J. R. (1986). Crustal earthquake instability in relation to the depth variation of frictional slip properties. Journal of Geophysical Research: Solid Earth, 91(B9), 9452-9472. https://doi.org/10.1029/JB091iB09p09452.