HAL Id: hal-00328443
https://hal.archives-ouvertes.fr/hal-00328443
Submitted on 20 Jun 2006
HAL is a multi-disciplinary open access
archive for the deposit and dissemination of
sci-entific research documents, whether they are
pub-lished or not. The documents may come from
teaching and research institutions in France or
abroad, or from public or private research centers.
L’archive ouverte pluridisciplinaire HAL, est
destinée au dépôt et à la diffusion de documents
scientifiques de niveau recherche, publiés ou non,
émanant des établissements d’enseignement et de
recherche français ou étrangers, des laboratoires
publics ou privés.
blends on the regional air quality of the upper Rhine
valley
J.-F. Vinuesa, Ph. Mirabel, J.-L. Ponche
To cite this version:
J.-F. Vinuesa, Ph. Mirabel, J.-L. Ponche. Impacts of using reformulated and oxygenated fuel blends
on the regional air quality of the upper Rhine valley. Atmospheric Chemistry and Physics, European
Geosciences Union, 2006, 6 (8), pp.2176. �hal-00328443�
© Author(s) 2006. This work is licensed under a Creative Commons License.
Chemistry
and Physics
Impacts of using reformulated and oxygenated fuel blends on the
regional air quality of the upper Rhine valley
J.-F. Vinuesa*, Ph. Mirabel1, and J.-L. Ponche1
1Laboratoire de Physico-Chimie de l’Atmosph`ere, Centre de G´eochimie de la Surface, 1 rue Blessig, 67084 Strasbourg
Cedex, France
*now at: European Commission – DG Joint Research Centre, Institute for Environment and Sustainability, Italy
Received: 23 September 2005 – Published in Atmos. Chem. Phys. Discuss.: 23 November 2005 Revised: 15 March 2006 – Accepted: 20 April 2006 – Published: 20 June 2006
Abstract. The effects of using three alternative gasoline fuel
blends on regional air quality of the upper Rhine valley have been investigated. The first of the tested fuels is oxygenated by addition of ethyl-tertio-butyl ether (ETBE), the second is based on a reformulation of its composition and the third on is both oxygenated and reformulated. The upper Rhine valley is a very sensitive region for pollution episodes and several meteorological and air quality studies have already been per-formed. High temporal and spatial emission inventories are available allowing relevant and realistic modifications of the emission inventories. The calculation period, i.e., 11 May 1998, corresponds to a regional photochemical ozone pol-lution episode during which ozone concentrations exceeded several times the information threshold of the ozone directive of the European Union (180 µg m−3 as 1 hourly average). New emission inventories are set up using specific emission factors related to the alternative fuels by varying the frac-tion of gasoline passenger cars (from 50% to 100%) using the three fuel blends. Then air quality modeling simulations are performed using these emission inventories over the up-per Rhine valley. The impact of alternative fuels on regional air quality is evaluated by comparing these simulations with the one using a reference emission inventory, e.g., where no modifications of the fuel composition are included. The re-sults are analyzed by focusing on peak levels and daily aver-aged concentrations. The use of the alternative fuels leads to general reductions of ozone and volatile organic compounds (VOC) and increases of NOxlevels. We found different
be-haviors related to the type of the area of concern i.e. rural or urban. The impacts on ozone are enhanced in urban areas where 15% reduction of the ozone peak and daily averaged concentrations can be reached. This behavior is similar for the NOxfor which, in addition, an increase of the levels can
Correspondence to: J.-L. Ponche
be noted in urban plumes over rural areas. The most impor-tant decreases of the total VOC levels are mainly located over rural areas (more than 5% reduction of the levels except in urban plumes). By comparing these results with those from a local study related to the air quality of Strasbourg, we es-timate that the regional contribution to the urban air quality of Strasbourg allows an enhancement of the results by using alternative fuel blends at the regional scale.
1 Introduction
More and more major cities and regions, especially in indus-trialized countries, are subjected to the increase of the occur-rence of photochemical pollution episodes. In such regions, one of the main anthropogenic contributions of photochem-ical precursor compounds is that from road traffic (Derwent et al., 1998, 2003). The use of alternative fuels has been suggested at the end of the eighties in order to improve urban air quality by reducing combustion-related pollution. Indeed, reformulating the fuel (modification of the chemical compo-sition of the fuel e.g. by lowering of the aromatic fraction, and/or addition of oxygenated compounds, as here the ethyl-tertio-butyl-ether or ETBE) allows the modification of the composition of the emissions (Gaffney and Marley, 2000). Previous studies have shown discrepant results on pollutant emission levels. The addition of ETBE in gasoline fuels leads to a reduction of carbon monoxide emissions (Kivi et al., 1992; Reuter et al., 1992; Noorman, 1993) and VOC emis-sions (Noorman, 1993). Some authors report an increase of the NOxemissions (Reuter et al., 1992; Noorman, 1993)
while others show no influence (Kivi et al., 1992; McDonald et al., 1994). Lopez de Rodas and Marduel (1997) measured the emissions for some French cars using two ETBE gasoline fuel blends and a reformulated fuel. They showed that the
CO and VOC emissions are lowered by the addition of ETBE in the gasoline. On the contrary, the use of such fuels leads to an increase of NOxemissions. Only the use of the
refor-mulated gasoline fuel blend may simultaneously decrease the NOx, VOC and CO emission levels. By using the emission
factors from Lopez de Rodas and Marduel (1997), one can study the impact of using reformulated and oxygenated fuel blends on spatial emission inventories. Since the modifica-tion of the composimodifica-tion of exhaust pipe emissions is expected to affect the chemical transformations in the atmosphere, we have chosen to quantify and to analyze the effects of these alternative fuels on pollutant concentration fields. We have performed this analysis by building emission scenarios and simulating the air quality for a given representative photo-chemical pollution episode.
Few studies have addressed the effect of using alternative fuels on air quality and they are mainly focused on the use of methanol-contained fuels (Chock et al., 1994; Kumini et al., 1997, Hsieh et al., 2002, He et al., 2003). Recently, Vin-uesa et al. (2003) (referred to as V2003 in the rest of the discussion) studied the effect of using reformulated and oxy-genated gasoline fuel blends on the air quality of an urban area. In particular, their work addressed the impacts of these fuels on the emissions of primary and secondary pollutants with respect to the specific European car fleet and emission speciation. They showed that the use of such fuels leads to an increase of NO concentrations and to a significant decrease of the VOC levels while ozone concentration reductions ap-pear to be modest. The purpose of our paper is to extend their work to the regional scale. We intend to relate the effects of using alternative fuels with the type of area, i.e., urban and rural. Moreover, the comparison of the results obtained with the work of V2003 allows us to estimate the contribution of the regional scale transport of air pollutants on urban air qual-ity e.g., at local scale.
The structure of the paper is as follows. In Sect. 2, we present the emission inventories and scenarios. Details of the numerical simulation characteristics and the results of the benchmark simulation are discussed in Sect. 3. In the follow-ing section, the impacts of usfollow-ing alternative fuels on regional air quality are evaluated and analyzed. A discussion on the comparison between results obtained at the local or at the re-gional scales is presented in Sect. 5 followed by conclusions in Sect. 6.
2 Emission inventories
The regional domain of investigation is the upper Rhine val-ley. This domain that regroups regions of three countries (Germany, Switzerland and France) can be considered as a very sensitive area for atmospheric pollution episodes es-pecially photochemical ones during summertime. This is mainly due to the topography and the level of urbanization of this region. The valley is surrounded by mountains on three
sides: Vosges, the Black Forest, and Jura on the western, eastern and southern parts respectively. The highest peaks are the Feldberg (1 493 m) and the Grand Ballon (1 425 m) in the southern parts of respectively the Black Forest and Vos-ges. The bottom of the valley is very flat and is in the range of 120 to 180 m from north to south. This configuration have large impact on the dynamics of the low atmosphere and it leads to large periods of weak wind with temperature inver-sion and even if the topography favors the emergence of lo-cal valley and mountains breezes, polluted air masses remain over the valley and are hardly dispersed at regional scale. Even if strong regulations on industrial and car emissions are applied in these three countries, the occurrence of pho-tochemical episodes is still increasing due to this air quality sensitivity. Thus this area has been extensively studied in the past (e.g., Adrian and Fiedler, 1991; REKLIP, 1995, 1999; Schneider et al., 1997; Ponche et al., 2000).
2.1 INTERREG II emission inventory
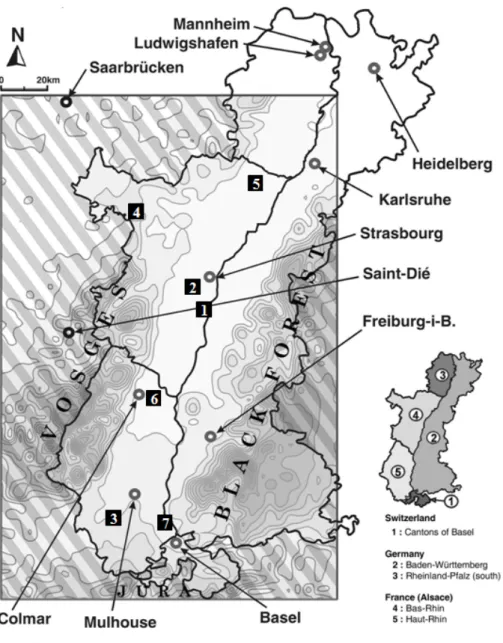
The base case emission inventory has been derived from the yearly inventory performed in the framework of the whole upper Rhine valley INTERREG II program. This air quality management program concerns three different coun-tries within administrative boundaries (Fig. 1): Switzerland (Swiss Cantons of Basel City and Basel Countryside), Ger-many (State of Baden-W¨urttemberg and part of Rheinland-Pfalz) and France (Alsace Region). This program included the elaboration of a high space resolution (1×1 km2) emis-sion inventory for the reference year 1998. Several pub-lic and private offices participated to identify and quantify the different contributions of this emission database and our Laboratory has participated for the French part. The area under study is 20 623 km2and the density of population is important (6.327 Millions of inhabitants, which is equiva-lent to about 300 inhab./km2). The population distributions (and density in inhab./km2) are 0.454 M (820), 4.160 M (352) and 1.713 M (210) for Switzerland, Germany and France, re-spectively. There are several main cities (Karlsruhe, Stras-bourg, Freiburg-im-Brisgau, Mulhouse, Basel) but an impor-tant part of the inhabiimpor-tants lives in the countryside in numer-ous small communities. Moreover, two main highways (total of 811 km) bearing a heavy volume of local, regional and in-ternational road traffic go across this part of the Rhine valley. The vehicle fleet (registered in the whole area) is 3.7 M in-cluding 331 230 heavy-duty vehicles.
The approach chosen for most of the sources was the bottom-up methodology presented in Ponche et al. (2000), Vinuesa (2000) and Ponche and Vinuesa (2005). Biogenic and anthropogenic contributions, as well as all the emitted chemical compounds, which can have an impact on the air quality, were considered. Further details about this air qual-ity emission inventory are reported in INTERREG II (2000). Supplementary data have been collected for the adjacent regions and the same methodology of emission calculation
Fig. 1. Extension of the emission inventory and scenario, computational domain, topography of the investigation area and location of the main measuring stations of the Air Quality survey network (1: DRIRE; 2: Strasbourg Ouest; 3: Mulhouse Sud; 4: Vosges du Nord; 5: Nord-Est Alsace; 6: Colmar Est; 7: District des 3 fronti`eres).
has been applied to obtain a investigating domain of 144 km (East-West)×216 km (North-South) more suitable for air quality modeling purpose. Then the hourly emission inven-tories were derived from INTERREG II, by collecting hourly data when available and, if not, by using various time distri-bution functions related to the different emission source cate-gories. In addition, specific speciation of NOx(NO and NO2)
and VOCs were used for each category of sources to allow an extensive chemical description of the emissions. This paper
focuses on May 11, 1998, to be consistent with the previous study which was done at a local scale (V2003). This day falls in the typical regional photochemical ozone episode of 9–15 May 1998. Low synoptic wind and high temperatures were observed which lead to 28 exceedances of the infor-mation threshold of 180 µg m−3in the urban area of Stras-bourg. The maximum ozone concentration has been mea-sured at 193 µg m−3on 11 May. During this day, the road traffic has contributed to the total regional daily emissions of
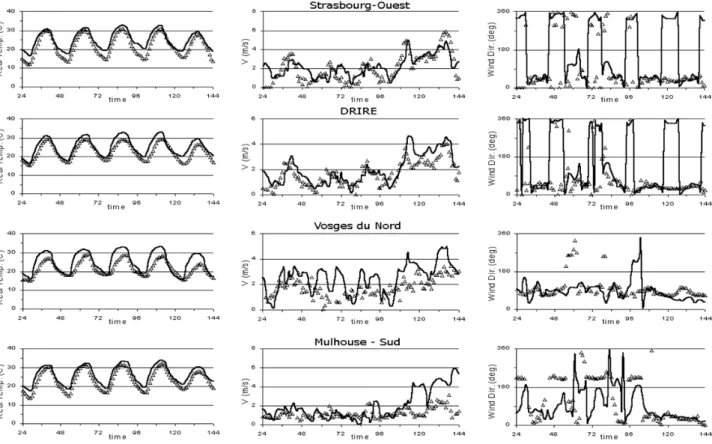
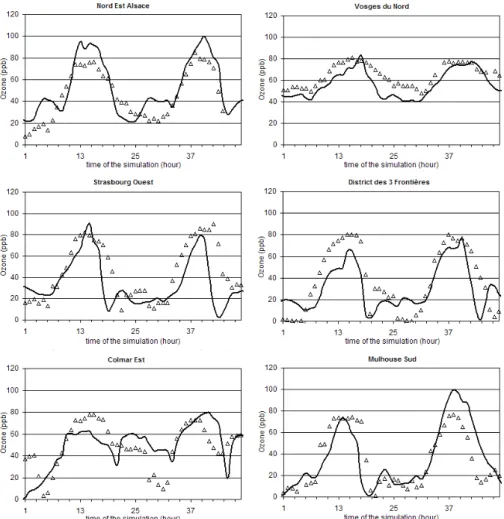
Fig. 2. Evolution of the temperature (first panel from left to right), horizontal wind velocity (second panel) and direction (third panel) for a selection of the Alsacian measuring sites of the ASPA Air Quality survey network. The solid lines indicate the model results. The period represented is the 10 May to 14 May 1998. DRIRE measuring station is located in the centre of the urban area of Strasbourg, Strasbourg-Ouest and Mulhouse-Sud are suburban measuring sites and Vosges du Nord is a rural one in a forested area located 60 km North East of Strasbourg (from Ponche and Vinuesa, 2005).
16.5%, 78.1% and 58.1% for the VOC, CO and NOx
respec-tively (Table 1). The comparison of these contributions with those on the local scale (see V2003) shows that CO emission contribution is less important at the local scale (73.4%) than the regional one, mainly due to the lower regional industrial contributions (fossil fuels have been significantly decreased for 10 years and mainly replaced by natural gas). On the con-trary, the regional contributions of NOxand VOC are lesser
than those at the local scale (68.6% and 37.6% respectively) reflecting the denser urban road traffic contribution on the local scale.
2.2 Road traffic emission scenarios
This study is focusing on the impact of modified fuels used by gasoline passenger cars (GPC) and only this contribu-tion of the hourly emission inventories has been modified. The available modified fuels emission factors issued from the UTAC (Union Technique de l’Automobile du motocy-cle et du Cymotocy-cle) experiments (Lopez de Rodas and Marduel, 1997) have been used in the whole domain, i.e., Swiss, Ger-man and French GPC fleets. The fraction of the vehicles
equipped with a three-way catalytic converter is very differ-ent from one country to another in 1998: 85% for Switzer-land, 65% for Germany and 26% for France. The other road traffic characteristics associated with the emission calcula-tions (traffic volume, diesel passengers cars, light and heavy duty vehicles) were kept constant. The methodology has al-ready been detailed in V2003.
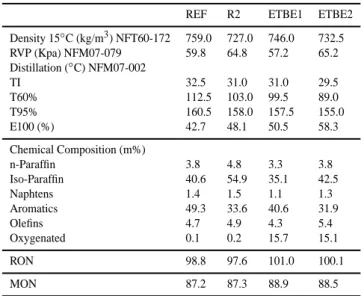
The emission factors are related to a reformulated fuel (so-called R2) and two oxygenated fuel blends (the so-(so-called ETBE1 and ETBE2), both containing 15% of ETBE. The composition of these fuels is given in Table 2. Briefly, for R2, the iso-paraffins have been increased (from 40.6 wt% to 54.9 wt%) to reduce the aromatic fraction (49.3 wt% to 33.6 wt%). For ETBE1 fuel, 15 wt% of ETBE has been added, leading to a lowering of all the others compounds such as iso-paraffins (40.6 wt% to 35.1 wt%) and aromat-ics (49.3 wt% to 40.6 wt%). Finally, for ETBE2, both ad-dition of 15% of ETBE and reformulation are considered re-sulting in a slight increase the iso-paraffins (from 40.6 wt% to 42.5 wt%) and lower the aromatic compounds more than for ETBE1 (49.3 wt% to 31.9 wt%). The sulfur content has been adjusted for all the modified fuels to 80 ppb. These
Table 1. Daily emissions of CO, VOC and NOxfor the INTERREG II area and for 11 May 1998 by source identification classification
CORINAIR SNAP94 version 1.1.
Sources CO VOC NOx
tons % tons % tons %
Combustion in energy and transformation industries 2.5 0.2 1.0 0.1 4.1 1.0 Non-industrial combustion plants 189.0 16.4 28.9 2.7 15.9 4.0 Combustion in manufacturing industry 11.9 1.0 10.9 1.0 20.5 5.1
Production processes 0.1 0.0 5.7 0.6 12.9 3.2
Extraction, distribution of fossil fuels, geothermal energy 45.9 4.3
Solvent and other product use 0.8 0.1 212.5 20.1 2.5 0.6
Road transport 903.5 78.1 174.3 16.5 231.2 58.1
Other mobile sources and machinery 17.5 1.5 5.0 0.5 18.6 4.7
Waste treatment and disposal 5.6 0.5 164.8 15.6 1.5 0.4
Agriculture and forestry, land use, wood stock change 321.2 30.4
Nature 9.2 0.9
Point sources 25.8 2.2 77.2 7.3 91.0 22.9
Total 1157.1 100.0 1056.7 100.0 386.5 100.0
Table 2. Characteristics of the fuels. TI is the initial temperature for the beginning of the distillation. T60% and T95% represents corresponding temperatures for distilled percentages. E100 report the percentage evaporated at 100oC. RVP is the Reid Vapor Pres-sure. RON and MON represent the Research and the Motor Octane Numbers.
REF R2 ETBE1 ETBE2 Density 15◦C (kg/m3) NFT60-172 759.0 727.0 746.0 732.5 RVP (Kpa) NFM07-079 59.8 64.8 57.2 65.2 Distillation (◦C) NFM07-002 TI 32.5 31.0 31.0 29.5 T60% 112.5 103.0 99.5 89.0 T95% 160.5 158.0 157.5 155.0 E100 (%) 42.7 48.1 50.5 58.3 Chemical Composition (m%) n-Paraffin 3.8 4.8 3.3 3.8 Iso-Paraffin 40.6 54.9 35.1 42.5 Naphtens 1.4 1.5 1.1 1.3 Aromatics 49.3 33.6 40.6 31.9 Olefins 4.7 4.9 4.3 5.4 Oxygenated 0.1 0.2 15.7 15.1 RON 98.8 97.6 101.0 100.1 MON 87.2 87.3 88.9 88.5
formulations has been chosen by the participants of the french program AGRIculture pour le Chimie et l’Energie (ECODEV/AGRICE-CNRS) and the European ALTENER2 program.
The tested vehicle fleet is composed of a Renault Laguna, a Renault Twingo, a Renault R19 and a Peugeot 406 V6 that have already covered a distance of 21 000, 18 000, 117 500 and 27 000 km respectively. Only the Renault Laguna and Twingo have an emission-reducing device i.e., a three-way
Table 3. Characteristics of the driving cycle used for the tests.
Road types 4xECE15 EUDC NEDC
Distance (km) 4.052 6.995 11.007
Average speed (km.h−1) 18.7 62.6 32.7 Maximum speed (km.h−1) 50 120 120
converter. The tests were performed according to the NEDC new European driving modes, in which the 40 s idle period, following the cold start, has been removed. During this cy-cle, the vehicles covered a distance of 11 km with an average speed of 33.6 km.h−1. Two main parts compose the cycle : an urban phase (ECE 15 cycle) repeated four times, includ-ing street network, main road and urban highways (4 km with an average speed of 18.7 km.h−1) and an extra-urban phase (7 km with an average speed of 62.6 km.h−1) which regroups the extra-urban roads and highways (EUDC cycle). All the characteristics are summarized in Table 3.
For the sake of consistency, the emission factors for road traffic used previously in the INTERREG II emission inven-tory have been replaced by those of the reference fuel REF. Therefore, a direct evaluation of the emission changes be-tween the road traffic contribution in the reference and the modified inventories is suitable. Then, the scenarios are based on the replacement of the reference fuel (REF) by the R2, ETBE1 and ETBE2 fuel blends for different GPC fleet fractions. We have defined nine emission scenarios ac-cording to the three types of fuel blends and to three differ-ent percdiffer-entages of the GPC fleet using these fuels (50, 80 and 100%). The GPC fleet has been divided into 4 vehicle types with respect to the vehicles tested, depending on the engine capacity and on the presence or absence of catalytic
Table 4. Aggregated emission factors in g.km−1for NOx, and VOC
and for different types of road when100% of the fuel-GPC fleet is using the fuel blends REF, ETBE1, ETBE2 and R2.
Road types Highway Road Urban road
Fuels NOx VOC NOx VOC NOx VOC
REF 0.478 0.357 0.572 2.127 0.543 8.701 ETBE1 0.488 0.310 0.595 1.294 0.587 3.234 ETBE2 0.484 0.295 0.580 1.363 0.552 3.484 R2 0.445 0.315 0.537 1.260 0.508 3.112
Table 5. Total daily scenario-wide emissions of the NOx, total
VOCs and main VOC splitted compounds (in kg) when 100% of the fuel-GPC fleet is using the fuel blends REF, ETBE1, ETBE2 and R2.
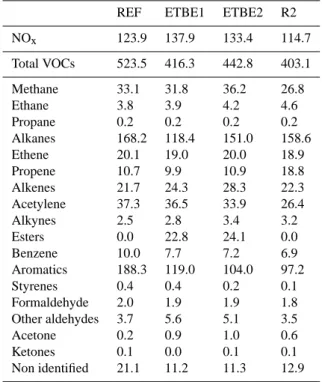
REF ETBE1 ETBE2 R2
NOx 123.9 137.9 133.4 114.7 Total VOCs 523.5 416.3 442.8 403.1 Methane 33.1 31.8 36.2 26.8 Ethane 3.8 3.9 4.2 4.6 Propane 0.2 0.2 0.2 0.2 Alkanes 168.2 118.4 151.0 158.6 Ethene 20.1 19.0 20.0 18.9 Propene 10.7 9.9 10.9 18.8 Alkenes 21.7 24.3 28.3 22.3 Acetylene 37.3 36.5 33.9 26.4 Alkynes 2.5 2.8 3.4 3.2 Esters 0.0 22.8 24.1 0.0 Benzene 10.0 7.7 7.2 6.9 Aromatics 188.3 119.0 104.0 97.2 Styrenes 0.4 0.4 0.2 0.1 Formaldehyde 2.0 1.9 1.9 1.8 Other aldehydes 3.7 5.6 5.1 3.5 Acetone 0.2 0.9 1.0 0.6 Ketones 0.1 0.0 0.1 0.1 Non identified 21.1 11.2 11.3 12.9
converters. Table 4 shows an example of aggregated emis-sion factors calculated when the whole GPC fleet is using the alternative fuels. One can notice that all the fuels lead to a de-crease of VOC emissions. The main difference is that the use of ETBE1 and ETBE2 increases the NOxaggregated
emis-sion factors. In addition, the VOC emisemis-sion inventory has been extended to take into account the 128 emitted species measured during the UTAC experiments.
In order to emphasize the differences of the emissions in-volved by the use of the various fuel-blends, the daily total emission changes when the whole GPC fleet is using such fu-els is presented in Table 5. Both ETBE and R2 fufu-els decrease total VOC emission levels while only R2 allows a decrease of the emissions of NOx. Alkanes and aromatics are the VOCs
for which the emissions are the most affected by the use of alternate fuels. In the case of the use of ETBE, aldehydes, alkenes and ethers also show modifications to a certain ex-tend.
3 Numerical setup and benchmark simulation
3.1 Numerical setup
The simulations are performed using EZM (EUMAC Zoom-ing Model). This model is divided into two parts: first, the dynamics are calculated by the meteorological mesoscale model MEMO and second, the transport of the reactive chemical species is addressed by the model MARS (see Moussiopoulos (1995) for a complete description).
Since the calculation of the meteorological fields with the MEMO model has already been described in a previ-ous study (Vinuesa et al., 2001), the numerical setup and the results of the simulation are only briefly summarized here. The prescribed grid has 36×54×35 points in the horizontal and vertical directions, representing a domain of 144 km×216 km×6000 m. The calculations have been per-formed from 9 May to 14 May 1998. The geostrophic wind and the initial vertical potential temperature profiles have been defined using measurements issued by the regional air quality survey network of Alsace (Association de Surveil-lance et d’´etude de la Pollution atmosph´erique en Alsace or ASPA) for the first 1200 m from the ground (which is at about 140 m above sea level) in the suburban northern part of Stras-bourg and, by the Deutsche Wetterdienst (DWD-Stuttgart) in Stuttgart (100 km north-east from Strasbourg) for the alti-tudes above this height. In Fig. 2, the time evolutions of the temperature (first panel from left to right), horizontal wind velocity (second panel) and wind direction (third panel) for a selection of the Alsacian meteorological sites are presented (see their locations in Fig. 1). The differences obtained in the temperature are mainly due the effect of averaging pro-cedures on the topography and the land-use over 4×4 km2. Nevertheless, the comparison between the measurements and the model results show a good agreement. One can notice that even the change of wind regime, i.e. from low to high geostrophic wind at the end of the week for the north part of the modeling domain, is reproduced with good accuracy.
The boundary conditions and the background concen-trations of reactants are taken from the network measure-ments done by the ASPA-Strasbourg. Measuremeasure-ments from rural stations located in the Vosges Mountains provide the background ozone levels (around 70 ppb). Since these sta-tions are located in rural areas far away from the sources of pollutants, they satisfy the necessary requirements to be considered as background measurement sites. In addi-tion, the measurements performed in the centre of the val-ley between Strasbourg and Karlsruhe, the so-called North-East Alsace, allow us to take into account the urban plume
Fig. 3. Evolution of the ozone concentrations for a selection of the Alsacian pollutant measurement sites. The solid lines indicate the model results. The period represented is the 10 May to 11 May 1998. “Nord-Est Alsace” and ”Vosges du Nord” stations correspond to rural and mountainous sites located 60 km north east of Strasbourg and 90 km north of Strasbourg respectively. “Strasbourg-Ouest”, “Colmar-Est”, and “Mulhouse-Sud” correspond to semi-urban measuring stations. The measuring station “District des 3 fronti`eres” is also an semi urban one, located close to the Swiss-German- French border, south east of the domain.
coming form Karlsruhe region. Using these data, the NOx
boundary conditions were set at 9 ppb. The simulation with the chemical transport model MARS covers a 48-h period starting on 10 May 1998 at 0 h 00 Local Standard Time (LST). Only the calculation results obtained for the sec-ond day has been considered assuming that 24 h of pre-run are enough to provide realistic background concentra-tions. The chemical mechanism used is a modified ver-sion of RACM (Stockwell et al., 1997) where reactions ac-counting for the degradation scheme of ETBE were pre-viously implemented. The degradation scheme of ETBE by HO. has been added to the RACM mechanism with a rate constant of 9.73×10⁻¹²cm3molecule−1s−1 (Smith et
al., 1992; Kirchner, 1999). In addition, the degradation of the tertio-butyl formate (TBF), a product of the pre-vious reaction, has been added, with a rate constant of 7.4×10⁻¹³cm3molecule−1s−1(Kirchner, 1999). Reactions (1) and (2) are budget reactions and reads, according to the RACM chemical species:
ETBE + OH → 0.13HC5 + 0.54TBF + 0.87HCHO
+0.87XO2+0.80HO2+0.20MO2+0.18ALD
+0.18KET + 0.04HC3, (1)
TBF + OH → 0.3(ALD + HO2+XO2) +0.7ACO3, (2)
where the model species HC3and HC5regroup alkanes,
al-cohols, esters and alkynes. XO2accounts for additional NO
to NO2conversions, MO2represents methyl peroxy radical
and ACO3 regroups all the acetyl peroxy and higher
satu-rated acyl peroxy radicals. Further details can be found in Atkinson (1994), Kirchner et al. (1997) and V2003.
3.2 Base case simulation
The reference emission scenarios have been recalculated us-ing emission factors determined for the reference fuel (REF) and driving modes previously presented (see Sect. 2). In spite
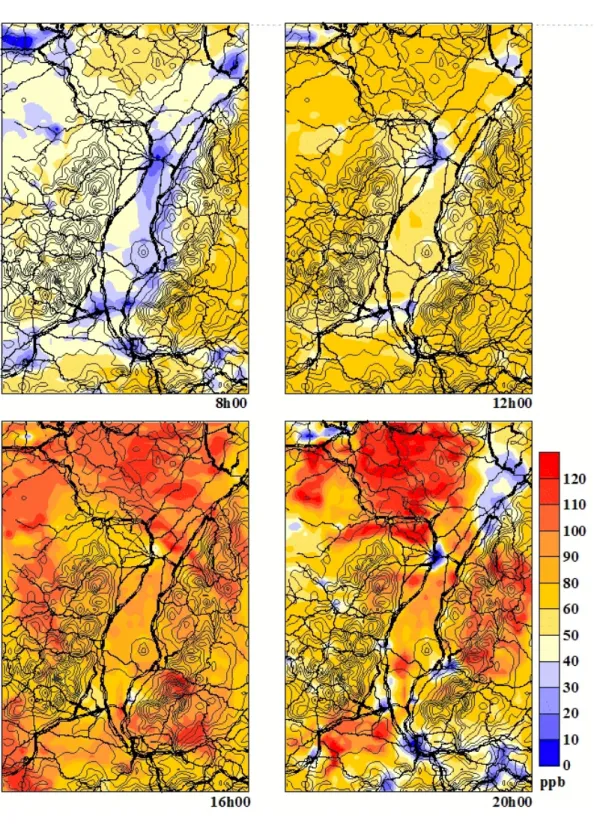
Fig. 4. Ozone concentrations fields calculated at 8 h 00, 12 h 00, 16 h 00 and 20 h 00 LST (Local Standard Time). Heavy traffic roads in dark lines and topography in grey lines are represented for convenience.
of the resulting changes compared to the real case, the ref-erence case gives similar concentration fields then the ones analyzed by Ponche and Vinuesa (2005) and the time evo-lution of the ozone concentration for a selection of the Al-sacian meteorological sites as reproduced in Fig. 3 show a good agreement with the measurements.
Figure 4 shows the ozone concentration fields at 8 h 00, 12 h 00, 16 h 00 and 20 h 00 LST. One can notice that the de-pletion process of ozone is favored in the morning. The most important ozone depletion zones are located in the urban ar-eas and along the main road network where high NO emis-sions occur (morning traffic peak). Even at 8 h 00 LST, the
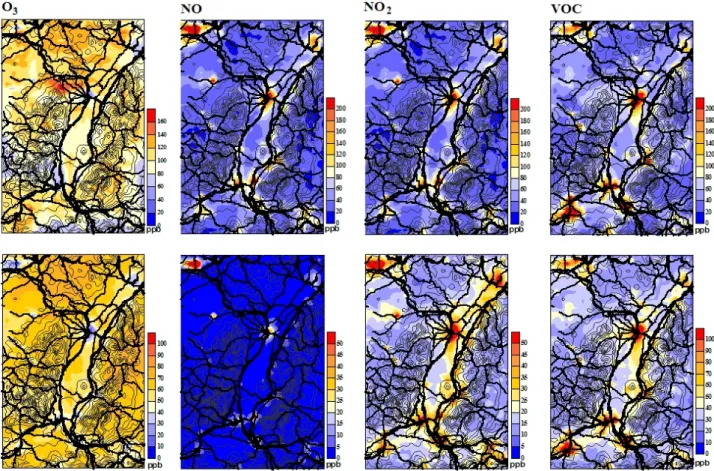
Fig. 5. Hourly maximum concentrations HMC (upper row) and daily average concentrations DAC (lower row) for ozone, nitrogen oxide, nitrogen dioxide, and volatile organic compounds calculated with the reference emission scenario (REF). Heavy traffic roads in dark lines and topography in grey lines are represented for convenience.
ozone levels in rural areas are still under the control of the background conditions with low NO levels. Thus NO is preferentially oxidized via the VOC-oxidation process and the residual ozone in the mountainous areas resulting from the photochemical activity of the previous day remains with high levels. From 12 h 00 LST, the ozone production from precursors contained in urban plumes and its low depletion over poor NO concentration areas results in the increase of its background concentrations. Consequently, first, the max-imum ozone levels are reached in the afternoon and in the evening, and then the highest levels are located outside the urban plume areas, i.e. in the rural and mountainous zones.
Similar conclusions can be drawn from Fig. 5 where the hourly maximum concentrations (HMC) and the daily aver-aged concentrations (DAC) for ozone, NOxand VOC are
pre-sented. Notice that the HMC and DAC maps allow locating the concentration peaks and the background levels respec-tively and that HMC map is a so-called composite map since the concentration peaks can be reached at different times. The spatial distribution of the HMC and DAC over the do-main is quite similar for each pollutant. For NOx, their
val-ues are strongly correlated with the level of urbanization of
the area and also with the road network. For O3 and the
VOC, the correlation between concentration levels and road traffic is hardly established since O3is a secondary pollutant
and road traffic contributes only to 16.5% of the VOC emis-sions. One can notice different HMC/DAC ratio behavior. Especially for NO, the ratio HMC/DAC is very high com-pared to that of the other pollutants and very high ratio can be noticed in the urban areas and the rural areas close to the main roads. This points out that its levels are mainly related to road traffic emissions since these latters are intermittent during the day. Also high HMC/DAC ratios are found in the neighborhood of the urban plumes and especially the one of Strasbourg suggesting a strong connection between road traf-fic emission and ozone production. Indeed, in those regions, the levels of NO are too low to deplete the ozone produced by its precursors induced by road traffic emissions. In the center of the valley and in urban area where NO levels are sufficient to limit the ozone generation, we found the lowest HMC and DAC levels.
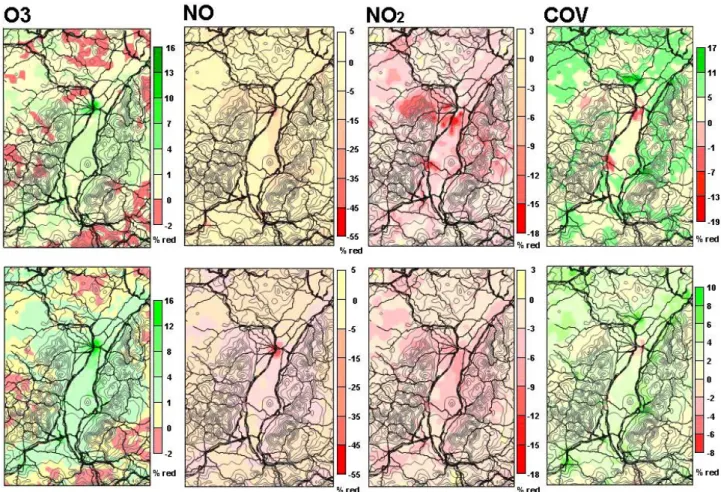
Fig. 6. Results obtained when 100% of the GPC is using ETBE1 fuel. Reduction percentages of maximum concentration levels RIM (upper row) and reduction percentages of daily average concentration levels RIA (lower row) for ozone, nitrogen oxide, nitrogen dioxide, and volatile organic compounds. Heavy traffic roads in dark lines and topography in grey lines are represented for convenience.
4 Effects of the modified fuel blends on regional air quality
We focus our discussion on the hourly averaged maximum concentrations (HMC) and the daily average concentrations (DAC) since they provide useful information on peak lev-els and background concentrations respectively. However, its appears more convenient to quantify directly the modi-fications of these quantities induced by the use of alterna-tive fuels. Therefore we introduce the following relaalterna-tive im-pact factors on the HMC and the DAC, the so-called relative impact factor on the hourly maximum concentrations (RIM) and relative impact factor on the daily average concentrations (RIA) respectively,
RIM=(HMCref−HMCsc) HMCref
, (3)
RIA=(DACref−DACsc) DACref
. (4)
The RIM and RIA are calculated for each grid-cell. The indices ref and sc refer to the reference simulation and the
scenarios, respectively. Positive (negative) values correspond to lower (or higher) concentrations simulated using the emis-sion scenario compared to the base case simulation. Note that this definition allows to clearly distinguish between improve-ment (positive values) and degradation (negative values) of the air quality.
Figure 6 shows the RIM and RIA for ozone, NO, NO2and
VOC when 100% of the GPC fleet is using ETBE1 fuel. The levels of nitrogen oxides show a dramatic increase. At the regional scale, the NO maximum and background concen-trations are increased (between 0% and −5% for both RIA and RIM). In city plumes, the increases can reach between
−15% and −50% for both relative impact factors. The same observation can be made for NO2 even if the impacts are
less important. As a result, the effect of using ETBE1 fuel on the NOxRIA and RIM levels is significantly unfavorable.
The concentration levels of NOxare correlated with the
emis-sion from road traffic. Indeed the main areas affected by the changes in NOxemission factors are the urban and suburban
zones. Significant increases in the impact factors in urban plumes are directly related to the increase in the emission
factors. In that sense, the impacts of using ETBE1 fuel on NOx are directly correlated with the location of the
emis-sions.
Favorable impacts (i.e., positive RIM and RIA) on the VOC at the regional scale can be noticed. Indeed, the reduc-tion in HMC and DAC can reach 10% locally. Compared to the NOx, there is no direct spatial correlation between VOC
emission from road traffic and impact factors. Even if the changes in emission levels are related to road traffic, there is no relevant impact close to the emission sources. On the con-trary, the most important impacts are located in rural areas, and away from urban and road plumes. These results suggest that the background VOC concentration levels are mainly af-fected by the reduction of the emitted VOC more subject to the oxidation by HO.radicals. However, some increases can be located in the east of Strasbourg and Colmar; between
−1% and −13% for the HMC and between −2% and −4% for the DAC and the use of ETBE1 fuel only show a small im-pact on VOC levels in city plumes. In these regions, where VOC emissions are reduced, we found very high increases of NOxlevels and high decrease in ozone levels suggesting
that the NOx-oxidation pathway is favored with respect to the
oxidation of VOC. This effect combined with the transport of VOC originated from urban sources result in the smaller decrease and even locally some increases of VOC levels.
Ozone levels are decreased both in terms of peak and back-ground concentrations. The main positive impacts are lo-cated in urban areas, such as Strasbourg and Mulhouse, with reductions reaching more than 10% locally. Some impor-tant impacts can also be located in the vicinity of the core of the valley for the RIM and in its centre for the RIA. In urban areas, the use of ETBE1 fuel results in a 63% reduc-tion of VOC emissions (see Table 4). Since there are less VOC available for the oxidation of NO in NO2and NO levels
are increased, the depletion of ozone by NO within the NO-oxidation pathway is the main process controlling ozone RIA and RIM. As a result, the most important reduction in the im-pact factors takes place in such areas. The same analysis can be done in the vicinity of roads and highways. However, the small impact and sometime increase of VOC levels in urban plumes reduces the benefits of using ETBE1 to lower ozone levels in these particular areas. In other rural areas, only weak reductions of ozone levels are reported since the reduction of VOC mainly benefits to the less reactive ones and NO level show only a increase not enough important to favor the NOx-oxidation and the titration of NO by ozone.
This clearly shows that the emissions from road traffic con-trol the ozone levels at the local scale, and in the vicinity of the sources. On the contrary, at the regional scale and except in urban plumes, it also seems that road traffic does not have a significant impact on rural ozone levels.
Since the impacts show a near-linear effect with respect to fractional change in the fleet penetration, only the results concerning 50% and 100% of the GPC fleet using alterna-tive fuels are shown in Tables 6 and 7. Table 6 quantifies
the impacts of the use of oxygenated additives (ETBE1 and ETBE2) and reformulated fuel (R2) on ozone, NO, NO2and
VOC. It shows the maximum, the minimum, the average over the whole area and the standard deviation of the RIM and the RIA, respectively. For both impact factors and for all the compounds, the maximum effects can be seen when 100% of the GPC fleet uses the alternative fuel-blends. For all the scenarios, the ozone levels are lowered and the most favorable fuel blend is the ETBE1, which shows a decrease of 2.02% and 1.88% for the RIM and the RIA, respectively. This fuel is also showing the greatest decrease in VOC lev-els and the biggest increase on NOxlevels for both impact
factors. By examining the only-reformulated fuel R2 and the reformulated and oxygenated fuel ETBE2, it appears that R2 is giving the most favorable impact factors in terms of NOx
and VOC levels. As an example, the corresponding RIA are
−2.13%, −1.21% and 2.67% for NO, NO2 and VOC,
re-spectively. By reducing NO levels, the oxidation of NO by ozone becomes less likely and less ozone is depleted lead-ing to the lowest impact on ozone levels when comparlead-ing to the other fuels. For ETBE2 that is both oxygenated and re-formulated, the RIA for NO, NO2and VOC read −3.88%,
−2.39% and 1.99%, respectively. This increase of NO and the reduction of the most reactive VOC (see Table 7), favors the NOx-oxidation pathway. As a result, a bigger reduction in
ozone levels is found compared to R2 but smaller compared to ETBE1 for which the NO and NO2RIM read −5.13% and
−3.09%, respectively.
We have noticed previously that the averaged impact fac-tors of NOxare directly correlated with the emission factors.
Indeed, the lowest increases of RIM and RIA are reported for the lowest emission factors (R2) and the highest increases are observed for ETBE1. Since the splitting of the VOC plays an important role in ozone depletion and production processes, one will find the quantitative impacts of using the alternative fuels on several VOCs in Table 7. This table shows the aver-aged values over the whole area and the standard deviations of the RIM and the RIA. Apart from the methane, the alkenes and the generic aldehydes, all the scenarios lead to a general decrease of the concentration peaks and the background con-centrations. The levels of alkenes are increasing for almost all the scenarios. The same impact can be observed for the generic aldehydes for only ETBE1 and ETBE2. Notice that a negative impact on methane levels is induced only by the fuel ETBE2. The higher reactive alkane and aromatic levels reveal the most important positive impacts. These reductions are related to the reformulation of the fuels, which is linked to lower emissions due to reduction of the corresponding ag-gregated emission factors. In particular, in urban areas where the impacts for such compounds reach their maximum, the emission factors are reduced by more than 50%.
In order to estimate the sensitivity of the results pre-sented previously and to distinguish which characteristic of the emission (amount or reactivity) is driving these results, we have defined 4 extra emission scenarios. These
scenar-Table 6. Quantitative impacts of the use of oxygenated additives (ETBE1 and ETBE2) and reformulated fuel (R2) on ozone, carbon monoxide, NO, NO2and volatile organic compounds concentrations. For all species, the impacts on hourly maximum concentrations (RIM)
and the daily average concentrations (RIA) are given in percentage. Positive (negative) values correspond to a decrease (increase) of the RIM and RIA.
Fuel blends ETBE1 ETBE2 R2
GPC fleet (%) 50 100 50 100 50 100 RIM O3 Maximum 8.67 16.28 6.84 12.76 5.38 10.17 Minimum −2.64 −4.57 −1.56 −2.20 −1.52 −2.34 Mean 1.09 2.02 0.71 1.26 0.58 1.05 σ 1.00 1.83 0.66 1.16 0.56 1.00 NO Maximum 29.49 50.94 1.80 3.84 1.47 2.69 Minimum −27.00 −60.51 −19.56 −41.49 −14.94 −30.81 Mean −2.25 −5.03 −1.59 −3.83 −0.82 −2.05 σ 2.19 4.70 1.45 3.25 1.03 2.27 NO2 Maximum 28.87 57.60 0.54 1.15 1.03 1.39 Minimum −10.21 −19.63 −9.00 −17.57 −7.48 −14.83 Mean −1.87 −4.40 −1.42 −3.45 −0.59 −1.80 σ 1.52 3.20 1.08 2.27 0.77 1.59 VOC Maximum 11.24 19.95 8.42 16.59 9.61 18.54 Minimum −7.15 −16.49 −9.35 −21.33 −7.84 −18.50 Mean 3.53 4.98 2.48 2.84 2.91 3.96 σ 2.01 2.88 1.76 2.52 1.81 2.61 RIA O3 Maximum 9.97 18.66 8.09 15.32 6.15 11.76 Minimum −7.25 −14.78 −0.19 −0.45 −0.20 −0.27 Mean 0.93 1.88 0.64 1.29 0.43 0.91 σ 0.86 1.69 0.61 1.23 0.46 0.92 NO Maximum 31.04 56.36 0.68 1.51 0.34 0.88 Minimum −27.14 −56.36 −13.84 −28.73 −11.06 −22.70 Mean −2.37 −5.13 −1.58 −3.88 −0.90 −2.13 σ 1.85 3.92 1.21 2.68 0.87 1.87 NO2 Maximum 20.67 41.44 0.42 1.15 0.36 0.55 Minimum −12.35 −22.63 −5.76 −11.52 −4.38 −8.96 Mean −1.32 −3.09 −0.98 −2.39 −0.39 −1.21 σ 0.96 2.01 0.61 1.33 0.41 0.89 VOC Maximum 8.18 12.44 6.16 10.15 6.96 11.43 Minimum −3.36 −8.12 −4.68 −11.07 −3.72 −9.13 Mean 2.31 3.31 1.67 1.99 1.92 2.67 σ 1.14 1.67 0.94 1.34 1.00 1.46
ios are based on systematic reductions or increases in the contribution of road traffic: increase/decrease of 10% of NOxemissions from the GPC fleet (SCE1+/SCE1−) and
in-crease/decrease of 10% of VOC emissions from the GPC fleet (SCE2+/SCE2−). The results of these scenarios are given in Table 8. The mean values of the peak and back-ground concentration of the NOxare directly correlated with
the emission levels. For instance, the SCE1+ leads to an in-crease of 2.34% and 2.07% of the NO and NO2RIA,
respec-tively and the SCE1− gives NO and NO2RIA decreases of
2.22% and 2.10% while the SCE2+/SCE2− scenarios give impacts one order of magnitude less important. One will
notice the same behavior for the VOCs. The main interest of these scenarios is to show the impact of these controlled emission reductions on the ozone levels, which are low (less than 0.8%) compared to emission scenarios using alternative fuels. Since the use of both ETBE fuel-blends reduce the to-tal scenario wide emissions of VOC but increase the ones of NOx(Table 5), these scenarios can be considered as
scenario-like combination of SCE1+ and SCE2-. The corresponding scenario-like for R2 combines SCE1− and SCE2−. Since the sensitivity analysis shows that an improvement of re-gional ozone levels can be obtained by increasing NOx
Table 7. Quantitative impacts on hourly maximum concentrations (RIM) and daily average concentrations (RIA) for several VOCs. The average over the whole domain and the standard deviation σ are given.
Fuel blends ETBE1 ETBE2 R2
GPC fleet (%) 50 100 50 100 50 100 RIM Methane Mean 0.13 0.19 -0.17 -0.39 0.12 0.17 σ 0.18 0.29 0.27 0.61 0.18 0.31 Ethane Mean 6.35 7.98 1.93 -1.33 5.35 6.19 σ 3.43 5.09 3.40 5.97 3.33 5.15
Low Reactive Alkanes Mean 1.63 2.44 0.75 0.73 0.59 0.58
σ 1.12 1.66 0.77 1.12 0.70 1.09
Moderately Reactive Alkanes Mean 4.50 6.76 2.10 2.18 1.29 1.03
σ 2.45 3.59 1.64 2.31 1.39 2.13
Highly Reactive Alkanes, Aromatics Mean 12.51 18.57 14.98 23.51 16.29 25.70
σ 4.08 6.03 4.30 6.27 4.35 6.36
Ethene Mean 6.36 7.83 1.91 −1.57 5.46 6.22
σ 3.71 5.50 3.60 6.23 3.57 5.47
Others Alkenes Mean 0.43 −0.65 −1.06 −3.84 −0.18 −1.35
σ 2.19 4.06 2.89 6.39 2.04 3.80
Formaldehyde Mean 1.65 2.20 0.61 -0.12 0.96 0.95
σ 1.01 1.58 1.13 2.23 0.89 1.58
Others Aldehydes Mean 0.51 −0.25 0.08 −1.24 1.40 1.64
σ 1.41 2.72 1.37 2.76 1.19 1.78 Ketones Mean 3.50 5.56 3.04 4.69 3.06 4.82 σ 1.67 2.61 1.48 2.30 1.44 2.20 PAN Mean 2.32 3.87 1.47 2.17 1.48 2.40 σ 1.72 2.86 1.06 1.60 1.08 1.70 RIA Methane Mean 0.08 0.12 -0.09 -0.22 0.07 0.11 σ 0.08 0.14 0.13 0.28 0.08 0.14 Ethane Mean 6.14 7.82 2.17 −0.57 5.24 6.20 σ 2.20 3.18 2.10 3.76 2.11 3.20
Low Reactive Alkanes Mean 1.07 1.63 0.53 0.56 0.43 0.46
σ 0.66 1.01 0.41 0.60 0.37 0.57
Moderately Reactive Alkanes Mean 4.31 6.51 2.11 2.29 1.35 1.23
σ 1.38 2.07 0.95 1.41 0.82 1.32
Highly Reactive Alkanes, Aromatics Mean 11.77 17.58 14.06 22.11 15.21 24.09
σ 2.61 3.91 2.77 4.12 2.84 4.21
Ethene Mean 6.19 7.79 2.19 -0.70 5.39 6.36
σ 2.44 3.54 2.30 4.10 2.31 3.51
Others Alkenes Mean 0.39 −0.60 −1.03 −3.56 −0.29 −1.39
σ 1.67 3.10 2.18 4.91 1.72 3.10
Formaldehyde Mean 1.22 1.68 0.57 0.16 0.65 0.63
σ 0.63 0.93 0.60 1.03 0.45 0.73
Others Aldehydes Mean 0.25 −0.32 0.11 −0.75 1.10 1.39
σ 0.62 1.33 0.56 1.25 0.72 1.02
Ketones Mean 2.43 3.81 2.12 3.18 2.17 3.39
σ 1.03 1.63 0.89 1.37 0.88 1.36
PAN Mean 1.75 3.06 1.06 1.60 1.09 1.86
Table 8. Quantitative impacts of the sensitivity analysis scenarios on ozone, nitrogen oxides and volatile organic compound concentrations. The average over the whole domain and the standard deviation σ are given.
RIM RIA
SCE1+ SCE1- SCE2+ SCE2- SCE1+ SCE1- SCE2+ SCE2-O3 Mean 0.78 −0.78 −0.42 0.42 0.79 −0.80 −0.25 0.25 σ 0.68 0.69 0.39 0.38 0.62 0.63 0.20 0.20 NO Mean −2.34 2.22 0.21 −0.25 −2.50 2.15 0.24 −0.33 σ 1.69 1.58 0.47 0.25 1.28 1.23 0.26 0.26 NO2 Mean −2.07 2.10 0.11 −0.10 −1.54 1.54 0.08 −0.08 σ 1.20 1.22 0.25 0.19 0.71 0.71 0.08 0.08 VOC Mean −0.01 0.03 −2.58 2.55 −0.03 0.01 −1.62 1.61 σ 0.20 0.21 1.10 1.10 0.02 0.03 0.71 0.71
in the results obtained between R2 and ETBE based scenario are due to the level of NOxemissions. However, the
simulta-neous changes in total NOxand VOC emission levels makes
difficult to derive a reactivity effect of the emission changes on the impacts.
5 Comparison of the results at the regional and local scales
As mentioned previously, V2003 studied the effect of us-ing the same alternative gasoline fuel blends, i.e. ETBE1, ETBE2 and R2, on the air quality of an urban area. Since we are using the same methodology, the same meteorolog-ical fields and constant boundary conditions (i.e., in space and time) for the pollutant concentrations that allowed re-producing the base case, i.e. the ozone pollution episode of May 1998, with a very good agreement with measurements, it is reasonable to compare the results obtained at local scale with those obtained from the present study by focusing on the Strasbourg area. By this way, it might be possible to draw some general inferences on the effects of the use of alterna-tive fuels on the long-range transport of pollutants and on its contribution to the local and urban air quality.
However, one should notice that the emission inventories and the spatial resolution of the two studies differ. Since we are mainly interested in relative impacts than intrinsic concentrations and that the same methodology is used, the impact of using different emission inventories to build the emission scenarios should be limited. A more problematic issue, and one that deserves discussion, is the following. In air quality modeling, the emissions are averaged over each grid cell where emission sources exist and are located. The source can be linear (e.g. roads), surface (fields or urban ar-eas) or punctual (factory) but after the averaging procedure, it is considered as a surface source for which the emissions are homogeneously distributed over the grid cell. Since the at-mospheric chemistry is a highly nonlinear process, the artifi-cial dilution effect due to this averaging procedure can induce
different concentration predictions than the ones obtained for a real uniform emission situation (Mathur and Peters, 1992; Sillman et al., 1990). Here also, since we are interested in relative impacts, we assume that this dilution effect has no relevant impact on the results.
V2003 showed that the use of alternative fuels at a local scale leads to a significant reduction of VOC urban levels, but only a modest reduction of ozone levels. For the NOx, it has
not been possible to define clear trends. However, the results reveal a limited reduction of NO2levels and a slight increase
of NO. Table 9 compares the relative impacts obtained in this study to the ones obtained by V2003. All the statistics are referring to the Strasbourg area. The results show that when alternative fuels are used in the whole region and con-sequently affect the composition of urban in-going plumes, the decreases of ozone levels, i.e., both peak (HMC) and background (DAC) concentrations, are enhanced. The re-gional contribution to the Strasbourg area mainly constitutes in low-ozone concentration air-parcels. Its effect at the local scale is to decrease the peak of ozone by 2.6 (for ETBE2) to 6.1 times (for ETBE1) and the background concentration by 5.1 (for ETBE2) to 13.7 times (for ETBE1). Anyway, this significant decrease is also related to the dramatic increase of NO. Since the ozone chemistry is controlled in this area by the depletion by NO oxidation, the credit of the important reduction of ozone levels should be given to the reaction with NO. The most interesting point of this comparison is the be-havior of the VOC impact factors. The RIA and RIM are both reduced when the urban boundary conditions reflect the use of alternative fuels. However, the values obtained in this study are very small indicating that the urban levels of VOCs are only slightly affected by their regional contribution. In comparison with V2003 where the reductions of VOCs were directly related to the reduction of their emission factors, we notice that the road traffic emissions control the background regional VOC concentration levels, but have no significant impact on urban plumes.
Table 9. Comparison between this study and V2003 of the RIM and RIA averaged over the great Strasbourg area when 100% of the fuel-GPC fleet is using the fuel blends ETBE1, ETBE2 and R2.
Fuel blends ETBE1 ETBE2 R2
V2003 This study V2003 This study V2003 This study RIM O3 0.80 4.87 1.29 3.30 0.75 2.75 NO −0.65 −11.58 −2.73 −9.44 −0.53 −6.66 NO2 0.57 −6.87 −0.84 −5.78 0.58 −3.61 VOC 4.98 0.36 7.21 −3.51 4.38 −0.16 RIA O3 0.45 6.17 0.91 4.64 0.42 3.57 NO −0.78 −12.79 −2.76 −10.27 −0.64 −7.14 NO2 0.23 −5.62 −1.15 −4.67 0.25 −2.92 VOC 3.09 1.1 4.53 -2.10 2.73 0.63 6 Concluding remarks
The effect of using oxygenated and reformulated fuel blends on the regional air quality has been studied by developing emission scenarios and through air quality modeling. Three fuel blends i.e., a reformulated fuel (R2), an oxygenated fuel blend (ETBE1) and a reformulated and oxygenated fuel blend (ETBE2), are used to formulate nine emission scenar-ios.
The results show a great improvement in the VOC levels and in particular on moderately and highly reactive alkanes, aromatics, ketones and PAN for all the fuels. These effects result directly from the modification of the fuel composition and the reduction of highly reactive compounds. Some VOC trends such as the ones of alkenes and aldehydes show a de-pendence on the type of fuels used. For those, it seems that the oxygenated fuel blend (ETBE1) is the most appropriate fuel to be used to reduce their levels. Using both reformula-tion and oxygenareformula-tion (ETBE2) gives poorer results than us-ing only reformulation (R2).
This study allowed us to show a significant increase of NOxlevels at the regional scale whereas, at the local scale,
the trend for NO is a moderate increase of concentrations and the positive impacts on NO2 in the urban centre were
balanced by the negative impacts in the surrounding areas. Even if all the fuels give similar results averaged over the region with low increases, i.e., between 1 and 5% of both the concentration peaks and daily averaged concentrations, these increases are far more important in urban areas and ur-ban plumes (even more than 20%).
The simulated ozone levels in all the scenarios are slightly lowered with a decrease averaged over the whole domain of 1 to 2% for both the ozone HMC and DAC. More impor-tant reductions can be noticed in urban areas (greater than 15%) where V2003 report only a slight decrease of ozone. The sensitivity analysis revealed that the impact of
alterna-tive fuels on lowering the ozone levels is not only related to the reduction of the emissions, but also to the modification of the reactivity of the VOCs.
In addition, by analysis the ozone chemistry using VOC-oxidation and NOx-oxidation pathways, we found different
driving pathways according to the spatial distribution of the emissions. In urban areas, the ozone formation is primarily controlled by the NOx-oxidation pathway. In these highly
NOx concentration areas, the increase of NOx emissions
from road traffic have a direct impact on the ozone levels and result in reduced concentration levels. In urban plume over rural areas, the reduction of less reactive VOCs result in less NO oxidized via the HO. radical chain reactions. Thus, even if the NO levels are lower than in urban areas, the ozone can react with NO to give NO2. Finally, the VOC-oxidation
pathway is controlling the air quality over rural areas and road traffic emission changes have only a small impact on ozone concentration levels.
By comparing with V2003 over the Strasbourg area, it is possible to estimate the effect of the contribution of the re-gional range transport to the urban air quality of Strasbourg and, in particular, how the use of alternative fuels at regional scale affects the local scale of Strasbourg. The results show that the urban ozone levels are greatly decreased by using al-ternative fuels at regional scales whereas important increases in NOxlevels are reported. We found that the regional
con-tribution to VOC urban levels was counteracting the direct effect of the reduction of VOC emissions at local scale. The use of alternative fuels leads to no improvements on the ur-ban VOC levels or even some concentration increases in the surrounding of the city center. Using such fuels at regional scale in addition to measures taken at the urban scale allow a great improvement of the urban air quality in terms of ozone pollution. However, the urban levels of VOCs are not af-fected and the NOxlevels are increased.
Acknowledgements. J.-F. Vinuesa was supported by the ADEME
and the CNRS through the program AGRIculture pour le Chimie et l’Energie (ECODEV/AGRICE-CNRS). The authors are grateful to the ASPA, which kindly provided the data from its measurement network.
Edited by: W. T. Sturges
References
Adrian, G. and Fiedler, F.: Simulation of unstationary wind and temperature fields over complex terrain and comparison with ob-servations, Beitr. Phys. Atmosph., 64, 27–48, 1991.
Atkinson, R.: Gas-phase tropospheric chemistry of organic com-pounds, Journal of physical and chemical reference data, Mono-graph No. 2, 1–216, 1994.
Chock, D. P., Winkler, S. L., Chang, T. Y., Rudy, S. J., and Shen, Z. K.: Urban ozone air quality impact of emissions from vehicles using reformulated gasolines and M85, Atmos. Env., 28, 2777– 2787, 1994.
Derwent, R. G., Jenkin, M. E., Saunders, S. M., and Pilling, M. J.: Photochemical ozone creation potentials for organic compounds in northwest Europe calculated with a master chemical mecha-nism, Atmos. Env., 32, 2429–2441, 1998.
Derwent, R. G., Jenkin, M. E., Saunders, S. M., Pilling, M. J., Sim-monds, P. G., Passant, N. R., Dollard, G. J., Dumitrean, P., and Kent, A.: Photochemical ozone formation in north west Europe and its control, Atmos. Env., 37, 1983–1991, 2003.
Gaffney, J. S. and Marley, N. A.: Alternative Fuels, in: Air Pollution Reviews: Volume 1. The Urban Air Atmosphere and Its Effects, edite by: Brimblecombe, P. and Maynard, R., Imperial College Press, London, UK, Chapter 6, pp. 195–246, 2000.
He, B.-Q., Wang, J.-X., Hao, J.-M., Yan, X.-G., and Xiao, J.-H.: A study on emission characteristics of an EFI engine with ethanol blended gasoline fuels, Atmos. Env., 37, 949–957, 2003. Hsieh, W.-D., Chen, R.-H., Wu, T.-L., and Lin, T.-H.: Engine
per-formance and pollutant emission of an SI engine using ethanol-gasoline blended fuels, Atmos. Env., 36, 403–410, 2002. INTERREG II: Analyse transfrontali`ere de la qualit´e de l’air dans
le Rhin sup´erieur - Grenz¨ubergreifende Luftqualit¨atsanalyse am Oberrhein”, Communaut´e de travail – Arbeitgemeinschaft ASPA (Association pour la Surveillance et l’´etude de la pollution atmo-sph´erique en Alsace) UMEG (Gesellschaft f¨ur Umweltmessun-gen und UmwelterhebunUmweltmessun-gen mbH), Official document, edited by: Holler, H. W. und Verlag GmbH, Killisfeldstrasse 45, D-76227 Karlsruhe (Germany), 2000.
Kirchner, F., Thuener, L. P., Barnes, L., Becker, K. H., Donner, B., and Zabel, F.: Thermal lifetimes of peroxynitrates occuring in the atmospheric degradation of oxygenated fuels additives, Env. Sci. Tech., 31, 1801–1804, 1997.
Kivi, J., Niemi, A., Nylund, N., Kuto, M., and Orre, K.: Use of MTBE and ETBE as gasoline reformulation components, SAE Technical Paper 922379, 1992.
Kumini, H., Ishizawa, S., and Yoshikawa, Y.: Three-dimensional air quality simulation study on low-emission vehicles in the southern California, Atmos. Env., 31, 145–158, 1997.
Lopez de Rodas, B., and Marduel, J.-L.: Influence sur la nature et le niveau des ´emissions `a l’´echappement, d’une
incorpora-tion de compos´es oxyg´en´es dans les essences, PV no. 97/00581, U.T.A.C., BP212, 91311 Montlhery, France, 1997.
Marthur, R. and Peters, L. K.: Sub-grid representation of emission source clusters in regional air quality modeling, Atmos. Env., 26, 3219–3238, 1992.
McDonald, C., Shore, P., Lee, G., Otter, G. D., and Humphries, D.: The effect of gasoline composition on stochiometry and exhaust emissions, SAE Technical Paper 941868, 1994.
Moussiopoulos, N.: The EUMAC zooming model, a tool for local-to-regional air quality studies, Meteorolog. Atmos. Phys., 57, 115–133, 1995.
Noorman, M.: The effect of MTBE, DIPE and TAME on vehicle emissions, SAE Technical Paper 932668, 1993.
Ponche, J.-L., Schneider, C., and Mirabel, Ph.: Methodology and results of the REKLIP atmospheric emission inventory of the up-per Rhine valley transborder region, Wat. Air Soil Pollut., 124, 61–93, 2000.
Ponche, J.-L. and Vinuesa, J.-F.: Emission scenarios for air quality management and applications at local and regional scales includ-ing the effects of the future European emission regulation (2015) for the upper Rhine valley, Atmos. Chem. Phys., 5, 999–1014, 2005, mboxhttp://www.atmos-chem-phys.net/5/999/2005/. REKLIP: Atlas climatique du foss´e Rh´enan m´eridional, 1 volume
texte et 2 volumes cartes, Ed. COPRUR, F-67000 Strasbourg, 1995, ISBN 2-903297-097-5, 1995.
REKLIP: Qualit´e de l’Air et Climat R´egional/LuftQualit¨at und Re-gionalklima, Rapport final, volume 3/Schlussbericht Band 3, Ed. COPRUR F-67000 Strasbourg, 1999, ISBN 2-84208-035-1, 1999.
Reuter, R., Benson, J., Burns, V., Gorse, R., Hochhausser, A., Koelh, W., Painter, L., Rippon, B., and Rutherford, J.: Effects of oxygenated fuels and RVP on automotive emission auto-oil improvement program, SAE Technical Paper 920326, 1992. Schneider, Ch., Kessler, Ch., and Moussiopoulos, N.: Influence
of emission input data on ozone level predictions for the Upper Rhine valley, Atmos. Environ., 31, 3187–3205, 1997.
Sillman, S., Logan, J. A., and Wofsy, S. C.: The sensitivity of ozone to nitrogen oxides and hydrocarbons in regional ozone episodes, J. Geophys. Res., 95, 1837–1851, 1990.
Smith, D. F., Kleindienst, T. E., Hudgens, E. E., and McIver, C. D.: Kinetics and mechanism of the atmospheric oxidation of ethyl tertiary butyl ether, Int. J. Chem. Kin., 24, 199–215, 1992. Stockwell, W., Kirchner, F., and Kuhn, M.: A new mechanism
for regional atmospheric chemistry modelling, J. Geophys. Res., 102, 3789–3812, 1997.
Vinuesa, J.-F.: Mod´elisation de la qualit´e de l’air: Impact `a l’´echelle locale et r´egionale de l’utilisation de carburants automobiles modifi´es, PhD thesis, L. Pasteur University of Strasbourg I, 2000. Vinuesa, J.-F., Hyacinthe, C., Fayet, S., Perron, G., Kleinpeter, J., Target, A., Mirabel, Ph., and Ponche, J.-L.: Upper Rhine valley air quality modeling for the 9–15th May 1998 episode and fu-ture abatement strategies, in: EUROTRAC-2 Symposium 2000, Springler-Verlag, Berlin Heidelberg, 2001.
Vinuesa, J.-F., Mirabel, Ph., and Ponche J.-L.: Air quality effects of using reformulated and oxygenated gasoline fuel blends: Ap-plication to the Strasbourg area (F), Atmos. Environ., 37, 1757– 1774, 2003.