HAL Id: hal-00330350
https://hal.archives-ouvertes.fr/hal-00330350
Submitted on 14 Oct 2008
HAL is a multi-disciplinary open access
archive for the deposit and dissemination of
sci-entific research documents, whether they are
pub-lished or not. The documents may come from
teaching and research institutions in France or
abroad, or from public or private research centers.
L’archive ouverte pluridisciplinaire HAL, est
destinée au dépôt et à la diffusion de documents
scientifiques de niveau recherche, publiés ou non,
émanant des établissements d’enseignement et de
recherche français ou étrangers, des laboratoires
publics ou privés.
South-East Pacific Ocean (BIOSOPE cruise) using
epifluorescence microscopy
S. Masquelier, Daniel Vaulot
To cite this version:
S. Masquelier, Daniel Vaulot. Distribution of micro-organisms along a transect in the South-East
Pacific Ocean (BIOSOPE cruise) using epifluorescence microscopy. Biogeosciences, European
Geo-sciences Union, 2008, 5 (2), pp.311-321. �hal-00330350�
www.biogeosciences.net/5/311/2008/
© Author(s) 2008. This work is distributed under the Creative Commons Attribution 3.0 License.
Biogeosciences
Distribution of micro-organisms along a transect in the South-East
Pacific Ocean (BIOSOPE cruise) using epifluorescence microscopy
S. Masquelier and D. VaulotStation Biologique de Roscoff, UMR 7144, CNRS et Universit´e Pierre et Marie Curie, Place G. Tessier, 29682, Roscoff, France
Received: 6 July 2007 – Published in Biogeosciences Discuss.: 7 August 2007 Revised: 18 January 2008 – Accepted: 1 February 2008 – Published: 4 March 2008
Abstract. The distribution of selected groups of micro-organisms was analyzed along a South-East Pacific Ocean transect sampled during the BIOSOPE cruise in 2004. The transect could be divided into four regions of contrasted trophic status: a High Nutrient Low Chlorophyll (HNLC) region (mesotrophic) near the equator, the South-East Pacific Ocean gyre (hyper-oligotrophic), a transition region between the gyre and the coast of South America (moderately olig-otrophic), and the Chile upwelling (eutrophic). The abun-dance of phycoerythrin containing picocyanobacteria (PE picocyanobacteria), autotrophic and heterotrophic eukary-otes (classified into different size ranges), dinoflagellates, and ciliates was determined by epifluorescence microscopy after DAPI staining. Despite some apparent loss of cells due to sample storage, distribution patterns were broadly similar to those obtained by flow cytometry for PE pico-cyanobacteria and picoeukaryotes. All populations reached a maximum in the Chile upwelling and a minimum near the centre of the gyre. The maximum abundance of PE
pic-ocyanobacteria was 70 103 cell mL−1. Abundance of
au-totrophic eukaryotes and dinoflagellates reached 24.5 103
and 20 cell mL−1, respectively. We observed a shift in the
size distribution of autotrophic eukaryotes from 2–5 µm in eutrophic and mesotrophic regions to less than 2 µm in the central region. The contribution of autotrophic eukaryotes to total eukaryotes was the lowest in the central gyre.
Maxi-mum concentration of ciliates (18 cell mL−1)also occurred
in the Chile upwelling, but, in contrast to the other groups, their abundance was very low in the HNLC zone and near the Marquesas Islands. Two key findings of this work that could not have been observed with other techniques are the high percentage of PE picocyanobacteria forming colonies in the HLNC region and the observation of numerous dinoflag-ellates with bright green autofluorescence.
Correspondence to: D. Vaulot ([email protected])
1 Introduction
Unicellular picoplanktonic prokaryotes and eukaryotes less than 2 µm in size (Sieburth et al., 1978) are found in marine
ecosystems at concentrations ranging from 102 to 105 and
102to 104cell mL−1, respectively. They play a fundamental
role (Azam et al., 1983; Sherr and Sherr, 2000), in particular, in oligotrophic waters (Hagstr¨om et al., 1988; Mara˜n´on et al., 2001) where their small size associated to the reduced diffu-sion boundary layer and large surface area per unit volume are an advantage to acquire nutrients (Raven, 1998). The photosynthetic component of picoplankton, i.e. Prochloro-coccus and SynechoProchloro-coccus cyanobacteria and picoeukaryotic algae, are important contributors to the microbial community of the euphotic zone in many marine environments (Mackey et al., 2002; P´erez et al., 2006). Heterotrophic protists play a pivotal role in mediating organic flux to higher trophic levels in pelagic ecosystems (Azam et al., 1983; Fenchel, 1982; Hagstr¨om et al., 1988). Among the heterotrophic pro-tists, ciliates and dinoflagellates are important grazers of pi-coplankton (Christaki et al., 2002).
In the Pacific Ocean, picoplankton has been analyzed both in the Equatorial region and the North gyre (e.g. Camp-bell et al., 1997; Mackey et al., 2002) but not in the South gyre. The latter is the most oligotrophic environment of the world oceans based on SeaWifs imagery which provides esti-mates of average surface chlorophyll a concentrations down
to 0.02 mg m−3(Morel et al., 2007). The BIOSOPE
(Bio-geochemistry and Optics South Pacific Experiment) cruise explored this region sailing from the Marquesas Islands to the coast of Chile. Along this transect, a gradient in trophic conditions was encountered, from hyper-oligotrophic (gyre)
to very eutrophic waters (Chile upwelling). The present
study relied on epifluorescence microscopy to assess the dis-tribution in this region of phycoerythrin containing pico-cyanobacteria (called PE picopico-cyanobacteria throughout the paper), autotrophic and heterotrophic eukaryotes (in
STB1 STB3 STB4 STB6 STB8 STB11 STB14 STB17 STB20 GYR2
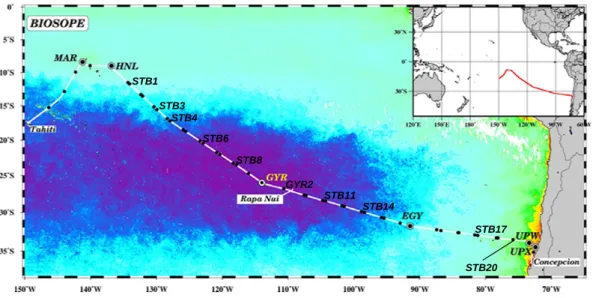
Fig. 1. Map of the BIOSOPE cruise track superimposed on a SeaWiFS ocean colour composite, dark purple indicating extremely low values
(0.018 mg m−3) of total chlorophyll a. Figure modified from Claustre et al. (2007). Stations analyzed by DAPI staining are labelled.
Table 1. Concentrations of the different populations enumerated in the present study. Values are averages for the six depths sampled at each
station.
Picocyanobacteria
containing Total Autotrophic Heterotrophic Total Autotrophic Heterotrophic Green Total phycoerythrin eukaryotes eukaryotes eukaryotes dinoflagellates dinoflagellates dinoflagellates dinoflagellates ciliates Station Latitude-Longitude mL−1 mL−1 mL−1 mL−1 mL−1 mL−1 mL−1 mL−1 mL−1 MAR1 08◦23 S–141◦14 W 3486 1520 1292 228 105 56 48 4.6 <1.5 HLN1 09◦00 S–136◦51 W 2818 2312 1836 476 93 61 32 4.2 3 STB1 11◦44 S–134◦06 W 1612 1895 1165 730 111 62 50 4.5 1.5 STB3 15◦00 S–129◦55 W 413 1423 737 686 59 28 31 4.2 3.5 STB4 17◦13 S–127◦58 W 374 1267 736 531 57 26 32 7.0 1.5 STB6 20◦26 S–122◦54 W 6 1413 726 687 37 19 17 2.2 1.5 STB8 23◦32 S–117◦52 W 37 937 521 416 31 12 19 3.5 4.5 GYR2 25◦58 S–114◦00 W 46 806 541 265 43 21 22 3.5 1.5 STB11 27◦45 S–107◦16 W 34 1050 526 525 31 10 21 6.5 <1.5 STB14 30◦02 S–98◦23 W 142 1314 854 460 55 22 33 8.5 4.2 EGY2 31◦50 S–91◦27 W 1734 3083 2481 602 82 47 35 6.5 1.9 STB17 32◦23 S–86◦47 W 1104 2607 2086 521 94 46 48 12 5.2 STB20 33◦21 S–78◦06 W 10 726 1760 1195 566 92 44 48 6.7 3 UPW1 34◦01 S–73◦21 W 40 548 3396 2526 870 122 63 59 15 10 UPX2 34◦37 S–72◦27 W 18 548 14 088 12 211 1877 151 47 104 38 6.6
enumeration techniques such as flow cytometry, epifluores-cence microscopy allows (1) to discriminate specific group of organisms such as dinoflagellates, (2) to recognize cell orga-nization such as colonies, and (3) to regroup organisms into size classes. We attempted to relate the distribution of the different types of organisms to oceanographic conditions.
2 Material and methods
2.1 Oceanographic context
The BIOSOPE cruise took place on board the French NO “l’Atalante” in the South-East Pacific Ocean from 26th Oc-tober to 11th December 2004 (Fig. 1). The transect
inves-tigated extended from the Marquesas Islands (South Pacific Tropical Waters; SPTW) to the coast of Chile, through the Eastern South Pacific Central Waters (ESPCW) which in-clude the centre of the Pacific gyre (Claustre et al., 2008). The transect can be divided into four contrasted trophic zones (from West to East): a High Nutrient Low Chlorophyll (HNLC) zone (mesotrophic) near the equator, the South-East Pacific gyre (hyper-oligotrophic) proper, the transition zone between the gyre and the coastal region (moderately olig-otrophic), and the Chile upwelling (very eutrophic). In the hyper oligotrophic zone, nitrate concentrations were nearly undetectable between the surface and 150–200 m and re-mained very low (∼2.5 µM) below this depth (Fig. 2 in Raimbault et al., 2007). Nitrate concentrations were higher in the HNLC zone and maximum in the Chile upwelling
5 µm
a
b
d
c
Fig. 2. Pictures of single (a), and colonial PE picocyanobacteria (b-d). Colony of more than 100 cells (b). Colony of 20–30 cells (c).
Chain forming cells (d). Pictures taken under green light excitation on samples of stations MAR1 at 80 m (a), MAR1 at 40 m (b), HNL1 at 60 m (c), and STB3 at 60 m (d).
(Fig. 2 in Raimbault et al., 2007). Phosphate was apparently never a limiting factor (Fig. 2 in Raimbault et al., 2007).
2.2 DAPI staining and epifluorescence microscopy
Fifteen stations (Fig. 1 and Table 1) were sampled at six depths with a conductivity-temperature-depth (CTD) rosette
a b 5 µm c
a
Fig. 3. Heterotrophic (a), autotrophic (b), and green fluorescing
dinoflagellates (c) observed under blue light excitation (top) and UV light excitation (bottom). Pictures taken at stations STB3 (20 m), UPW and STB7 (5 m), respectively.
system equipped with 12 L Niskin bottles. In general, two samples were collected in the surface layer, three around the chlorophyll maximum and one below. Water was pre-filtered through a 200 µm mesh to remove zooplankton, large phyto-plankton, and particles before further filtrations.
Water samples (100 mL) were fixed with glutaraldehyde (0.25% final concentration) and filtered through 0.8 µm pore size filters. This porosity was selected to avoid high densities of bacteria on the filter which would have rendered visuali-sation of the larger and less dense eukaryotes more difficult. Samples were stained with 4’6-diamidino-2-phenylindole
(DAPI, 5 µg mL−1 final concentration) (Porter and Feig,
1980) and stored at –20◦C for a minimum of 12 months
be-fore counting. Counts were performed with an Olympus BX51 epifluorescence microscope (Olympus Optical CO, Tokyo, Japan) equipped with a mercury light source and an x100 UVFL objective. Pictures of dinoflagellates were taken on board the ship on the freshly prepared slides using a BH2 Olympus microscope with an x40 objective and a Canon G5 digital camera. Pictures of PE containing picocyanobacte-ria were taken in the laboratory on the BX51 Olympus mi-croscope with a Spot RT-slider camera (Diagnostics Instru-ments, Sterling Heights, MI).
Prochlorococcus cannot be counted reliably by epifluores-cence microscopy because of their small size and rapidly fading fluorescence. Therefore, only isolated and colonial PE picocyanobacteria (Fig. 2) were counted based on the orange fluorescence of phycoerythrin excited under green light (530–550 nm). DAPI staining allowed us to discrimi-nate eukaryotic from prokaryotic organisms. Under UV light (360/420 nm), eukaryotic cell nucleus appeared as a separate blue organelle, while for prokaryotes, no nucleus was visible and cells appeared uniformly stained. The red fluorescence of chlorophyll under blue light (490/515 nm) allowed us to discriminate autotrophic (photosynthetic) from heterotrophic
eukaryotes. However, it was not possible to distinguish
Autotrophic eukaryotes by DAPI staining (cell mL-1) 0 2000 4000 6000 8000 A u to tr o p h ic e u k a ry o te s b y f lo w c y to m e tr y ( c e ll m L -1) 0 2000 4000 6000 8000 10000 12000 14000
Unicellular PE picocyanobacteria by DAPI staining (cell mL-1)
0 20000 40000 60000 U n ic e llu la r P E p ic o c y a n o b a c te ri a b y f lo w c y to m e tr y ( c e ll m L -1) 0 50000 100000 150000 200000 y = 3.06x R2= 0.96 a 20 000 40 000 60 000 50 000 100 000 150 000 200 000 y = 2.36x R2= 0.69 y = 1.5x R2= 0.90 b 14 000 12 000 10 000 8 000 6 000 4 000 2 000 2 000 4 000 6 000 8 000
Fig. 4. Relationship between abundance (cell mL−1) measured by
flow cytometry (Grob et al., 2007) and estimated by DAPI counting for unicellular PE picocyanobacteria (a), and autotrophic eukary-otes (b). In panel (b) circles correspond to data from surface to 40–60 m depth depending on samples. Squares correspond to data from 40–60 m depth to 300 m depth. (a) R2=0.96, n=80; (b) Solid line takes into account all data (circles and squares); R2=0.69 n=80. Dashed line takes into account only squares; R2=0.90, n=56.
chlorophyll-containing cells. Ten fields and a minimum of 100 cells were counted per slide. Eukaryotes were clas-sified according to three diameter ranges: (i) smaller than 2 µm, (ii) between 2 µm and 5 µm, (iii) larger than 5 µm. Among eukaryotes larger than 5 µm, ciliates and dinoflagel-lates were counted separately. Dinoflageldinoflagel-lates were discrim-inated by their shape, their size (between 5 µm and 100 µm), and the presence of a nucleus with condensed chromatin. Autotrophic and heterotrophic dinoflagellates were discrim-inated according to the red fluorescence of chlorophyll un-der blue light of the former (Figs. 3a and b). Among het-erotrophic dinoflagellates, some were characterized by an in-tense green fluorescence under blue light (Fig. 3c), as re-ported previously (Shapiro et al., 1989), and counted
sepa-rately. Ciliates were discriminated by their shape, their size (between 20 µm and 100 µm), and the presence of cilia and multiple nuclei. No distinction between different types of
ciliates was attempted. Because of their low abundance,
50 fields per slide were counted for dinoflagellates and cil-iates such that the minimum concentration detectable was 1.5 cell mL−1.
2.3 Data representation
Contour maps showing the distributions of the different pop-ulations were drawn using the Ocean Data View software (Schlitzer, 2003) with averaging VG gridding length-scales of 100 for both X and Y.
3 Results
3.1 Comparison between microscopy and flow cytometry
In order to validate our microscopy counts, we compared them to counts of Synechococcus cyanobacteria and photo-synthetic eukaryotes done by flow cytometry (Grob et al.,
2007) at the same stations (Fig. 4). There was a
rela-tively good correlation between the two methods, such that global distribution trends were identical. However, slopes were significantly larger than one indicating that microscopy was underestimating the actual concentrations. For PE
pic-ocyanobacteria (R2=0.96; n=80), abundance found by
mi-croscopy was 3 times lower than measured by flow cytome-try (Fig. 4a). For photosynthetic eukaryotes, the correlation
was moderate (R2=0.69; n=80) when all the data were
con-sidered, although the slope was lower than for cyanobacteria (Fig. 4b). When only data below 40-60 m were included, the
correlation was significantly better (R2=0.90; n=56) and the
slope less pronounced.
3.2 PE picocyanobacteria
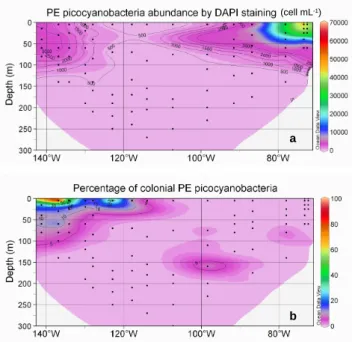
In surface, abundance of PE picocyanobacteria (Fig. 5a)
reached a maximum (70 103cell mL−1) near the coast
of Chile (station UPW1) and a minimum (less than
500 cell mL−1)in the middle of the South-East Pacific gyre.
Their abundance increased again near the Marquesas
Is-lands. In the vertical dimension, abundance decreased
slightly down to circa 100 m and cells quickly disappeared below (Fig. 5a). Interestingly, a large fraction of the PE picocyanobacteria belonged to colonial forms in the vicinity of the Marquesas Islands and in the HNLC zone (Fig. 5b). In this region, this fraction could reach up to 50% near the surface and 5 to 10% between 25 and 100 m, while it dropped below 5% almost everywhere else. Three types of colony could be observed (Fig. 2): (i) groups of 20–30 cells, (ii) groups of more than 100 cells, (iii) short chains. None of these forms seemed to be preferentially observed in any given region.
b a
(cell mL-1)
Fig. 5. Abundance obtained by DAPI counting for unicellular PE
picocyanobacteria (cell mL−1)(a), and percentage of unicellular
PE picocyanobacteria in colony (b). Black dots correspond to sam-ples analysed. Contour plots generated with the software Ocean Data View.
3.3 Eukaryotes
Maximum abundance of total eukaryotes (26 103cell mL−1)
occurred in the Chile upwelling near the surface (station
UPX2, 25 m) and minimum (276 cell mL−1)in the gyre at
depth (station GYR2, 270 m) (Fig. 6a). In the surface layer, abundance was minimal in the center of the gyre and in-creased both eastward and westward. The maxima of to-tal eukaryotes coincided roughly with the depth of chloro-phyll maximum (DCM, see Fig. 3 in Raimbault et al., 2007). Below 200 m, concentrations were always lower than
1000 cell mL−1. The distributions of total eukaryotes and
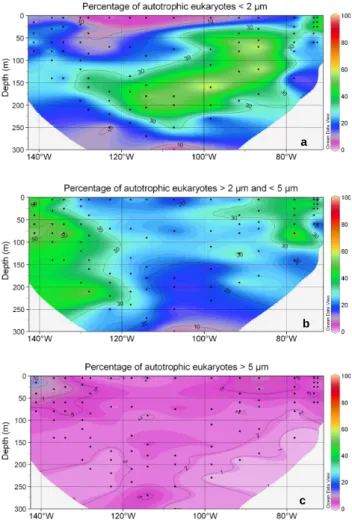
autotrophic eukaryotes were very similar with a maximum in the Chile upwelling and a minimum in the surface of the gyre (Fig. 6b). These similar distributions were a mere con-sequence of the fact that autotrophic eukaryotes were much more abundant than heterotrophic ones around the DCM (Fig. 6c). The size distribution of autotrophic eukaryotes varied dramatically throughout the transect (Figs. 7 and 8): in the surface of the gyre, cells smaller than 2 µm accounted for less than 10% while, they dominated (50–70%) in the DCM of the gyre as well as east of the gyre (Fig. 7a). In the Chile upwelling (station UPX2, 25 m), they accounted for up to 80% of the total eukaryotes. In contrast, their con-tribution was much lower in the HNLC region where larger eukaryotes between 2 µm and 5 µm accounted for 40% to 60% of the population (Fig. 7b). This size class was also dominant near the surface in the transition zone between the
(cell mL-1)
(cell mL-1)
a
b
c
Fig. 6. Abundance obtained by DAPI counting of total eukaryotes
(cell mL−1)(a), autotrophic eukaryotes (cell mL−1)(b), and
per-centage of heterotrophic eukaryotes in comparison with total eu-karyotes (c). Legend as in Fig. 5.
gyre and the upwelling. Cells larger than 5 µm accounted for less than 10% of autotrophic eukaryotes everywhere along the transect, except near the Marquesas Islands where they contributed slightly more (Fig. 7c).
The relative proportion of heterotrophic eukaryotes was the highest in the 0–50 m layer of the gyre (75–80%), while in the DCM it dropped to 25% (Fig. 6c). In the DCM, cells smaller than 2 µm accounted for 28% (east of the gyre) to 40% (in the gyre) of heterotrophic eukaryotes (Fig. 8). The contribution of cells between 2 µm and 5 µm did not vary much (about 50%) while cells larger than 5 µm accounted for up to 14% of total heterotrophic eukaryotes in the HNLC region and for about 10% elsewhere.
In the 0–100 m layer, dinoflagellate abundance (Fig. 9a) increased towards the HNLC region (maximum observed:
200 cell mL−1 at station STB1, 25 m) and the Chile
up-welling, and decreased towards the gyre (minimum
ob-served: 10 cell mL−1 at station GYR2, 270 m). In
a
b
c
Fig. 7. Fraction of autotrophic eukaryotes smaller than 2 µm (a),
between 2 µm and 5 µm (b), and larger than 5 µm (c) in comparison with the total eukaryotes. Legend as in Fig. 5.
Marquesas Islands (up to 80% of total dinoflagellates, at sta-tion STB1, 80 m depth) and in the Chile upwelling (70% at station UPW1, 15 m depth) (Fig. 9b). The maximum of per-centage of autotrophic dinoflagellates (50%–80%) followed the DCM except at station STB8 where the highest percent-age (50%) occurred at 70 m whereas the DCM was found much below at 170 m (Compare Fig. 9b in the present study and Fig. 3 in Raimbault et al., 2007). In the Chile upwelling, the maximum of autotrophic dinoflagellates (50% at station UPX2 in surface and 70% at station UPW1 at 15 m) occurred above the DCM. The percentage of autotrophic dinoflagel-lates was the lowest (5%–25%) in the surface of the gyre and below 250 m.
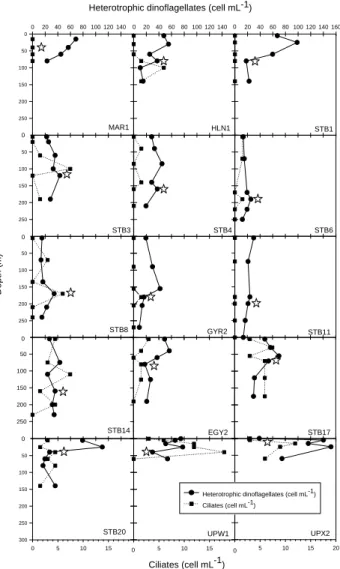
Heterotrophic dinoflagellates contribution ranged from 20% to 95% of the total (Fig. 9c) and consisted mostly (75% on average) of cells smaller than 15 µm in size (data not shown). Vertical profiles showed that maximum abundances of heterotrophic dinoflagellates followed the DCM only at some stations in the gyre (STB3, STB6 and STB8, Fig. 10).
0% 20% 40% 60% 80% 100% Aut o Het ero Auto Het ero Auto Het ero Auto Het ero
HNLC Gyre East of gyre Upwelling
HNLC: MAR1, HLN1, STB1, STB3, STB4 Gyre: STB6, STB8, GYR2, STB11 East of gyre: STB14, EGY2, STB17, STB20 Upwelling: UPW1, UPX2
> 5 µm > 2 µm and < 5 µm < 2 µm C o n tr ib u ti o n t o t o ta l a u to tr o p h ic /h e te ro tr o p h ic e u k a ry o te s
Fig. 8. Contribution of the different size classes to the abundance
of autotrophic (Auto) and heterotrophic (Hetero) eukaryotes at the depth of chlorophyll maximum for the HNLC, Gyre, East of gyre and Chile upwelling regions.
At other stations, the maximum abundance of heterotrophic dinoflagellates was observed above the DCM, except in the upwelling (station UPX2) where the maximum was found below. At station EGY2 (east of gyre), the lowest concentra-tion of heterotrophic dinoflagellates (18 cell mL−1)occurred
in the DCM.
Green fluorescing dinoflagellates (Fig. 3c) accounted for up to 50% of the heterotrophic dinoflagellates in surface east of the gyre and at depth in the Chile upwelling. They ac-counted for 5 to 25% of heterotrophic dinoflagellates in the HNLC zone and in surface in the Chile upwelling (Fig. 9d).
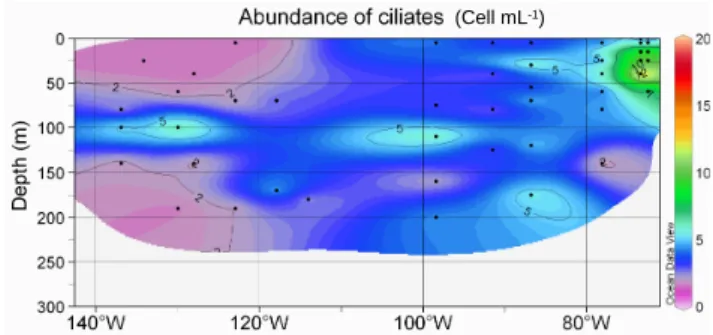
Ciliate abundance reached a maximum (18 cell mL−1)in
the Chile upwelling (station UPW1, 40 m depth) and a min-imum in the HNLC region (Fig. 11). Abundance increased towards the Chile upwelling and decreased towards the gyre as for most other groups. However, in contrast to most other groups, ciliates also remained quite low towards the HNLC zone and the Marquesas Islands. Vertically, at many sta-tions, ciliate maxima corresponded to dinoflagellate minima (Fig. 10).
4 Discussion
Differences between abundances estimated by microscopy vs. flow cytometry observed in this study could be due to sev-eral reasons. First, some cells smaller than 0.8 µm (e.g. some Synechococcus) could have passed through the 0.8 µm filter used here. The loss of eukaryotic cells is however likely to be negligible since the smallest known eukaryote Ostreococcus tauri has a size of 0.8 µm (Courties et al., 1994). Further-more, according to Sherr et al. (2005), 16 % of Synechococ-cus and only 2% of picoeukaryote cells may pass through a 1 µm filter. This may explain why the slope in the Fig. 4 is
(Cell mL-1)
a b
c d
Fig. 9. Total dinoflagellates (cell mL−1)(a), percentage of autotrophic dinoflagellates over total dinoflagellates (b), percentage of
het-erotrophic over total dinoflagellates (c), and percentage of green dinoflagellates over total hethet-erotrophic dinoflagellates (d). Legend as in Fig. 5.
larger for PE picocyanobacteria than for eukaryotes. Second, samples for microscopy were stored for more than a year
at −20◦C before counting while samples for flow
cytome-try were analyzed fresh on board. Gundersen et al. (1996) and Putland et al. (1999) found significant losses for bacteria and for unicellular cyanobacteria after one month and three
months, respectively, of sample storage at −20◦C. Third,
such storage conditions may cause a degradation of chloro-phyll and an underestimation of red fluorescing organisms (Chavez et al., 1990). Therefore, abundances of unicellular PE picocyanobacteria and autotrophic eukaryotes may be un-derestimated, while the proportion of heterotrophic eukary-otes could be higher than in the initial samples. In fact, we observed that organisms from surface samples had less in-tense chlorophyll fluorescence than those of deeper samples (as expected due to photoacclimation). Moreover, this fluo-rescence faded faster. Therefore the distinction between au-totrophic and heterotrophic organisms near the surface was not always easy. This could explain the lower correlation and higher slopes between flow cytometry and epifluorescence abundances for samples above 40–60 m (Fig. 4).
The low abundance of PE picocyanobacteria in the gyre and their higher abundance in the Chile upwelling, a region rich in nutrients and characterized by mixed waters, is in agreement with many studies (for a review see Partensky et al., 1999). Interestingly, up to 50% of the PE picocyanobac-teria counted by microscopy appeared to be colonial near the Marquesas Islands and in the HNLC region (Figs. 2 and 5b). Comparison with flow cytometry data showed that at least 33% of the PE picocyanobacteria were retained by the 0.8
µm filter, assuming that no cells were lost because of
sam-ple fixation and conservation (Fig. 4). Therefore, colonial PE picocyanobacteria would represent at least 15% (i.e. 33% of 50%) of all PE picocyanobacteria.
The high proportion of colonial PE picocyanobacteria near the Marquesas Islands and in the HNLC region could be due to a preference of colony-forming cyanobacteria for high nu-trient waters (Paerl, 2000). However, the fact that we ob-served only 1% of colonial PE picocyanobacteria in the Chile upwelling seems to indicate that other factors have to be taken into account. Some cyanobacteria encountered in ma-rine systems form colonies (Graham and Wilcox, 2000) but these are usually much larger than those we observed. It is, for example, the case for Trichodesmium that has been previously observed in the Equatorial Pacific (Capone et al., 1997). Interestingly, unicellular PE picocyanobacteria forming chains (cf. Fig. 2d) were isolated in culture from the HNLC station at 30 m and 100 m depth (Le Gall et al., 2008) but the other morphotypes observed in the field were not obtained. Since there was some evidence of nitrogen fixation activity in this area (Raimbault and Garcia, 2007), it is tempting to hypothesize that these colonial PE pico-cyanobacteria could be nitrogen-fixing. However, Raimbault and Garcia (2007) showed that important nitrogen fixation was also observed in the center of the gyre and in the Chile upwelling where very few colonies were observed. Further-more, small cyanobacteria having the capacity to fix nitrogen do not seem to form colonies (Zehr et al., 2001). Their mor-photype (spherical 3–10 µm cells) has been rarely observed in our samples (data not shown). Alternatively, colony for-mation could be an adaptation to the structure of the predator community in this region, such as the higher dinoflagellates
MAR1 0 2040 60 80 100 120 140 160 0 50 100 150 200 250 300 HLN1 0 20 4060 80 100 120 140 160 STB1 0 20 40 6080 100 120 140 160 STB3 0 50 100 150 200 250 300 STB4 STB6 STB8 0 50 100 150 200 250 300 GYR2 STB11 STB14 0 50 100 150 200 250 300 EGY2 STB17 STB20 0 50 100 150 200 250 300 0 5 10 15 20 UPW1 0 5 10 15 20 UPX2 0 5 10 15 20 D e p th ( m ) Ciliates (cell mL-1)
Heterotrophic dinoflagellates (cell mL-1) Ciliates (cell mL-1)
Heterotrophic dinoflagellates (cell mL-1)
0 0 0 0 0 0 0 0
Fig. 10. Vertical profiles of concentration (cell mL−1)of total
het-erotrophic dinoflagellates (solid line) and ciliates (dotted line). Stars indicate the depth of chlorophyll maximum.
to ciliates ratio. Indeed, cells forming colonies could take ad-vantage of the positive aspects of increased size, in particular lower grazing pressure, without paying the full cost of de-creased metabolism and reduced growth which is associated with large individual cell size (Nielsen, 2006). In the light of our observations, it could be interesting to extend counts of colonial picocyanobacteria to other oceanic regions in order to better understand how this fraction varies with oceano-graphic conditions.
The present study is consistent with estimates by Ras et al. (2007) based on HPLC pigment data and assumptions concerning the size range of different taxonomic groups (Claustre, 1994; Vidussi et al., 2001). They found that the contribution of picophytoplankton (in terms of percentage of total chlorophyll a) was the highest in the gyre itself and east of gyre, while nanophytoplankton dominated in the HNLC zone and the Chile upwelling. However, their method tends to underestimate the contribution of
picophytoplank-ton and to overestimate the contribution of macrophytoplank-ton. For example, they only took into account for the pi-coplankton size group pigments characterizing cyanobacte-ria and Chlorophyta. However, Prymnesiophyceae may also contribute significantly to picoeukaryotic population (Moon-Van Der Staay et al., 2001; Not et al., 2005). Indeed, Prym-nesiophyceae cells characterized by two chloroplasts were observed in our DAPI samples (data not shown). Conversely, Ras et al. (2007) include pigments of dinoflagellates and di-atoms in the microplankton size range (20–200 µm), while many dinoflagellates and some diatoms smaller than 20 µm (data not shown) have been detected along the South-East
Pa-cific transect, as observed previously along 110◦W (Hardy et
al., 1996). Therefore, the contribution of microphytoplank-ton could be overestimated.
During the BIOSOPE cruise, G´omez et al. (2007) found
dinoflagellate abundance always lower than 1 cell mL−1,
ex-cept at station 20 where a bloom of dinoflagellates was
ob-served (∼4 cell mL−1 between surface and 5 m depth), and
at station UPW (∼2 cell mL−1). These counts from
acid-ified lugol’s fixed samples are much lower than ours (Ta-ble 1). These differences could originate from differences in the size of the dinoflagellates that were counted in these two studies. We counted dinoflagellates which were between 5 µm and 50 µm in diameter while G´omez et al. (2007) only counted dinoflagellates larger than 15 µm. Hardy et al. (1996) showed that dinoflagellates larger than 20 µm ac-counted only for 10 to 30% of total dinoflagellates in the Pa-cific gyre. In our samples (data not shown), the contribution of dinoflagellates larger than 15 µm to total dinoflagellates in terms of abundances was below 1% near the Marquesas Islands, 1% in the upwelling zone, 2% in the HNLC zone and around the station EGY, and reached a maximum of 3% at station ST20 where a bloom was observed by G´omez et al. (2007).
Globally, the abundance of dinoflagellates (Fig. 9) de-creased towards the hyper-oligotrophic zone and inde-creased towards the mesotrophic and eutrophic zones. This is in agreement with Leterme et al. (2006) who showed that the dinoflagellate abundances increased with trophic status in the NE Atlantic Ocean. The observed increase in heterotrophic dinoflagellates contribution with depth is coherent with pre-vious observations in the Equatorial Pacific (Chavez et al.,
1990). Heterotrophic dinoflagellates were always much
more abundant than ciliates as shown previously in the Sar-gasso Sea (Lessard and Murrell, 1996) and the North-East Equatorial Pacific (Yang et al., 2004). Although it is gener-ally admitted that heterotrophic nanoflagellates are the ma-jor grazers of picoplankton (Mackey et al., 2002; Sato et al., 2007), predation by heterotrophic dinoflagellates could also be important (Sanders et al., 2000; Sherr et al., 1991).
Green fluorescing dinoflagellates were initially observed by Shapiro et al. (1989) in the North-West Atlantic, but lit-tle reported since then. Recently, Tang and Dobbs (2007) showed that green autofluorescence is a common feature
of dinoflagellates, diatoms, green algae, cyanobacteria and raphidophytes. They observed that this green autofluores-cence is stronger in fixed cells, not stable over time, and that its intensity varies with organisms (the strongest signal is observed for dinoflagellates). Shapiro et al. (1989) found that green fluorescing dinoflagellates could contribute from 4 to 100% to heterotrophic dinoflagellates while Chavez et al. (1990) found that in the Equatorial Pacific, 32% of het-erotrophic dinoflagellates on average produced bright green fluorescence. The data reported here (maximal
concentra-tions in excess of 60 cell mL−1 and maximum contribution
up to 50 %, Fig. 9) are in agreement with these previous stud-ies. The origin of this bright green fluorescence (Fig. 3c) still remains intriguing. Shapiro et al. (1989) hypothesized that it could be due to a flavoprotein. The isolation by Fujita et al. (2005) of a flavoprotein from the green-fluorescing flag-ellum of the brown alga Scytosiphon lomentaria lends sup-port to this hypothesis. Kim et al. (2004) showed that the infection of the thecate dinoflagellate Gonyaulax spinifera by Amoebophrya, a parasitic dinoflagellate, induces a bright green autofluorescence in infected cells. This fluorescence is, however, much more localised than in the green dinoflag-ellates observed in our samples (Fig. 3c). Another attractive possibility could be the presence of a cytoplasmic green flu-orescing protein (GFP, Wilson and Hastings, 1998).
Ciliate abundances reported here (Table 1) are comparable to those reported from other similar marine systems ranging from oligotrophic to eutrophic (Beers et al., 1980; Leakey et al., 1996; Lessard and Murrell, 1996; Yang et al., 2004). Focusing only on tintinnid ciliates, Dolan et al. (2007) ob-served during the BIOSOPE cruise much lower
concentra-tions ranging from 0.002 and 0.04 cell mL−1between 5 and
300 m. However, tintinnids generally account only for 5– 10% of all ciliates (Dolan and Marras´e, 1995). Comparing our data with values from Table 2 of Dolan et al. (2007) re-sults in a proportion of tintinnids (0.05%) smaller, for ex-ample, than in the Catalan Sea (Dolan and Marras´e, 1995). However, maxima and minima of tintinnid and total ciliates occurred simultaneously, in the upwelling and in the gyre, respectively.
The distribution pattern of ciliates (Fig. 11) agrees with previous observations in the North Western Indian Ocean (Leakey et al., 1996) where the lowest abundances were ob-served in oligotrophic waters and the highest in the most pro-ductive waters. The different patterns of vertical distribution of ciliates observed in the present study could be explained by the fact that no distinction has been made between the different types of ciliates (mixotrophic and heterotrophic cili-ates). In the Catalan Sea, the distribution of heterotrophic cil-iate is closely related to the DCM while mixotrophic cilcil-iates display a more complicated vertical pattern and their distri-bution may vary from system to system (Dolan and Marras´e, 1995).
Nano-ciliates (<20 µm) have been identified as potentially important grazers of picoplankton (Sherr and Sherr, 1987;
(Cell mL-1)
Fig. 11. Abundance of ciliates (cell mL−1). Legend as in Fig. 5.
Sherr et al., 1991) and account in general from 50 to 95% of total ciliates in a variety of marine ecosystems (Beers et al., 1980; Montagnes et al., 1988; Yang et al., 2004). How-ever, in our study, we observed very few nanociliates as the size of the majority of ciliates felled into a 50–100 µm range (data not shown). That could be explained by the fixation method used in our study: Leakey et al. (1994) demonstrated that the use of glutaraldehyde as fixative could lead to a loss of cells as high as 70% among aloricate ciliates rela-tive to lugol’s iodine while tintinnid numbers did not vary significantly between fixative treatments. However, Dolan and Marras´e (1995), observed only 8% of nanociliates in the Catalan Sea in June 1993 while lugol’s iodine was used as fixative.
In conclusion, although assessing the abundance of the dif-ferent microbial groups by DAPI microscopy is slow and labour-intensive and despite some cell loss following long-term sample storage, the present data set highlights some characteristics of the microbial community in the South-East Pacific Ocean that have escaped more rapid techniques such as flow cytometry. This includes in particular the importance of colonial PE containing picocyanobacteria in the HNLC area and the large contribution of green fluorescing dinoflag-ellates in some regions, such as between the gyre and the coast of South America.
Acknowledgements. D. Tailliez and C. Bournot are warmly
thanked for their efficient help in CTD rosette management and data processing. D. Marie, M. Viprey and L. Garczarek are ac-knowledged for their help during the cruise. This is a contribution to the BIOSOPE project (LEFE-CYBER program). This research was funded by the Centre National de la Recherche Scientifique (CNRS), the Institut des Sciences de l’Univers (INSU), the Centre National d’Etudes Spatiales (CNES), the European Space Agency (ESA), the National Aeronautics and Space Administration (NASA) and the Natural Sciences and Engineering Research Council of Canada (NSERC). Additional funds were provided by the ANR Biodiversity project PICOFUNPAC. S. Masquelier was supported by a doctoral fellowship (BFR05/027) from the Minist`ere de la Culture, de l’Enseignement Sup´erieur et de la Recherche of Luxembourg.
References
Azam, F., Fenchel, T., Field, J. G., Gray, J. S., Meyer-Reil, L. A., and Thingstad, F.: The ecological role of water column microbes in the sea, Mar. Ecol.-Prog. Ser., 10, 257–263, 1983.
Beers, J. R., Reid, M. H., and Stewart, G. L.: Microplankton pop-ulation structure in Southern California nearshore waters in late spring, Mar. Biol., 60, 209–226, 1980.
Campbell, L., Liu, H. B., Nolla, H. A., and Vaulot, D.: Annual vari-ability of phytoplankton and bacteria in the subtropical North Pa-cific Ocean at station Aloha during the 1991–1994 ENSO event, Deep-Sea Res. I, 44, 167–192, 1997.
Capone, D. G., Zehr, J. P., Paerl, H. W., Bergman, B., and Carpenter, E. J.: Trichodesmium, a globally significant marine cyanobac-terium, Science, 276, 1221–1229 1997.
Chavez, F. P., Buck, K. R., and Barber, R. T.: Phytoplankton taxa in relation to primary production in the Equatorial Pacific, Deep-Sea Res. II, 37, 1733–1752, 1990.
Christaki, U., Courties, C., Karayanni, H., Giannakourou, A., Mar-avelias, C., Kormas, K. A., and Lebaron, P.: Dynamic charac-teristics of Prochlorococcus and Synechococcus consumption by bacterivorous nanoflagellates, Microb. Ecol., 43, 341–352, 2002. Claustre, H.: The trophic status of various oceanic provinces as re-vealed by phytoplankton pigment signatures, Limnol. Oceanogr., 39, 1206–1210, 1994.
Claustre, H., Huot, Y., Obernosterer, I., Gentili, B., Tailliez, D., and Lewis, M.: Gross community production and metabolic bal-ance in the South Pacific Gyre, using a non intrusive bio-optical method, Biogeosciences Discuss., 4, 3089–3121, 2007, http://www.biogeosciences-discuss.net/4/3089/2007/.
Claustre, H., Sciandra, A., and Vaulot, D.: Introduction to the spe-cial section: Bio-optical and biogeochemical conditions in the South East Pacific in late 2004 – the BIOSOPE cruise, Biogeo-sciences Discuss., 5, 605–640, 2008,
http://www.biogeosciences-discuss.net/5/605/2008/.
Courties, C., Vaquer, A., Trousselier, M., Lautier, J., Chr´etiennot-Dinet, M.-J., Neveux, J., Machado, C., and Claustre, H.: Small-est eukaryotic organism, Nature, 370, 255, 1994.
Dolan, J. R. and Marras´e, C.: Planktonic ciliate distribution relative to a deep chlorophyll maximum: Catalan Sea. N.W. Mediter-ranean, June 1993, Deep-Sea Res. I, 42, 1965–1987, 1995. Dolan, J. R., Ritchie, M. E., and Ras, J.: The ”neutral”
commu-nity structure of planktonic herbivores, tintinnid ciliates of the microzooplankton, across the SE Tropical Pacific Ocean, Bio-geosciences, 4, 297–310, 2007,
http://www.biogeosciences.net/4/297/2007/.
Fenchel, T.: Ecology of heterotrophic microflagellates. II. Bioener-getics and growth, Mar. Ecol.-Prog. Ser., 8, 225–231, 1982. Fujita, S., Iseki, M., Yoshikawa, S., Makino, Y., Watanabe, M.,
Motomura, T., Kawai, H., and Murakami, A.: Identification and characterization of a fluorescent flagellar protein from the brown alga Scytosiphon lomentaria (Scytosiphonales, Phaeophyceae): a flavoprotein homologous to old yellow enzyme, Eur. J. Phy-col., 40, 159–167, 2005.
G´omez, F., Claustre, H., Raimbault, P., and Souissi, S.: Two High-Nutrient Low-Chlorophyll phytoplankton assemblages: The tropical central Pacific and the offshore Per´u-Chile current, Bio-geosciences, 4, 1101–1113, 2007,
http://www.biogeosciences.net/4/1101/2007/.
Graham, L. and Wilcox, L.: Algae, Prentice Hall, Inc. Upper Saddle
River, NJ, 630 pp., 2000.
Grob, C., Ulloa, O., Claustre, H., Huot, Y., Alarcon, G., and Marie, D.: Contribution of picoplankton to the total particulate organic carbon concentration in the Eastern South Pacific, Bio-geosciences, 4, 837–852, 2007,
http://www.biogeosciences.net/4/837/2007/.
Gundersen, K., Bratbak, G., and Heldal, M.: Factors influencing the loss of bacteria in preserved seawater samples, Mar. Ecol.-Prog. Ser., 137, 305–307, 1996.
Hagstr¨om, Azam, F., Andersson, A., Wikner, J., and Rassoulzade-gan, F.: Microbial loop in an oligotrophic pelagic marine ecosys-tem: possible roles of cyanobacteria and nanoflagellates in the organic fluxes, Mar. Ecol.-Prog. Ser., 49, 171–178, 1988. Hardy, J., Hanneman, A., Behrenfeld, M., and Horner, R.:
Environ-mental biogeography of near-surface phytoplankton in the South-east Pacific Ocean, Deep-Sea Res. I, 43, 1647–1659, 1996. Kim, S., Park, M. G., Yih, W., and Coats, D. W.: Infection of
the bloom-forming thecate dinoflagellates Alexandrium affine and Gonyaulax spinifera by two strains of Amoebophrya (Dino-phyta), J. Phycol., 40, 815–822, 2004.
Le Gall, F., Marie, D., Garczarek, L., Viprey, M., and Vaulot, D.: Picoplankton diversity in the South East Pacific from cultures, Biogeosciences, 5, 203–214, 2008,
http://www.biogeosciences.net/5/203/2008/.
Leakey, R. J. G., Burkill, P. H., and Sleigh, M. A.: A comparison of fixatives for the estimation of abundance and biovolume of marine planktonic ciliate populations, J. Plankton Res., 16, 375– 389, 1994.
Leakey, R. J. G., Burkill, P. H., and Sleigh, M. A.: Planktonic ciliates in the Northwestern Indian ocean: their abundance and biomass in waters of contrasting productivity, J. Plankton Res., 18, 1063–1071, 1996.
Lessard, E. J. and Murrell, M. C.: Distribution, abundance and size composition of heterotrophic dinoflagellates and ciliates in the Sargasso Sea near Bermuda, Deep-Sea Res. I, 43, 1045–1065, 1996.
Leterme, S. C., Seuront, L., and Edwards, M.: Differential contri-bution of diatoms and dinoflagellates to phytoplankton biomass in the NE Atlantic Ocean and the North Sea, Mar. Ecol.-Prog. Ser., 312, 57–65, 2006.
Mackey, D. J., Blanchot, J., Higgins, H. W., and Neveux, J.: Phyto-plankton abundances and community structure in the Equatorial Pacific, Deep-Sea Res. II, 49, 2561–2582, 2002.
Mara˜n´on, E., Holligan, P. M., Barciela, R., Gonz´alez, N., Mouri˜no, B., Paz´o, M. J., and Varela, M.: Patterns of phytoplankton size structure and productivity in contrasting open-ocean environ-ments, Mar. Ecol.-Prog. Ser., 216, 43–56, 2001.
Montagnes, D. J. S., Lynn, D. H., Roff, J. C., and Taylor, W. D.: The annual cycle of heterotrophic planktonic ciliates in the waters surrounding the isles of shoals, Gulf of Maine: an assessment of their trophic role, Mar. Biol., 99, 21–30, 1988.
Moon-van der Staay, S. Y., De Wachter, R., and Vaulot, D.: Oceanic 18S rDNA sequences from picoplankton reveal unsuspected eu-karyotic diversity, Nature, 409, 607–610, 2001.
Morel, A., Gentili, B., Claustre, H., Babin, M., Bricaud, A., Ras, J., and Tieche, F.: Optical properties of the ”clearest” natural waters, Limnol. Oceanogr., 52, 217–229, 2007.
Nielsen, S. L.: Size-dependent growth rates in eukaryotic and prokaryotic algae exemplified by green algae and
cyanobacte-ria: Comparisons between unicells and colonial growth forms, J. Plankton Res., 28, 489–498, 2006.
Not, F., Massana, R., Latasa, M., Marie, D., Colson, C., Eikrem, W., Pedr´os-Ali´o, C., Vaulot, D., and Simon, N.: Late summer community composition and abundance of photosynthetic pi-coeukaryotes in Norvegian and Barents Seas, Limnol. Oceanogr., 50, 1677–1686, 2005.
Paerl, H. W.: Marine plankton, The ecology of cyanobacteria: Their diversity in time and space, Kluwer Academic Publishers, Dor-drecht, The Netherlands, 121–148, 2000.
Partensky, F., Hess, W. R., and Vaulot, D.: Prochlorococcus, a ma-rine photosynthetic prokaryote of global significance, Microb. Mol. Biol. R., 63, 106–127, 1999.
P´erez, V., Fern´andez, E., Mara˜n´on, E., Mor´an, X. A. G. and Zubkovc, M. V.: Vertical distribution of phytoplankton biomass, production and growth in the Atlantic subtropical gyres, Deep-Sea Res. I, 53, 1616–1634, 2006.
Porter, K. G. and Feig, Y. S.: The use of DAPI for identifying and counting aquatic microflora, Limnol. Oceanogr., 25, 943–948, 1980.
Putland, J. and Rivkin, R.: Influence of storage mode and duration on the microscopic enumeration of Synechococcus from a cold coastal ocean environment, Aquat. Microb. Ecol., 17, 191–199, 1999.
Raimbault, P. and Garcia, N.: Carbon and nitrogen uptake in the South Pacific Ocean: Evidence for efficient dinitrogen fixation and regenerated production leading to large accumulation of dissolved organic matter in nitrogen-depleted waters, Biogeo-sciences Discuss., 4, 3531–3579, 2007,
http://www.biogeosciences-discuss.net/4/3531/2007/.
Raimbault, P., Garcia, N., and Cerutti, F.: Distribution of inorganic and organic nutrients in the South Pacific Ocean-evidence for long-term accumulation of organic matter in nitrogen-depleted waters, Biogeosciences Discuss., 4, 3041–3087, 2007,
http://www.biogeosciences-discuss.net/4/3041/2007/.
Ras, J., Uitz, J. and Claustre, H.: Spatial variability of phyto-plankton pigment distribution in the South East Pacific, Biogeo-sciences Discuss., 4, 3409–3451, 2007,
http://www.biogeosciences-discuss.net/4/3409/2007/.
Raven, J. A.: The twelfth Tansley lecture. Small is beautiful: The picophytoplankton, Funct. Ecol., 12, 503–513, 1998.
Sanders, R. W., Berninger, U. G., Lim, E. L., Kemp, P. F., and Caron, D. A.: Heterotrophic and mixotrophic nanoplankton pre-dation on picoplankton in the Sargasso Sea and on Georges Bank, Mar. Ecol.-Prog. Ser., 192, 103–118, 2000.
Sato, M., Yoshikawa, T., Takeda, S., and Furuya, K.: Application of the size-fractionation method to simultaneous estimation of clearance rates by heterotrophic flagellates and ciliates of pico-and nanophytoplankton, J. Exp. Mar. Biol. Ecol., 349, 334–343, 2007.
Schlitzer, R.: ODV software, http://www.awi-bremerhaven.de/ GEO/ODV, 2003.
Shapiro, L. P., Haugen, E. M., and Carpenter, E. J.: Occurrence and abundance of green-fluorescing dinoflagellates in surface waters of the Northwest Atlantic and Northeast Pacific Oceans, J. Phy-col., 25, 189–191, 1989.
Sherr, B. F. and Sherr, E. B.: High rates of consumption of bacteria by pelagic ciliates, Nature, 325, 710–711, 1987.
Sherr, E. B. and Sherr, B. F.: Marine microbes an overview, in: Microbial Ecology of the Oceans, edited by: Kirchman, D. L., New York, Willey-Liss, Inc., 13–46, 2000.
Sherr, E. B., Sherr, B. F., and Wheeler, P. A.: Distribution of coc-coid cyanobacteria and small eukaryotic phytoplankton in the up-welling ecosystem off the Oregon coast during 2001 and 2002, Deep-Sea Res. II, 52, 317–330, 2005.
Sherr, E. F., Sherr, B. F., and McDaniel, J.: Clearance rates of
<6 µm fluorescently labeled algae (FLA) by estuarine protozoa: Potential grazing impact of flagellates and ciliates, Mar. Ecol. Prog. Ser., 69, 81–92, 1991.
Sieburth, J. M., Smetacek, V., and Lenz, J.: Pelagic ecosystem structure: Heterotrophic compartments of the plankton and their relationship to plankton size fractions, Limnol Oceanogr, 23, 1256–1263, 1978.
Tang, Y. Z. and Dobbs, F. C.: Green autofluorescence in dinoflagel-lates, diatoms, and other microalgae and its implications for vital staining and morphological studies, Appl. Environ. Microbiol., 73, 2306–2313, 2007.
Vidussi, F., Claustre, H., Manca, B. B., Luchetta, A., and Marty, J. C.: Phytoplankton pigment distribution in relation to upper thermocline circulation in the Eastern Mediterranean Sea during winter, J. Geophys. Res., 106, 19 939–19 956, 2001.
Wilson, T. and Hastings, J. W.: Bioluminescence, Annu. Rev. Cell Dev. Bi., 14, 197–230, 1998.
Yang, E. J., Choi, J. K., and Hyun, J. H.: Distribution and structure of heterotrophic protist communities in the Northeast Equatorial Pacific Ocean, Mar. Biol., 146, 1–15, 2004.
Zehr, J. P., Waterbury, J. B., Turner, P. J., Montoya, J. P., Omoregie, E., Steward, G. F., Hansen, A., and Karl, D. M.: Unicellular cyanobacteria fix N2in the subtropical North Pacific Ocean, Na-ture, 412, 635–638, 2001.