HAL Id: hal-02058362
https://hal-amu.archives-ouvertes.fr/hal-02058362
Submitted on 5 Mar 2019
HAL is a multi-disciplinary open access
archive for the deposit and dissemination of
sci-entific research documents, whether they are
pub-lished or not. The documents may come from
teaching and research institutions in France or
abroad, or from public or private research centers.
L’archive ouverte pluridisciplinaire HAL, est
destinée au dépôt et à la diffusion de documents
scientifiques de niveau recherche, publiés ou non,
émanant des établissements d’enseignement et de
recherche français ou étrangers, des laboratoires
publics ou privés.
Distributed under a Creative Commons Attribution| 4.0 International License
Distribution and bacterial availability of dissolved
neutral sugars in the South East Pacific
Richard Sempere, M. Tedetti, Christos Panagiotopoulos, France van Wambeke
To cite this version:
Richard Sempere, M. Tedetti, Christos Panagiotopoulos, France van Wambeke. Distribution and
bacterial availability of dissolved neutral sugars in the South East Pacific. Biogeosciences, European
Geosciences Union, 2008, 5, pp.1165 - 1173. �10.5194/bg-5-1165-2008�. �hal-02058362�
www.biogeosciences.net/5/1165/2008/
© Author(s) 2008. This work is distributed under the Creative Commons Attribution 3.0 License.
Biogeosciences
Distribution and bacterial availability of dissolved neutral sugars in
the South East Pacific
R. Semp´er´e, M. Tedetti, C. Panagiotopoulos, B. Charri`ere, and F. Van Wambeke
Laboratoire de Microbiologie, G´eochimie et Ecologie Marines (LMGEM), UMR 6117, CNRS, Universit´e de la M´editerran´ee, Centre d’Oc´eanologie de Marseille, Campus de Luminy, Case 901, 13 288 Marseille Cedex 9, France
Received: 3 December 2007 – Published in Biogeosciences Discuss.: 14 February 2008 Revised: 23 April 2008 – Accepted: 18 July 2008 – Published: 25 August 2008
Abstract. The distribution and bacterial availability of
dis-solved neutral sugars were studied in the South East Pa-cific from October to December 2004 during the BIOSOPE cruise. Four contrasting stations were investigated: Mar-quesas Islands (MAR), the hyper-oligotrophic South Pacific Gyre (GYR), the eastern part of the Gyre (EGY), and the coastal waters associated to the upwelling area off Chile (UPW). Total (free and combined) dissolved neutral sugar (TDNS) concentrations were in the same order of magni-tude at MAR (387±293 nM), GYR (206±107 nM), EGY (269±175 nM), and UPW (231±73 nM), with the highest and lowest concentrations found at MAR (30 m, 890 nM) and EGY (250 m, 58 nM), respectively. Their contribution to dissolved organic carbon (TDNS-C×DOC−1%) was
gen-erally low for all sites varying from 0.4% to 6.7% indicating that South East Pacific surface waters were relatively poor in neutral sugars. Free dissolved neutral sugar (FDNS; e.g. sug-ars analyzed without hydrolysis) concentrations were very low within the detection limit of our method (5–10 nM) ac-counting for <5% of the TDNS. In general, the predominant sugars within the TDNS pool were glucose, xylose, arabi-nose, and galactose, while in the FDNS pool only glucose was present. TDNS stock to bacterial production ratios (inte-grated values from the surface to the deep chlorophyll max-imum) were high at GYR with respect to the low primary production, whereas the opposite trend was observed in the highly productive area of UPW. Intermediate situations were observed for MAR and EGY. Bioavailability of dissolved or-ganic matter (DOM) exposed to natural solar radiation was also experimentally studied and compared to dark treatments. Our results showed no or little detectable effect of sunlight on DOM bacterial assimilation in surface waters of UPW and GYR, while a significant stimulation was found in MAR and
Correspondence to: R. Semp´er´e
EGY. The overall results clearly suggest that DOM is less la-bile at GYR compared to UPW, which is consistent with the observed accumulation of dissolved organic carbon and the elevated C/N ratios reported by Raimbault et al. (2008).
1 Introduction
Sugars are among the most abundant components in seawa-ter constituting structural and storage compounds (Painseawa-ter, 1983; Parsons et al., 1984; Benner and Kaiser, 2003) of ma-rine organisms and generally account 20–40 dry wt. % of plankton, 17 dry wt. % of bacteria (Stouthamer, 1977), 2– 30% of dissolved organic matter (DOM; Pakulski and Ben-ner, 1994; BenBen-ner, 2002), and 50–70% of the high molecular weight DOM (>1 kDa; Benner et al., 1992; Aluwihare et al., 1997). Two major categories of sugars have been identified in DOM: Monosaccharides (free monomers) and polysac-charides (neutral sugars released after acid hydrolysis). Con-centrations of free sugars have been found extremely low (<50 nM) compared to the dissolved polysaccharides (200– 800 nM) (Benner, 2002 and references therein). Of the free sugars glucose appears to be quantitatively most important although arabinose and fructose have also been detected (Rich et al., 1996, 1997; Skoog et al., 1999; Kirchman et al., 2001). Only few vertical profiles of dissolved sugars in seawater have been already published (Skoog and Benner, 1997; Amon and Benner, 2003) and there is a limited number of studies dealing with the bacterial reactivity of polysaccha-rides and monosacchapolysaccha-rides (free glucose) in the water col-umn for different trophic regimes (Rich et al., 1996; Skoog et al., 1999; Kirchman et al., 2001).
The South East Pacific waters encompass a wide range of primary productivity ranging from the most oligotrophic and clearest waters of the world ocean in the central part of the South Pacific Gyre (SPG) (Claustre and Maritorena, 2003; Morel et al., 2007; Tedetti et al., 2007) to the highly eutrophic
1166 R. Semp´er´e et al.: Sugars in the South Pacific
27 Tahiti
Rapa Nui
Concepcion
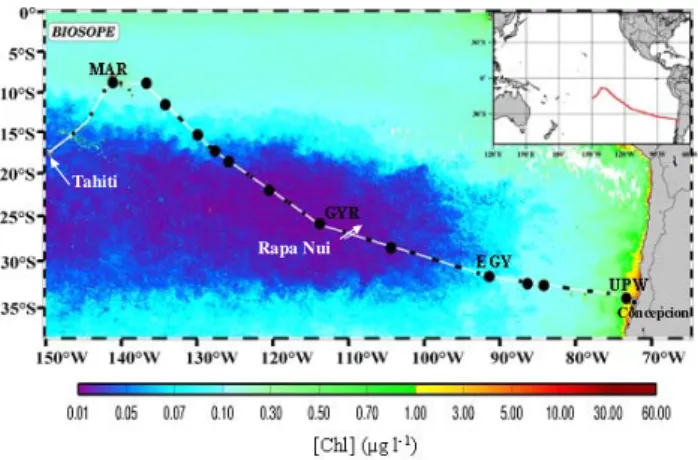
Fig. 1. Map of the BIOSOPE cruise track superimposed on a Sea-viewing Wide Field-of-view Sensor (SeaWiFS) composite for November and December showing the chlorophyll concentration in the upper layer. The long (3–6 days) stations studied for dissolved neutral sugar content, bacterial production, DOM-photodegradation and -biodegradation experiments are Marquesas Islands (MAR), center of the South Pacific Gyre (GYR), East of the South Pacific Gyre (EGY) and upwelling off Chile (UPW). Rapa Nui is Easter Island. http://www.obs-vlfr.fr/proof/vt/op/ec/biosope/bio.htm.
upwelling area off Chile (Carr, 2002). However, very little is known about DOM dynamics in the South Pacific and there is no report dealing with sugar distribution in the SPG. Such a study could help to evaluate DOM characteristics in terms of bacterial cycling and abiotic degradation (solar radiation). This paper aims to provide data on the molecular distri-bution of sugars in the DOM pool in the South East Pacific waters at four contrasting stations and to understand its pho-tochemical and bacterial reactivity.
2 Material and methods
2.1 Sampling
Sampling was performed along a 8000 km transect in the South East Pacific during the BIogeochemistry and Optics SOuth Pacific Experiment (BIOSOPE) cruise (24 October– 11 December 2004). To study the molecular distribution and bacterial availability of dissolved neutral sugars, we col-lected
1. depth profile samples (0–500 m) and
2. large volume samples (20 l) for DOM-photodegradation and -biodegradation experiments.
Four stations were sampled: Marquesas Islands (MAR), cen-ter of the SPG (GYR), East of the SPG (EGY), and the up-welling of Chile (UPW) (Fig. 1; Table 1). Biogeochemical and physical characteristics of these sampling sites are de-scribed in detail elsewhere (Claustre et al., 2008). Surface
and underwater solar irradiance measurements were also per-formed at these stations.
Discrete seawater samples were taken with 12 l Niskin bot-tles mounted on a CTD/rosette and washed with 1 M HCl and Milli-Q water before the cruise. Rubber made ribbons and o-rings of the original Niskin bottles were replaced with silicon ribbons and Viton o-rings, respectively. Samples for dissolved sugar and bacterial production (BP) measure-ment were collected at six depths (maximum depth sam-pled: 160 m in MAR, 270 m in GYR, 250 m in EGY, and 500 m in UPW) close to solar noon (bio-optical CTD cast) directly (without tubing) from the Niskin bottles into pre-combusted (450◦C, 6 h) 500-ml glass bottles, first or after gas sampling to avoid organic carbon contamination. The bottles were rinsed two times with the respective water sam-ples before filling. Following collection, seawater for dis-solved sugar analysis was filtered through 0.2-µm polycar-bonate filters (Nuclepore, 47 mm filter diameter) which were washed with a few ml of 1 M HCl, 2 l of Milli-Q water, and 150 ml of sample prior to filtration. Samples were transferred to 5 ml polypropylene tubes (prewashed with 1 M HCl and Milli-Q water) and stored in the dark at −18◦C. BP mea-surements were made on unfiltered seawater. For DOM-photodegradation and -biodegradation experiments, samples were collected at two depths (5 m and deep chlorophyll max-imum (DCM), except in MAR: 5 and 160 m) at midnight in 20 l Nalgene carboy bottles using Teflon tubing. Samples were immediately processed in a temperature controlled lab-oratory on board. Plastic gloves were worn and care was taken to minimize contamination during sampling and the following procedure. Glassware filtration material was pre-combusted before the cruise and rinsed with 1 M HCl and Milli-Q water after each sample. Sampling information is summarized in Table 1.
2.2 DOM-photodegradation and -biodegradation experi-ments
After sampling, seawater was filtered through precombusted GF/F filters (Whatman, diameter: 142 mm) using a peristaltic pump with acid-cleaned silicon tubing and then through acid-cleaned Whatman POLYCAP AS 0.2 µm (820-cm2) fil-ter capsules to exclude bacfil-teria and others microorganisms. Seawater was also filtered under a low vacuum (<50 mm Hg) through 0.8 µm polycarbonate filters (Nuclepore, diameter: 47 mm) to prepare the bacterial inoculum whilst excluding predators. The filters were washed with 150 ml of 1 M HCl (filter capsule and Nuclepore), 2 l of Milli-Q water and 150 l of sample (filter capsule, Nuclepore and GF/F) prior to filtra-tion. The 0.2 µm filtered seawater (here after called DOM-solution) was distributed into precombusted 5 l glass bottles and stored at 4◦C in the dark until morning. DOM-solutions were transferred into 100 ml quartz and Pyrex Winkler flasks and exposed on the ship deck for one day (∼8 h around so-lar noon) to natural soso-lar radiation in a recirculating water
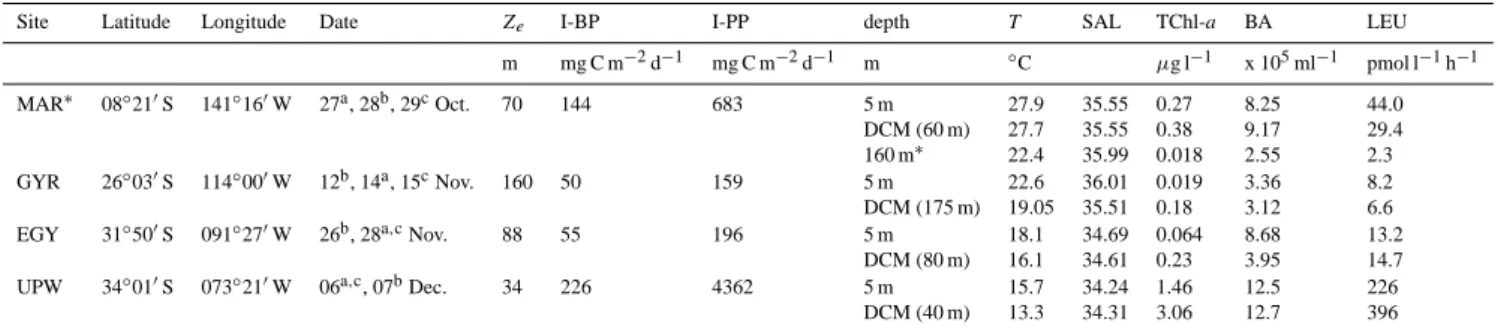
Table 1. Site location, date of sampling, deep chlorophyll maximum (DCM), depth of the euphotic zone (Ze, 1% surface PAR), bacterial and primary productions integrated down to DCM (I-BP and I-PP) after Van Wambeke et al. (2008a) at the four stations in the South East Pacific. For depths sampled for DOM-photodegradation and biodegradation experiments, temperature (T ), salinity (SAL), total
chlorophyll-a(TChl-a) concentration after Ras et al. (2008), bacterial abundance (BA) and leucine incorporation rates (LEU) are also indicated. The
maximum depths were 3623 m, 3013 m, 3393 m and 4825 m for MAR, GYR, EGY, and UPW sampling stations, respectively.
Site Latitude Longitude Date Ze I-BP I-PP depth T SAL TChl-a BA LEU
m mg C m−2d−1 mg C m−2d−1 m ◦C µg l−1 x 10⁵ml−1 pmol l−1h−1 MAR∗ 08◦210S 141◦160W 27a, 28b, 29cOct. 70 144 683 5 m 27.9 35.55 0.27 8.25 44.0 DCM (60 m) 27.7 35.55 0.38 9.17 29.4 160 m∗ 22.4 35.99 0.018 2.55 2.3 GYR 26◦030S 114◦000W 12b, 14a, 15cNov. 160 50 159 5 m 22.6 36.01 0.019 3.36 8.2 DCM (175 m) 19.05 35.51 0.18 3.12 6.6 EGY 31◦500S 091◦270W 26b, 28a,cNov. 88 55 196 5 m 18.1 34.69 0.064 8.68 13.2
DCM (80 m) 16.1 34.61 0.23 3.95 14.7 UPW 34◦010S 073◦210W 06a,c, 07bDec. 34 226 4362 5 m 15.7 34.24 1.46 12.5 226 DCM (40 m) 13.3 34.31 3.06 12.7 396 ∗
160 m, is the depth of the second DOM-photodegradation and -biodegradation experiment at MAR site
a Sampling for T , SAL, dissolved neutral sugar, BA and LEU profiles (bio-optical CTD cast, close to solar noon)
b Sampling for DOM-photodegradation and -biodegradation experiments (0:00 CTD cast). Surface solar irradiance was measured
con-tinuously during the exposure period (∼ 8 h around solar noon)
c Underwater solar irradiance measurements (close to solar noon)
bath (0.1 m depth). Surface water temperatures ranged from 16◦C (UPW) to 28◦C (MAR) (Table 1). Samples were irra-diated in duplicates for two light conditions: so-called “Full Sun” (FS: total solar radiation in quartz flasks) and “Dark” (Pyrex flasks wrapped with aluminum foil). Before and im-mediately after irradiation of DOM-solutions, aliquots were taken in FS and Dark samples for free dissolved neutral sugar (FDNS) measurements and stored in 5 ml polypropy-lene tubes (prewashed with 1 M HCl and Milli-Q water) in the dark at −18◦C. During DOM-photodegradation, the bac-terial inoculum was kept in the dark at in situ temperature. Quartz and Pyrex flasks were precombusted before the cruise and extensively washed with 1 M HCl and Milli-Q water be-tween different sets of samples during the cruise.
Bacterial response to the DOM changes after photodegra-dation was quantified through biodegraphotodegra-dation experiments. After irradiation, the DOM-solutions were mixed with the (unirradiated) bacterial inocula (1/6, inoculum/DOM-solution final ratio) and then dispensed in duplicate into sev-eral precombusted 100-ml Pyrex Winkler flasks and incu-bated in the dark at in situ temperature. No nutrients were added in the mixed solutions in order to measure the re-sponse of bacteria under “natural” conditions. Subsamples were taken and analyzed for BP at time 0, 24, 48, and 72 h of incubation. For each experiment, killed controls were made by addition of HgCl2 (final concentration: 10 mg l−1),
in-cubated with other samples and analyzed at the end of the experiment for BP.
2.3 Total dissolved neutral sugars (TDNS)
After a quick defrosting, samples (4 ml) for total (free and combined) dissolved neutral sugar (TDNS) analysis were transferred into precombusted Pyrex vials and hydrolyzed under N2 with 0.1 M HCl at 100◦C for 20 h (Burney and
Sieburth, 1977). After hydrolysis, samples were not neu-tralized (to avoid contaminations from the addition of cal-cium carbonate) but directly desalted using AG2-X8 and AG50W-X8 Bio-Rad ion exchange resins according to Mop-per et al. (1992). The reactions between resins and acidi-fied samples (pH 1) favored the elimination of carbonates (which were released into the sample by anionic exchange with chloride) into CO2, allowing a partial neutralization of
sugar samples (pH 3–4.5 after desalting). A portion of the initial sample was also directly desalted (see above) without hydrolysis in order to estimate the amount of FDNS.
The samples were injected into a WATERS-HPLC system through a manual Rheodyne valve equipped with a 200 µl sample loop. The mobile phase consisted of a mixture 95/5 (v/v) of low-carbonate NaOH (20 mM, Baker) and Milli-Q water which was pumped at a flow rate of 0.7 ml min−1on
isocratic mode. Neutral sugars were separated on a Dionex Carbopac PA-1 anion exchange column (4×250 mm) with 19 mM NaOH at 17◦C (column temperature) and were de-tected by a Decade electrochemical detector (Antec Ley-den BV) using a gold working electrode and a Pd refer-ence electrode (Panagiotopoulos et al., 2001; Panagiotopou-los and Semp´er´e, 2005). A 1 M NaOH solution was added to the eluent stream by a post-column pump at a flow rate of 0.2 ml min−1 to increase detector sensitivity. To avoid
1168 R. Semp´er´e et al.: Sugars in the South Pacific
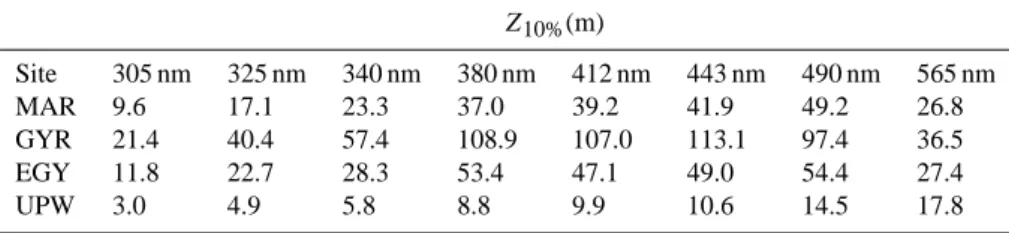
Table 2. 10% irradiance depths (Z10%) in the UVB (305 nm), UVA (325, 340, 380 nm) and visible (412, 443, 490, 565 nm) spectral domains
at the four stations in the South East Pacific.
Z10%(m) Site 305 nm 325 nm 340 nm 380 nm 412 nm 443 nm 490 nm 565 nm MAR 9.6 17.1 23.3 37.0 39.2 41.9 49.2 26.8 GYR 21.4 40.4 57.4 108.9 107.0 113.1 97.4 36.5 EGY 11.8 22.7 28.3 53.4 47.1 49.0 54.4 27.4 UPW 3.0 4.9 5.8 8.8 9.9 10.6 14.5 17.8
absorption of carbonates by NaOH, eluent solutions were degassed before use and constantly purged with helium at a flow rate of 4 ml min−1.
Recoveries of desalting, estimated in spiked (20–100 nM) sodium chloride solutions ranged from 72 to 80% for fucose, rhamnose, arabinose, mannose, xylose and ribose, and be-tween 85–100% for galactose and glucose, respectively. Pro-cedural blanks run with desalted sodium chloride solutions, showed only small peak of glucose (∼5nM), even though a systematic peak induced by desalting was coeluted with fruc-tose avoiding its quantification. The detection limit was 5– 10 nM for all sugars. Analytical errors determined from du-plicate analysis were <8% for all sugars except ribose (15%). Concentrations of dissolved sugars presented in this study are corrected for the blank values (glucose).
2.4 Bacterial production (BP)
BP was estimated from the incorporation rate of3H-leucine into proteins using the centrifugation method (Smith and Azam, 1992). The detailed protocol is fully described in Van Wambeke et al. (2008a). Briefly, 1.5 ml duplicate sam-ples were incubated in the dark for 1–2 h with 20 nM addi-tion of leucine. The experimental error was calculated as half the difference between two duplicates and averaged 6% of BP rates. The leucine-carbon conversion factor used was 1.5 kg C per mole leucine incorporated.
2.5 Surface and underwater solar irradiance
Two profiles of downward irradiance were made at each sta-tion (Fig. 1) close to solar noon using a Satlantic MicroPro free-fall profiler equipped with OCR-504 downward irradi-ance in the UVB (305 nm), UVA (325, 340 and 380 nm), and visible (412, 443, 490 and 565 nm) spectral domains. Surface irradiance was simultaneously measured at the same channels on the ship deck using other OCR-504 irradiance sensors to account for the variations of cloud conditions dur-ing the cast, as well as to monitor UV and visible irradiances during the exposure period for the DOM-photodegradation experiments. A detailed description of optical measurements and determination of 10% irradiance depth (Z10% in m) is
given elsewhere (Tedetti et al., 2007).
2.6 Statistical analyses
The Mann-Whitney test was used to evaluate the differences between biogeochemical parameters among the four sites, as well as to compare leucine incorporation rates between dark and full sun treatments in the DOMphotodegradation and -biodegradation experiments. The significance threshold was set at p<0.05.
3 Results and discussion
3.1 General observations
The main biogeochemical characteristics of the four stations are presented in Table 1. DCM ranged from 40 m (UPW) to 175 m (GYR) and was very close to the corresponding depth of euphotic zone [Zeu, the depth of 1% surface photosynthet-ically available radiation (PAR)]. Total Chlorophyll-a (TChl-a) concentrations within subsurface and DCM depths as well as BP and primary production (PP) values integrated to DCM (I-BP and I-PP) showed large variations between the stations (Table 1). At the GYR station, TChl-a, I-BP, and I-PP val-ues were low compared to the other stations, which further confirm its hyper-oligotrophic status. In this area, PP was strongly nutrient-limited because of the absence of terrestrial inputs and because of the depth of nutricline (0.01 µM N at ∼160 m; Raimbault et al., 2008). At the MAR station, TChl-a(0.27 and 0.38 µg l−1for 5 m and 60 m, respectively), and I-PP (683 mg C m−2d−1)values were higher than those pre-viously observed in this high nutrients low chlorophyll area (Signorini et al., 1999), probably due to the vertical input of dissolved iron from subsurface waters (Blain et al., 2008). From October to March, wind-driven coastal upwelling fer-tilizes the surface waters off Chile leading to one of the most productive areas in the world ocean (Carr, 2002). In the same way, Z10%in the UVB, UVA, and visible spectral domains
showed great variability with the highest values recorded in GYR (21 m at 305 nm to 113 m at 443 nm) and the lowest values measured in UPW (3 m at 305 nm to 18 m at 565 nm) (Table 2). The values reported in GYR suggest that this area likely contains the clearest oceanic waters of the world ocean (Morel et al., 2007; Tedetti et al., 2007).
3.2 Concentration levels of TDNS and FDNS
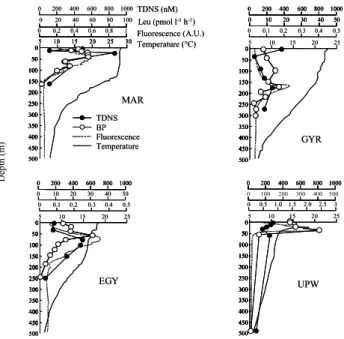
Concentrations of TDNS (free and combined) in depth pro-files ranged from 58 nM (EGY, 250 m) to 890 nM (MAR, 30 m), the second maximum value reached being observed at EGY (492 nM at 80 m). Two general trends can be observed in a first approach:
1. the depth profile patterns followed those of TChl-a for MAR and EGY, although a significant correlation be-tween TChl-a and TDNS was observed only at EGY (r=0.95, p<0.01). This probably reflects the high con-tribution from autotrophic organisms from cellular re-lease processes (Fig. 2). There were no other significant correlations (considering sites individually or all to-gether) neither with TChl-a (as source), nor with DOC (as bulk stock), nor with leucine incorporation rates (as measure of DOC uptake processes).
2. TDNS concentrations at the highly eutrophic site of UPW (149–328 nM) were not as much elevated as someone may expect for an eutrophic regime. Indeed, the maximum value in UPW was lower than that ob-served in the highly oligotrophic GYR (79–389 nM). This feature was kind of surprising because TChl-a, and I-PP values were one order of magnitude higher in UPW than in GYR (Fig. 2; Table 1).
Similar TDNS concentrations in the upper 500 m (180– 800 nM) have been already observed in Equatorial Pacific (Skoog and Benner, 1997), Northeastern Pacific and Sar-gasso Sea (Borch and Kirchman, 1997), Central Arctic (Rich et al., 1997), Ross Sea (Kirchman et al., 2001), as well as in ultrafiltrated DOM samples (20–661 nM) collected from Equatorial Pacific and Arctic Oceans (Skoog and Benner, 1997; Amon and Benner, 2003). It is worth to note that higher sugar concentrations (1000–4000 nM) above the ther-mocline were reported only for coastal samples (e.g. inshore the Oregon coast; Borch and Kirchman, 1997, Arctic estuar-ine samples; Amon and Benner, 2003). Our TDNS concen-tration results are not comparable to those obtained by colori-metric techniques [3-methyl-2-benzothiazolinone hydrazone (MBTH) or 2,4,6-tripyridyl-s-triazine (TPTZ)] because these techniques include in their analysis a much broader spectrum of sugars including methylsugars, aminosugars, uronic acids etc. These compounds were outside the analytical window of the HPAEC-PAD technique under our current analytical conditions (Borch and Kirchman, 1997; Skoog and Benner, 1997; Panagiotopoulos and Semp´er´e, 2005).
Although our sugar measurements were made only in the upper layers and we did not obtain data from the entire water column, we expect that sugar concentrations will decrease with depth. Reported literature data below the thermocline ranged from 90 to 450 nM for Northeastern Pacific, Equato-rial Pacific and Sargasso Sea (Borch and Kirchman, 1997; Skoog and Benner, 1997), and from 31–68 nM for deep Arc-tic water samples (Amon and Benner, 2003). These results
28 500 0 100 50 150 200 300 250 350 400 450 500 0 100 50 150 200 300 250 350 400 450 0 100 50 150 200 300 250 350 400 450 5 10 15 20 25 30 5 10 15 20 25 30 0 0.2 0.4 0.6 0.8 1 MAR Temperature Fluorescence 0 200 400 600 800 1000 TDNS BP Temperature (°C) Fluorescence (A.U.) TDNS (nM) Leu (pmol l-1h-1) 0 20 40 60 80 100 500 0 100 50 150 200 300 250 350 400 450 500 0 100 50 150 200 300 250 350 400 450 0 100 50 150 200 300 250 350 400 450 5 10 15 20 25 0 0.1 0.2 0.3 0.4 0.5 EGY 0 200 400 600 800 1000 0 200 400 600 800 1000 0 10 20 30 40 50 500 0 100 50 150 200 300 250 350 400 450 500 0 100 50 150 200 300 250 350 400 450 0 100 50 150 200 300 250 350 400 450 5 10 15 20 25 0 0.1 0.2 0.3 0.4 0.5 GYR 0 200 400 600 800 1000 0 200 400 600 800 1000 0 10 20 30 40 50 0 10 20 30 40 50 500 0 100 50 150 200 300 250 350 400 450 500 0 100 50 150 200 300 250 350 400 450 0 100 50 150 200 300 250 350 400 450 5 10 15 20 25 0 0.5 1.0 1.5 2.0 2.5 3 0 200 400 600 800 1000 0 200 400 600 800 1000 UPW 0 100 200 300 400 500 D ept h ( m ) Figure 2 500 0 100 50 150 200 300 250 350 400 450 0 100 50 150 200 300 250 350 400 450 500 0 100 50 150 200 300 250 350 400 450 0 100 50 150 200 300 250 350 400 450 5 10 15 20 25 30 5 10 15 20 25 30 0 0.2 0.4 0.6 0.8 1 MAR Temperature Fluorescence 0 200 400 600 800 1000 TDNS BP Temperature (°C) Fluorescence (A.U.) TDNS (nM) Leu (pmol l-1h-1) 0 20 40 60 80 100 500 0 100 50 150 200 300 250 350 400 450 0 100 50 150 200 300 250 350 400 450 500 0 100 50 150 200 300 250 350 400 450 0 100 50 150 200 300 250 350 400 450 5 10 15 20 25 0 0.1 0.2 0.3 0.4 0.5 EGY 0 200 400 600 800 1000 0 200 400 600 800 1000 0 10 20 30 40 50 500 0 100 50 150 200 300 250 350 400 450 0 100 50 150 200 300 250 350 400 450 500 0 100 50 150 200 300 250 350 400 450 0 100 50 150 200 300 250 350 400 450 5 10 15 20 25 0 0.1 0.2 0.3 0.4 0.5 GYR 0 200 400 600 800 1000 0 200 400 600 800 1000 0 10 20 30 40 50 0 10 20 30 40 50 500 0 100 50 150 200 300 250 350 400 450 0 100 50 150 200 300 250 350 400 450 500 0 100 50 150 200 300 250 350 400 450 0 100 50 150 200 300 250 350 400 450 5 10 15 20 25 0 0.5 1.0 1.5 2.0 2.5 3 0 200 400 600 800 1000 0 200 400 600 800 1000 UPW
Fig. 2. Depth profiles of total dissolved neutral sugars (TDNS in
nM), leucine incorporation rates (LEU, pmol l−1h−1), chlorophyll
fluorescence (arbitrary unit), and temperature (◦C) at the four
sta-tions in the South East Pacific.
are in good agreement with our deepest TDNS concentra-tions (110 nM at 160 m for MAR, 185 nM at 270 m for GYR, 58 nM at 250 m for EGY and 149 nM at 500 m for UPW).
FDNS concentrations were within the detection limit of the PAD (5–10 nM) in most of the sites and ranged from undetectable to 35 nM (MAR, 30 m). Our results are much lower than those found in the Equatorial Pacific (20–110 nM; Rich et al., 1996), and Central Arctic (31–68 nM; Rich et al., 1997) but similar to that reported in Gulf of Mexico (3–7 nM; Skoog et al., 1999), and Ross Sea (0–14 nM; Kirchman et al., 2001). FDNS comprised a small fraction of TDNS in all sta-tions and generally were <5% of the TDNS.
3.3 TDNS and FDNS yields
TDNS yields were calculated by dividing TDNS-C by dis-solved organic carbon (DOC) (Raimbault et al., 2008) and as such are presented as a percentage of DOC (TDNSC×DOC−1%). TDNS yields ranged from 0.4 (GYR, 40 m) to 6.7% (MAR, 30 m). At MAR higher TDNS yields were measured (3.3%±2.2%; significantly higher than the other sites, p<0.05), which probably reflects a terrestrial influence. Indeed, Signorini et al. (1999) reported the im-portance of the Marquesas Island mass effect in the stimula-tion of PP up to 1000 km downstream from the island. Our results are in good agreement with previous values reported from the Equatorial Pacific (1–7%, Rich et al., 1996; 2–6%, Skoog and Benner, 1997), Ross Sea (1–11%, Kirchman et al., 2001), and Central Arctic (2–20%, Rich et al., 1997).
1170 R. Semp´er´e et al.: Sugars in the South Pacific
29
UPW 0 10 20 30 40 50 60 70 80 Fuco se Rhamn ose Arab inose Galac tose Gluc ose Manno se Xylos e 0 m 5 m 25 m 40 m 60 m 500 m MAR 0 10 20 30 40 50 60 70 80 Fuco se Rham nose Arab inose Galac tose Gluc ose Man nose Xylose 5 m 15 m 30 m 60 m 80 m 160 m GYR 0 10 20 30 40 50 60 70 80 Fuco se Rhamn ose Arab inose Galact ose Gluc ose Man nose Xylos e 5 m 40 m 90 m 135 m 175 m 270 m EGY 0 10 20 30 40 50 60 70 80 Fuco se Rham nose Arab inose Galac tose Gluc ose Man nose Xylose 5 m 40 m 80 m 100 m 150 m 250 m R el ati ve ab un da nce (mo l % )Figure 3
UPW 0 10 20 30 40 50 60 70 80 Fuco se Rhamn ose Arab inose Galac tose Gluc ose Manno se Xylos e 0 m 5 m 25 m 40 m 60 m 500 m MAR 0 10 20 30 40 50 60 70 80 Fuco se Rham nose Arab inose Galac tose Gluc ose Man nose Xylose 5 m 15 m 30 m 60 m 80 m 160 m GYR 0 10 20 30 40 50 60 70 80 Fuco se Rhamn ose Arab inose Galact ose Gluc ose Man nose Xylos e 5 m 40 m 90 m 135 m 175 m 270 m EGY 0 10 20 30 40 50 60 70 80 Fuco se Rham nose Arab inose Galac tose Gluc ose Man nose Xylose 5 m 40 m 80 m 100 m 150 m 250 m R el ati ve ab un da nce (mo l % )Figure 3
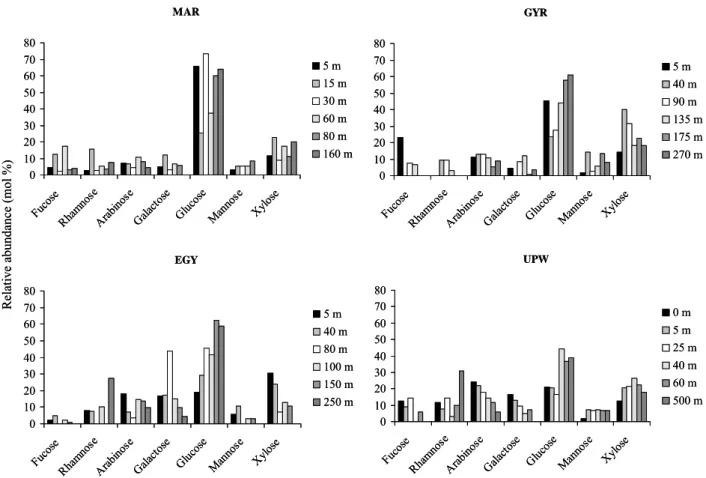
Fig. 3. Relative abundance of total dissolved neutral sugars (TDNS in mol %) at the four stations in the South East Pacific.
3.4 Molecular composition of TDNS and FDNS
Three major sugar classes were detected in South East Pa-cific samples including the aldohexoses (glucose, galactose and mannose), deoxysugars (fucose and rhamnose), and al-dopentoses (arabinose and xylose). Concentrations of ribose (aldopentose) are not reported here because they were very low and often not detected (Fig. 3). Aldohexoses were in most of the sites the most abundant compound class (30– 727 nM) followed by aldopentoses (27–131 nM), and deoxy-sugars (<10–91 nM). Glucose was very often the most abun-dant (15–77% of the TDNS) followed by xylose (7–40%), arabinose (4–24%), and galactose (3–44%). Mannose, fu-cose and rhamnose were less abundant accounting <10% of the total sugar pool. Note that xylose was predominant at 40 and 90 m at GYR and at 5 m water depth of the EGY sta-tions, whereas arabinose was predominant at UPW in the first 0–25 m (Fig. 3).
Our results indicated that glucose was clearly the most abundant sugar at greater depths (>40 m), and that its relative abundance increase with depth in GYR and in EGY (Fig. 3). The dominance of glucose within the TDNS pool was re-ported from several oceanic regions including the Equatorial Pacific (0–4000 m, 21–61%; Skoog and Benner, 1997),
Sar-gasso Sea (surface, 35%; Borch and Kirchman, 1997), Cen-tral Arctic (0–40 m, 39%; Rich et al., 1997), and Antarctic (0–60 m, 35–37%; Kirchman et al., 2001). Glucose was also the only detectable sugar within the FDNS pool with con-centrations ranging from 2 to 10 nM in most of the sites (see above). The 100% abundance of glucose in the FDNS pool for our South East Pacific samples is in agreement to that reported in Gulf of Mexico (Skoog et al., 1999), and Ross Sea (Kirchman et al., 2001). Other studies carried out in the Equatorial Pacific and central Arctic indicated that glu-cose (47–79%), fructose (15–16%), and arabinose (5–15%) were present in the FDNS pool (Rich et al., 1996; Rich et al., 1997).
3.5 Sugar stocks in relation with biological activity TDNS stocks integrated to the DCM ranged from 612 (UPW) to 2190 mg C m−2(MAR). Intermediate values were found at
GYR and EGY (2154 and 1439 mg C m−2).
Because DCMs depths were very different among sites di-rect comparison of integrated TDNS stocks is not possible. However, these results indicate that sugars are, relatively to BP, more abundant in the euphotic layer in the SPG (GYR) and on its border (EGY) than in zones of higher PP (MAR and UPW; Fig. 4). Because sugars are by-products of PP
Table 3. Doses (surface irradiances integrated over time) received by the DOM-solutions during the photodegradation experiments in the
UVB (305 nm), UVA (325, 340, 380 nm) and visible (412, 443, 490, 565 nm) spectral domains at the four stations in the South East Pacific.
Dose (kJ m−2) Site Sky 305 nm 325 nm 340 nm 380 nm 412 nm 443 nm 490 nm 565 nm MAR sunny 2.2 11.9 16.2 22.9 36.8 41.6 47.0 43.9 GYR cloudy 1.4 7.7 10.5 14.5 22.9 25.1 27.5 25.2 EGY cloudy 1.3 7.4 10.1 13.8 21.8 23.9 26.2 23.8 UPW sunny 2.5 13.5 18.4 25.9 41.3 46.6 52.7 49.0
and are essentially consumed by bacteria, our results indicate large variability across the transect between dissolved sugars production by PP and derived processes and its utilization by bacteria.
Excess-dissolved sugars relative to BP in oligotrophic to hyperoligotrophic (GYR, EGY) waters might be explained by the accumulation of recalcitrant sugars due to rapid dia-genetic processes governed by microorganisms and/or to nu-trient deficiency which results in low bacterial activity. Our results clearly showed low TDNS/BP ratios in highly pro-ductive area (UPW, MAR; Fig. 4) suggesting that TDNS are rapidly exhausted by bacterial consumption. On the other hand, in the less productive areas (GYR and EGY), TDNS are relatively abundant with respect to BP (Fig. 4), and there-fore accumulate in the surface layer. These results are con-sistent with Raimbault et al. (2008) observations indicating high concentrations of DOC as well as elevated DOM C/N ratios in the euphotic zone (GYR: 16–18; EGY: 13–18), sig-nificantly higher (p<0.01) compared to MAR (12–15). Such features might be related to a malfunctioning of the micro-bial loop with severely nutrient limited heterotrophic bacteria (Thingstad et al., 1997). Indeed, Van Wambeke et al. (2007) using enrichment experiments, reported clear BP limitation by nitrogen at GYR. Because of low horizontal advection as well as low seasonal convective mixing at GYR (Raimbault et al., 2008), BP nitrogen limitation is likely to be predomi-nant all over the year (Van Wambeke et al., 2007), leading to an accumulation of sugar-rich DOC in surface waters. 3.6 Bacterial responses to DOM photodegradation Solar doses (surface irradiances integrated over time) re-ceived by the DOM-solutions during the photodegrada-tion experiments are presented in Table 3. Doses were higher at MAR and UPW (sunny days), ranging from ∼2.2 (305 nm) to 52.7 kJ m−2 (490 nm), than at GYR and EGY
(cloudy days), ranging from ∼1.3 (305 nm) to 27.5 kJ m−2 (490 nm; Table 3). A complete assessment of solar UV doses is provided in Van Wambeke et al. (2008b). DOM-photodegradation and -biodegradation experiments indicated different effects of solar radiation on the DOM bioavailabil-ity to heterotrophic bacteria (Fig. 5). At MAR and EGY, sur-face DOM photodegradation led to a significant stimulation
30 Figure 4 I-PP (mg C m-2day-1) I-T DNS -C / I-B P (da y) EGY MAR UPW GYR 0 5 10 15 20 25 30 35 40 45 50 0 1000 2000 3000 4000 5000 I-PP (mg C m-2day-1) I-T DNS -C / I-B P (da y) EGY MAR UPW GYR 0 5 10 15 20 25 30 35 40 45 50 0 1000 2000 3000 4000 5000
Fig. 4. Relationship between I-TDNS-C/I-BP ratios [total dissolved
neutral sugars expressed in carbon units integrated down to DCM
(I-TDNS-C in mg C m−2)and bacterial production integrated down
to DCM (I-BP in mg C m−2day−1)] and primary production
inte-grated down to DCM (I-PP in mg C m−2day−1)at the four stations
in the South East Pacific.
of leucine incorporation rates by 150 and 133%, respectively (FS compared to Dark, p<0.05 for both comparisons). How-ever, the photodegradation of DOM collected deeper (180 m at MAR and 80 m at EGY) increased significantly leucine in-corporation rates only at EGY (by 80%, p<0.05; Fig. 5). Van Wambeke et al. (2007) found that heterotrophic bacteria were not bottom-up controlled at MAR, whereas they were lim-ited by labile DOC (e.g. glucose) at EGY. We did not detect any significant photochemical production of FDNS during the photodegradation experiments. Therefore, the stimula-tion of leucine incorporastimula-tion rates after the DOM irradiastimula-tion may be explained by the photochemical production of (other) bioavailable low molecular weight organic compounds such as aldehydes or organic acids that have been shown to be the major DOM-derived photoproducts (Kieber et al., 1990; Moran and Zepp, 1997; Mopper and Kieber, 2002). At GYR, surface DOM photodegradation did not significantly change leucine incorporation rates (p>0.05). This was maybe due to the very low content in chromophoric (photoreactive) DOM in surface waters of the SPG (Morel et al., 2007) that prevents any photochemical processes to occur. On the other hand, Van Wambeke et al. (2007) observed that at GYR, BP was limited by nitrogen and not labile DOC. Thus, even though some organic photoproducts might have been released from DOM irradiation, they could not in turn substantially in-crease BP. The photodegradation of DOM collected in the
1172 R. Semp´er´e et al.: Sugars in the South Pacific 31 leucine inc orp or ati on ra tes pm ol l -1h -1
*
*
*
*
leucine inc orp or ati on ra tes pm ol l -1h -1*
*
*
*
Figure 5Fig. 5. Leucine incorporation rates (pmol leu l−1h−1)after 48 h (MAR) or 72 h (GYR, EGY, UPW) incubation of irradiated DOM-solution (0.2-µm filtered seawater) with a bacterial non-irradiated inoculum (0.8-µm filtered seawater, inoculum/DOM-solution final ratio 1/6,) at the four stations in the South East Pacific. Samples were collected at two depths, i.e. 5 m and DCM, except in MAR (5 and 160 m). DOM-solutions were irradiated under natural solar ra-diation (∼8 h around solar noon) in full sun (FS, white bars) or kept in the dark (Dark, black bars). Error bars represent standard de-viations for pooled measurements of duplicate subsample for each duplicate experiment.
∗Significant differences (Mann Whitney test, p<0.05) between full
sun and dark treatments.
DCM of GYR significantly inhibited BP by 40% (p<0.05; Fig. 5). This decrease could be related to the photochemical production of biorefractory compounds (Kieber et al., 1997). DOM irradiation in UPW resulted no significant difference in BP for both surface and DCM samples (p>0.05 for both comparisons; Fig. 5). This absence of response may be at-tributed to the high amount of labile carbon initially present in the upwelling system, i.e. heterotrophic bacteria were not limited in carbon before DOM photodegradation. These dif-ferent bacterial responses to DOM photodegradation reflect differences in the nature and chemical composition of DOM before irradiation (Moran and Covert, 2003).
4 Summary and conclusion
This study showed a diversity of TDNS amounts in the South East Pacific waters. At all sites investigated, TDNS make up only 0.4 to 6.7% of DOC. Although TDNS variations were very large along vertical profiles, maximum values were reached at stations of intermediate trophic status like MAR and EGY, but not the more eutrophic (UPW). In this highly productive area of the Chile upwelling where both PP and BP were particularly elevated, high turnover of labile DOM was reflected by low TDNS/IBP ratios. There was no noticeable effect of solar radiation on DOM bacterial assimilation in such environments probably because of the high water mix-ing. In contrast, TDNS concentrations relative to bacterial production were higher in the center of the SPG (GYR) and
to a lesser extent in the eastern border of the SPG (EGY). We found that at GYR, TDNS were accumulated with respect to the low primary and heterotrophic bacterial productions, and reinforce the idea of limitation of bacterial growth by nitrogen (Van Wambeke et al., 2007). Such feature is con-sistent with the DOC accumulation (Raimbault et al., 2008) and likely considering the relatively old character of the sur-face DOM revealed by its elevated C/N ratios (Raimbault et al., 2008). The DOM which accumulates in the surface wa-ters of GYR, does not seem to be photoreactive as indicated by the photo (bio)degradation experiments. Indeed, it has been hypothesized that DOM in this area was continuously photobleached in the surface waters due to the high level of stratification and to high surface UV irradiances (Morel et al., 2007). Other stations, EGY and MAR, showed moderate TDNS concentrations and turnover regarding bacterial and primary productions.
Acknowledgements. We are grateful to the captain and crew of the
RV “L’Atalante” for excellent service during the BIOSOPE cruise. We acknowledge H. Claustre and A. Sciandra as chief scientists of the cruise, as well as C. Bournot, D. Taillez and D. Merien for CTD operations. We thank J. Raas and P. Raimbault for providing
TChl-a and DOC data, respectively. We also acknowledge T. Moutin
and S. Duhamel for providing primary production data and the two referees for improving the MS. K. Mopper gave a substantial help to our group for improving the quality of the desalination procedure. This research was funded by CNRS-PROOF projects (BIOSOPE and UVECO), and the Region of Provence Alpes Cˆote d’Azur.
Edited by: A. Boetius
References
Aluwihare, L. I., Repeta, D. J., and Chen, R. F.: A major biopoly-meric component to dissolved organic carbon in seawater, Na-ture, 387, 166–167, 1997.
Amon, R. M. W. and Benner, R.: Combined neutral sugar as indi-cators of the diagenetic state of dissolved organic matter in the Arctic Ocean, Deep-Sea Res. Pt. I, 50, 151–169, 2003.
Blain, S., Bonnet, S., and Guieu, C.: Dissolved iron distribution in the tropical and sub tropical South Eastern Pacific, Biogeo-sciences, 5, 269–280, 2008,
http://www.biogeosciences.net/5/269/2008/.
Benner, R. and Kaiser, K.: Abundance of amino sugars and peptido-glycan in marine particulate and dissolved organic matter, Lim-nol. Oceanogr., 48, 118–128, 2003.
Benner, R., Pakulski, J. D., McCarthy, M., Hedges, J. I., and Hatcher, P. G.: Bulk chemical characteristics of dissolved or-ganic matter in the ocean, Science, 255, 1562–1564, 1992. Benner, R.: Chemical composition and reactivity, in:
Biogeochem-istry of Marine Dissolved Organic Matter, edited by: Hansell, D. and Carlson, C., Academic Press, New York, USA, 59–90, 2002. Borch, N. H. and Kirchman, D. L.: Concentration and composition of dissolved combined neutral sugars (polysaccharides) in sea-water determined by HPLC-PAD, Mar. Chem., 57, 85–95, 1997.
Burney, C. M. and Sieburth, J. M.: Dissolved carbohydrates in sea-water – II: A spectrometric procedure for total carbohydrate anal-ysis and polysaccharide estimation, Mar. Chem., 5, 15–28, 1977. Carr, M. E.: Estimation of potential productivity in Eastern Bound-ary currents using remote sensing, Deep-Sea Res. Pt. II, 49, 59– 80, 2002.
Claustre, H. and Maritorena, S.: The many shades of ocean blue, Science, 302, 1514–1515, 2003.
Claustre, H., Sciandra, A., and Vaulot, D.: Introduction to the special section bio-optical and biogeochemical conditions in the South East Pacific in late 2004: the BIOSOPE program, Biogeo-sciences, 5, 679–691, 2008,
http://www.biogeosciences.net/5/679/2008/.
Kieber, R. J., Hydro, L. H, and Seaton, P. J.: Photooxydation of triglycerides and fatty acids in seawater: implication toward the formation of marine humic substances, Limnol. Oceanogr., 42, 1454–1462, 1997.
Kieber, R. J., Zhou, X., and Mopper, K.: Formation of carbonyl compounds from UV-induced photodegradation of humic sub-stances in natural waters: Fate of riverine carbon in the sea, Lim-nol. Oceanogr., 35, 1503–1515, 1990.
Kirchman, D. L., Meon, B., Ducklow, H. W., Carlson, C. A., Hansell, D. A., and Steward, G.: Glucose fluxes and concentra-tions of dissolved combined sugars (polysaccharides) in the Ross Sea and Polar Front Zone, Antarctica, Deep-Sea Res. Pt. II, 48, 4179–4197, 2001.
Mopper, K. and Kieber, D. J.: Photochemistry and the cycling of carbon, sulphur, nitrogen and phosphorus, in: Biogeochemistry of marine dissolved organic matter, edited by: Hansell, D. A. and Carlson, C. A., Academic Press, San Diego, CA, USA, 455–507, 2002.
Mopper, K., Schultz, C., Chevolot, L., Germain, C., Revuelta, R., and Dawson, R.: Determination of sugars in unconcentrated sea-water and other natural sea-waters by liquid chromatography, Envi-ron. Sci. Technol., 26, 133–137, 1992.
Moran, M. A. and Covert, J. S.: Photochemically mediated link-ages between dissolved organic matter and bacterioplankton, in: Aquatic ecosystems: interactivity of dissolved organic matter, edited by: Findlay, S. E. G. and Sinsabaugh, R. L., Academic Press, San Diego, CA, USA, 243–262, 2003.
Moran, M. A. and Zepp, R. G.: Role of photoreactions in the for-mation of biologically labile compounds from dissolved organic matter, Limnol. Oceanogr., 42, 1307–1316, 1997.
Morel, A., Gentili, B., Claustre, H., Babin, M., Bricaud, A., Ras, J., and Tieche F.: Optical properties of the “clearest” natural waters, Limnol. Oceanogr., 52, 217–229, 2007.
Painter, T. J.: Algal polysaccharides, in: Polysaccharides, edited by: Aspinall, G. O., Academic, New York, USA, 195–285, 1983. Pakulski, J. and Benner, R.: Abundance and distribution of
carbo-hydrates in the ocean, Limnol. Oceanogr., 39, 930–940, 1994. Panagiotopoulos, C. and Semp´er´e, R.: Molecular distribution of
carbohydrates in large marine particles, Mar. Chem., 95, 31–49, 2005.
Panagiotopoulos, C., Semp´er´e, R., Lafont, R., and Kerherv´e, P.: Effects of temperature in the determination of monosaccharides by using an anion-exchange column, J. Chromatogr., 920, 13–22, 2001.
Parsons, T. R., Takahashi, M., and Hargrave, B.: Biological oceano-graphic processes, Pergamon, Oxford, UK, 1984.
Raimbault, P., Garcia, N., and Cerutti, F.: Distribution of inorganic and organic nutrients in the South Pacific Ocean – evidence for long-term accumulation of organic matter in nitrogen-depleted waters, Biogeosciences, 5, 281–298, 2008,
http://www.biogeosciences.net/5/281/2008/.
Ras, J., Claustre, H., and Uitz, J.: Spatial variability of phytoplank-ton pigment distributions in the Subtropical South Pacific Ocean: comparison between in situ and predicted data, Biogeosciences, 5, 353–369, 2008,
http://www.biogeosciences.net/5/353/2008/.
Rich, J. H., Ducklow, H. W., and Kirchman, D. L.:
Concentra-tions and uptake of neutral monosaccharides along 140◦W in
the equatorial Pacific: contribution of glucose to heterothrophic bacterial activity and the DOM flux, Limnol. Oceanogr., 41, 595– 604, 1996.
Rich, J. H., Gosselin, M., Sherr, E., Sherr, B., and Kirchman, D. L.: High bacterial production, uptake and concentrations of dis-solved organic matter in the central Arctic Ocean, Deep-Sea Res. Pt. II, 44, 1645–1663, 1997.
Signorini, S. R., McClain, C. R., and Dandonneau, Y.: Mixing and phytoplankton bloom in the wake of the Marquesas Islands, Geo-phys. Res. Lett., 26, 3121–3124, 1999.
Skoog, A. and Benner, R.: Aldoses in various size fractions of ma-rine organic matter: Implications for carbon cycling, Limnol. Oceanogr., 42, 1803–1813, 1997.
Skoog, A., Biddanda, B., and Benner, R.: Bacterial utilization of dissolved glucose in the upper water column of the Gulf of Mex-ico, Limnol. Oceanogr., 44, 1625–1633, 1999.
Smith, D. C. and Azam, F.: A simple, economical method for mea-suring bacterial protein synthesis rates in sea water using 3H-Leucine, Mar. Microb. Food Webs, 6, 107–114, 1992.
Stouthamer, A. H.: Energetic aspects of the growth of micro-organisms, Symp. Soc. Gen. Microbiol., 27, 285–315, 1977. Tedetti, M., Semp´er´e, R., Vasilkov, A., Charri`ere, B., N´erini, D.,
Miller, W. L., Kawamura, K., and Raimbault, P.: High pene-tration of ultraviolet radiation in the south east Pacific waters, Geophys. Res. Lett., 34, L12610, doi:10.1029/2007GL029823, 2007.
Thingstad, T. F., Hagstrom, A., and Rassoulzadegan, F.: Accumula-tion of degradable DOC in surface waters: Is it caused by a mal-functioning microbial loop?, Limnol. Oceanogr., 42, 398–404, 1997.
Van Wambeke, F., Bonnet, S., Moutin, T., Raimbault, P., Alarc´on, G., and Guieu, C.: Factors limiting heterotrophic bacterial pro-duction in the southern Pacific Ocean, Biogeosciences, 5, 833– 845, 2008,
http://www.biogeosciences.net/5/833/2008/.
Van Wambeke, F., Obernosterer, I., Moutin, T., Duhamel, S., Ul-loa, O., and Claustre, H.: Heterotrophic bacterial production in the South East Pacific: longitudinal trends and coupling with pri-mary production, Biogeosciences, 5, 1–13, 2008a,
http://www.biogeosciences.net/5/1/2008/.
Van Wambeke, F., Tedetti, M., Duhamel, S., and Semp´er´e, R.: Diel variability of heterotrophic bacterial production and UV doses in the South East Pacific, Biogeosciences Discuss., 5, 435–462, 2008b,
![Fig. 4. Relationship between I-TDNS-C/I-BP ratios [total dissolved neutral sugars expressed in carbon units integrated down to DCM (I-TDNS-C in mg C m −2 ) and bacterial production integrated down to DCM (I-BP in mg C m −2 day −1 )] and primary production](https://thumb-eu.123doks.com/thumbv2/123doknet/13691516.432494/8.892.466.817.285.470/relationship-dissolved-expressed-integrated-bacterial-production-integrated-production.webp)
