HAL Id: hal-00318240
https://hal.archives-ouvertes.fr/hal-00318240
Submitted on 21 Dec 2006
HAL is a multi-disciplinary open access
archive for the deposit and dissemination of
sci-entific research documents, whether they are
pub-lished or not. The documents may come from
teaching and research institutions in France or
abroad, or from public or private research centers.
L’archive ouverte pluridisciplinaire HAL, est
destinée au dépôt et à la diffusion de documents
scientifiques de niveau recherche, publiés ou non,
émanant des établissements d’enseignement et de
recherche français ou étrangers, des laboratoires
publics ou privés.
orientation
P. E. Sandholt, M. Dyrland, C. J. Farrugia
To cite this version:
P. E. Sandholt, M. Dyrland, C. J. Farrugia. Dayside aurorae and polar arcs under south-east IMF
orientation. Annales Geophysicae, European Geosciences Union, 2006, 24 (12), pp.3421-3432.
�hal-00318240�
Dayside aurorae and polar arcs under south-east IMF orientation
P. E. Sandholt1, M. Dyrland2, and C. J. Farrugia3
1Department of Physics, University of Oslo, Oslo, Norway
2The University Centre in Svalbard, Longyearbyen, Norway
3Space Science Center, University of New Hampshire, Durham, USA
Received: 12 June 2006 – Revised: 26 October 2006 – Accepted: 2 November 2006 – Published: 21 December 2006
Abstract. We document a characteristic spatial and
tempo-ral structure of the aurora in the postnoon sector present dur-ing a 10-h-long interval of very steady southeast IMF
orien-tation (clock angle=135◦) ending in a sharp south-to-north
transition. Focus is placed on the detailed morphology of auroral forms/activities corresponding to merging and lobe convection cells obtained from SuperDARN convection data and Greenland magnetograms. The ground optical
instru-ments at Ny ˚Alesund, Svalbard (76◦ MLAT) recorded
dif-ferent auroral forms/activities as the station moved to higher magnetic local times (MLTs) in the 13:00–17:00 MLT sec-tor. Whereas the 13:00–15:00 MLT sector is characterized by classical poleward moving auroral forms (PMAFs) asso-ciated with merging cell transients, the aurora in the 15:00– 17:00 MLT sector shows instead a characteristic latitudi-nal bifurcation consisting of standard oval forms and polar arcs, and a corresponding composite pattern of merging and lobe convection cells. The merging and lobe cells respond to the southward and northward IMF transitions by activa-tion/fading and fading/activation, respectively. A sequence of brightening events is characterized by successive activa-tions progressing in latitude from the merging cell regime to the lobe cell regime. Emphasis is placed on the associa-tion between polar arc brightenings and the activaassocia-tion of the channel of enhanced sunward flow in the lobe cell. The ob-servations are discussed in relation to recent work on solar wind-magnetosphere-ionosphere interconnection topology.
Keywords. Magnetospheric physics (Auroral phenomena;
Magnetopause, cusp and boundary layers; Solar wind-magnetosphere interactions)
1 Introduction
The question of the spatial and temporal structure of the cusp/cleft ionosphere and its relationship to solar wind-magnetosphere interconnection topology have been and still
Correspondence to: P. E. Sandholt
(p.e.sandholt@fys.uio.no)
are great challenges to the magnetospheric physics commu-nity. One of the factors that contribute to the complexity of the problem is the variability of external conditions in the solar wind. To mitigate the problem of separating the spa-tial and temporal structure we have searched for long in-tervals of “steady” IMF and solar wind conditions. Under such conditions one can expect rather stable particle precip-itation boundaries. One can use continuous auroral observa-tions from a single ground station to delineate spatial struc-ture in the precipitation pattern as the station sweeps through different sectors of magnetic local time (MLT). In a recent study this technique has been used to reveal interesting spa-tial structure within in the 09:00–14:00 MLT sector during southeast directed IMF (Sandholt et al., 2004).
An outstanding spatial structure in the dayside aurora
ap-pearing during intervals with IMF Bz<0 and non-zero IMF
By component is the presence of a longitudinally restricted
band of strongly attenuated auroral emission, a so-called “midday gap aurora”, surrounded by auroral brightenings on both sides. The “midday gap aurora” is characterized by the absence (<1 kR) of green line emission, and attenuated
red line intensity, particularly during By>0 conditions
(Dan-dekar and Pike, 1978; Sandholt et al., 2004). The bright-ening events in the pre- and postnoon sectors are followed by poleward moving auroral forms (PMAFs). The latter au-rora is considered to be a signature of flux transfer events (FTEs) (Sandholt et al., 1990; Fasel, 1995). The auroral fea-ture mentioned above is an example of a precipitation struc-ture that can appear within the field of view of one sin-gle ground optical instrument, due to the fact that widely separated magnetopause plasma sources may map to rather closely spaced locations in the ionosphere (Sandholt et al., 1998; Maynard et al., 2001; Sandholt et al., 2004). The auro-ral observation has important implications for magnetopause reconnection topology. It is consistent with the recent MHD simulation results of Park et al. (2006) in that the most geo-effective magnetopause reconnection process under the given IMF condition occurs where the magnetic fields are near anti-parallel in the pre- and postnoon sectors, well away from the subsolar point. Thus from the auroral observations
showing the presence of three different auroral features in three different MLT sectors (PMAFs/prenoon, “midday gap aurora”, PMAFs/postnoon) we may learn that different re-connection modes are simultaneously in operation during a southeast (or southwest) IMF. First, there is an intermittent type activity (FTEs) corresponding to the auroral brightening events/PMAFs. Second, there is a quasi-steady reconnection mode originating in the subsolar region and corresponding to the more stable auroral arc (“midday gap aurora”) stretching across noon. The implication is that the subsolar reconnec-tion is of the component-type, since in the subsolar region the
geomagnetic field and the IMF with a nonzero Bycomponent
are not anti-parallel (Moore et al., 2002).
In this paper we shall apply the technique of continuous ground observations during quasi-steady external conditions for monitoring spatial magnetospheric structure in the post-noon (14:00–17:00 MLT) sector during an interval of
south-east IMF orientation (clock angle ∼135◦). We shall in
par-ticular be concerned with the structure in aurora/precipitation which is associated with a composite pattern of merging and lobe convection cells. According to large statistical studies of convection data, the lobe cell under the given IMF conditions is most strongly manifest in the summer season (Weimer, 1995). Since our case (12 December) is close to winter sol-stice the question of the presence of a lobe cell in the northern hemisphere is an interesting issue. We shall place the focus on the auroral signature.
Before returning to the lobe cell auroral activity, we
com-ment on the merging cell aurora under nonzero By
con-ditions, which is dominated by the brightening events and PMAFs mentioned above. In the dusk cell each event is ob-served to expand westward (noonward) and poleward in the
∼12:00–14:00 MLT sector (Sandholt et al., 1990, 1998;
Mi-lan et al., 2000; Sandholt and Farrugia, 2003). This auro-ral activity and motion is confirmed in the present case. It may be explained by transient events of antiparallel recon-nection occurring at high magnetopause latitudes in the post-noon sector (Maynard et al., 2001, 2003; Sandholt and Far-rugia, 2003). In a recent study we pointed out the presence of an interesting contrast between PMAFs in the prenoon and those appearing in the postnoon sector (Sandholt and
Farrugia, 2006b). While the PMAFs/prenoon develop in
three stages (latitudinally separate forms) spanning a lati-tude range of ≥500 km, the highest-latilati-tude stage is absent
in PMAFs/postnoon for By>0, which after the initial
in-tensification, progressively fade. The precipitation asym-metry about noon in the PMAF activity is found to be as-sociated with the dusk-dawn convection asymmetry and the solar wind-magnetosphere interconnection topology induced
by IMF By.
The lobe cell is generally thought to be a northward IMF phenomenon. In such cases the requirement of near antipar-allel IMF and lobe field is easily fulfilled in magnetopause regions poleward of the cusp (Crooker, 1979). However, according to the MHD simulation study of Crooker et al.
(1998), the lobe cell may not disappear when the IMF Bz
component goes negative as long as a substantial By
compo-nent is present (see also Reiff and Burch, 1985). When By
is large in comparison to Bz, the lobe cell is thought to exist
regardless of the Bzpolarity. This result has been confirmed
by observations from the FAST satellite reported by Eriks-son et al. (2002, 2003) and from DMSP F13 data during in-terplanetary magnetic cloud conditions reported by Sandholt and Farrugia (2006a). They find that a lobe cell is generally
present when |By/Bz|≥1. We note that their examples are
mainly from the summer and spring (March–April) seasons so none suffered from a seasonal disadvantage. By contrast we address here the winter season.
In a previous case study of the aurora under similar IMF
conditions (θ =135◦; By positive) we claimed to see
auro-ral and convection signatures of a lobe cell (Sandholt et al., 2003). However, since in that case the optical and ion drift coverage in the postnoon sector was limited, the interpreta-tion was not unambiguous. It was not a trivial task to distin-guish between auroral activities related to the lobe and merg-ing cells in that case. This limitation also applies to the study of Sandholt et al. (2001).
In the present case we have very good optical coverage in the whole postnoon/dusk sector so this is a good opportu-nity to document the appearance of lobe cell signatures. A dramatic change in the auroral structure was observed from the ground site at ∼11:20 UT/15:00 MLT under steady IMF conditions. From mid-afternoon to dusk local times (15:00– 17:00 MLT) the aurora configured in two latitudinally sep-arate branches, which we shall attribute to the presence of merging and lobe convection cells. This interpretation is then supported by plasma convection data obtained by Super-DARN radars. Our interpretation is strengthened further by the response of aurora/convection to the two distinct south-ward and northsouth-ward/eastsouth-ward rotations of the IMF in the pe-riod we study (recorded by Wind at 12:00 and 12:30 UT, respectively).
In the present paper we shall therefore be able to docu-ment for the first time the detailed dynamics of the aurora and plasma convection in a composite pattern consisting of merg-ing and lobe cells under the stated IMF conditions. This ob-servation is discussed in the context of recent work on solar wind-magnetosphere-ionosphere interconnection topology.
2 Data presentation
2.1 IMF and solar wind plasma data
Figure 1 shows solar wind plasma and IMF observations obtained from spacecraft Wind during the interval 08:00– 14:00 UT on 12 December 1999. Wind was beyond the dawn
terminator at 12:00 UT (–13.8; –57.3; 15.8) RE. A steady
5 nT IMF pointing south-east (average Bz= –3 nT; By= 3 nT;
Fig. 1. Solar wind plasma and IMF observations from spacecraft Wind during the interval 06:00–14:00 UT on 12 December 1999. Panels
from top to bottom shows proton density, temperature, bulk speed, solar wind dynamic pressure, the total field intensity and the GSM components (Bx, By, and Bz) of the interplanetary magnetic field (IMF), Alfven-Mach number (MA), proton beta, and the clock angle in
the GSM Y-Z plane.
low-density (1 cm−3) solar wind. The only rapid changes in
the IMF during the whole interval are the southward turn-ing at 12:00 UT and the subsequent transition to an approxi-mately eastward orientation at 12:30 UT (clock angle change
from 160 to 100◦). The latter change elicited a clear response
in the high latitude (75–80◦ MLAT) records from the
Green-land east chain of magnetometers at 12:30 UT (see below). The negligible propagation delay between Wind and ground is consistent with Wind’s position.
2.2 Case overview
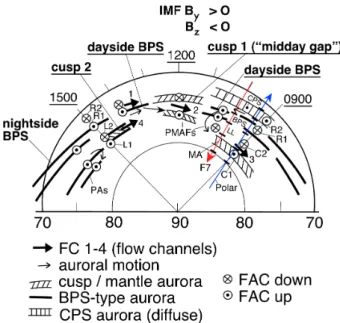
On an MLAT-MLT grid, Fig. 2 shows a schematic summary
of auroral forms for IMF By>0 and Bz<0 (clock angle range
90-135◦) conditions. FC 1-4 denote convection channels and
their relationships with FAC systems are indicated. Particle precipitation (CPS-BPS-LL-MA) and field-aligned current (FAC; C1-C2-R1-R2) data obtained from spacecraft DMSP F7 (Sandholt and Newell, 1992) and Polar (Farrugia et al., 2003), respectively, under similar IMF conditions (south-east
Fig. 2. Schematic illustration of auroral observations in relation
to plasma convection channels on 12 December 1999. Cusp-type (LLBL, cusp and mantle) auroras are marked by hatched areas while the BPS-type forms are indicated by lines. Four different flow chan-nels (labeled FC 1-4) and the associated field-aligned current (FAC) structure have been marked. The coordinate system is MLAT/MLT. Tracks of spacecraft Polar along 09:00 MLT and DMSP F7 along 10:00 MLT used to derive the precipitation/FAC information for other similar cases have been marked. Polar arcs (PAs) on the dusk side of the polar cap are shown.
orientation), have been incorporated in the figure (and the traces of the spacecraft trajectories shown by red and blue arrowed lines). The indicated precipitation regimes inferred from the F7 pass are central plasma sheet (CPS), boundary plasma sheet (BPS), low-latitude boundary layer (LL) and mantle (MA).
The relationship between FACs and plasma convection is of the type suggested by Southwood (1987). Region 1 (R 1) and 2 (R 2) FACs as well as the cusp currents C1-C2 and the lobe currents L1-L2 have been marked. This schematic summary figure, with emphasis on the postnoon sector, will be used as a reference for the interpretation of the aurora- and plasma convection observations presented below. A detailed discussion of the prenoon sector activity has been given by Sandholt and Farrugia (2006b).
2.3 Auroral observations
In order to place the postnoon sector aurora in the proper context we show in Fig. 3 meridian scanning photometer (MSP) records for an MLT range extending fron morning to evening on 12 December 1999. Magnetic noon (12:00 MLT) corresponds to 08:30 UT. We draw attention to the following features:
Fig. 3. MSP data obtained from Ny ˚Alesund for the whole day (05:00–17:45 UT; 08:30–21:15 MLT). Line-of-sight intensities are shown as a function of zenith angle for the wavelength channels at 630.0 (red) and 557.7 nm (green). North is to the left in each panel. Magnetic noon (12:00 MLT) = 08:30 UT.
(i) 05:00–06:00 UT (08:30–09:30 MLT): high-latitude brightening events and lower-latitude BPS arcs,
(ii) 06:30–08:15 UT (10:00–11:45 MLT): prenoon sector PMAFs,
(iii) 08:30–10:30 UT (12:00–14:00 MLT): postnoon sector PMAFs and inter-event “midday gap aurora”,
(iv) 11:20–13:10 UT (14:50–16:40 MLT): oval arc in the south and polar arcs further north,
(v) 13:40–15:00 UT (17:10–18:30 MLT): homogeneous oval arc in the south,
(vi) 15:00–16:15 UT (18:30–19:45 MLT): poleward bound-ary intensifications (PBIs), and
(vii) 16:15 UT (19:45 MLT) onwards: major substorms char-acterized by (a) double-branch aurora, (b) poleward expan-sions, (d) PBIs, and (e) auroral streamers travelling equa-torwards from the high-latitude branch to the lower-latitude branch (Sandholt and Farrugia, 2001; Sandholt et al., 2002a).
5 4 1 2 3 6 PMAFs PMAFs PA PA PAPA Nightside BPS Nightside BPS
Fig. 4. MSP data for the interval 10:00–14:00 UT (13:30-17:30 MLT). Line-of-sight intensities versus zenith angle for the 630.0 and 557.7 nm
emissions are represented by a color coded contour plot. PMAFs and polar arcs (PAs) are marked. The intensity scale is given at the bottom of each panel. North is up.
After this brief presentation of gross features of the aurora for the whole day we shall next focus on the aurora in the postnoon-dusk sector (10:30-13:20 UT/14:00-17:00 MLT), which is the main topic of this paper.
Figure 4 shows the MSP data for the interval 10:00– 14:00 UT (13:30–17:30 MLT) in a color-coded contour plot. The fine-structure is most easily seen in the green line panel. We shall place focus on the following features: (i) 10:00–10:30 UT: two classical brightening events followed by PMAFs, (ii) 11:10–12:00 UT: the presence of two lat-itudinally separate auroral branches, (iii) 12:00–12:30 UT: intense lower-latitude branch (llb) moving equatorward, higher-latitude branch (hlb) mostly absent, (iv) 12:30– 13:10 UT: weak llb while hlb is clearly present in the form of brightening events, (v) brightening events propa-gating from lower to higher latitudes, affecting both auro-ral branches, are observed during the following intervals: (a) 10:55–11:12 UT, (b) 11:18–11:30 UT, (c) 11:40–11:55 UT, (d) 12:10–12:20 UT, and (e) 12:40–13:00 UT. Features (iii)
and (iv) occur when the IMF points strongly south (θ ∼160◦)
and almost east (θ =100–120◦), respectively.
We now document the 2-D aspects of the auroral activity by all-sky camera (ASC) images. Figure 5 shows a sequence of ASC images (interval 11:20–11:30 UT) which is represen-tative of the auroral activity observed in the interval 11:00– 12:00 UT. The light integration time is 2 s for the 630.0 nm images. The central meridian at 11:30 UT corresponds to 15:00 MLT. Four intense forms are seen in the present ASC images, one to the left (west of the 15:00 MLT meridian) and three forms extending to the right (eastern) side in these pictures. We identify the northernmost forms on the east-ern (dusk) side as the polar arcs (marked PA in Fig. 2). The strong form (high red line intensity) on the western bound-ary of the FOV is identified as a cusp form (also marked in Fig. 2) which in this case is intense at ∼14:00 MLT.
The image sequence shown in Fig. 5 illustrates the dy-namics of polar arcs. The evolution of the events is char-acterized by a phase motion consisting of (i) the activation phase (intensification and westward expansion), which is fol-lowed by (ii) the fading phase (fading and eastward retrac-tion). At a certain time the aurora typically configures as 2–3 fragmented arcs being in different phases of evolution.
Fig. 5. ASC data representation of the 630.0 nm emission for the interval 11:20–11:30 UT. The coordinate system is zenith angle versus
azimuth angle. Magnetic north is up. West is to the left.
Fig. 6. ASC representation of the 557.7 nm emission for the interval 11:20–11:30 UT. Same format as in Fig. 5.
For example, at 11:24–11:26 UT the northernmost form is fading/retracting while a lower latitude form is in the bright-ening/expanding phase. These various phases are marked by the curled arrow attached to the arcs in Fig. 2.
Figure 6 shows the 557.7 nm counterpart to Fig. 5. The light integration time for the 557.7 nm images is 1 s. The southernmost arc is a rather homogeneous precipitation which we identify as the nightside BPS arc marked in Fig. 2. This arc intensifies at 11:28 UT (middle image in lower
panel). The arcs to the north of this are seen to expand into the FOV from the eastern (right) side, followed by poleward and eastward retraction, as described above. We note that the cusp arc at the western boundary, which is strongly present in the red line emission, does not appear in the green line emission. This is consistent with the lower characteristic en-ergy (<300 eV) of the electrons exciting this cusp-type au-rora (Newell and Meng, 1988).
Fig. 7. ASC representation of the 630.0 nm emission for the interval 12:30–13:00 UT. Same format as in Fig. 5.
Figure 7 shows ASC images at 630.0 nm for the times 12:30, 12:35, 12:40 UT (upper row) and 12:50, 12:55, and
13:00 UT (lower row). We note the following features:
(i) weakening of arc in southeast (lower right part) during the interval 12:35–12:40 UT, (ii) appearance of double cusp in the western part of the field of view during the interval 12:50–13:00 UT (northernmost branch is referred to as cusp 2), and (iii) polar arc extending eastward (tailward) from the strong cusp 2 emission (see 13:00 UT image). The change of auroral configuration from the upper row (12:30–12:40 UT) to the bottom row (12:50–13:00 UT) in Fig. 7 represents the
response to a change in IMF clock angle from 160 to 100◦.
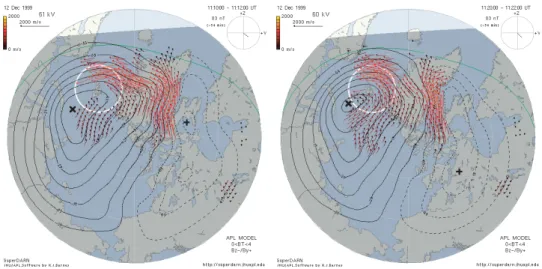
2.4 SuperDARN plasma convection data
Figure 8 shows plasma convection vectors and flow stream-lines obtained from SuperDARN radars (http://superdarn. jhuapl.edu) in the northern hemisphere during the fol-lowing intervals: (i) 11:10–11:12 UT/14:40 MLT (upper left), (ii) 11:20–11:22 UT/14:50 MLT (upper right), (iii) 12:40–12:42 UT/16:10 MLT (lower left), and (iv) 12:50– 12:52 UT/16:20 MLT (lower right). The approximate FOV
of the ASC in Ny ˚Alesund is marked by white circle in
each panel. The radar data (ion drift vectors) are supple-mented by a theoretical model of the electrostatic potential to obtain maps of plasma convection streamlines. Super-DARN (Greenwald et al., 1995) provides line-of-sight ve-locity measurements of the high-latitude ionosphere. These measurements are combined using the “Map Potential” fit-ting technique (Ruohoniemi and Baker, 1998) to produce maps of large-scale ionospheric convection.
The following features are important for this study: (i) The presence of strong westward flow (red arrows) in the merging
cell (flow channels FC 1 and FC 2 in Fig. 2) at times 11:10, 11:20, and 12:40 UT. (ii) Strongly attenuated westward con-vection in the duskside merging cell at 12:50 UT compared to that at 11:10 UT. (We note that this inference is based on a spatial SuperDARN plot showing limited data coverage). (iii) Lobe cell convection (flow channel FC 4 in Fig. 2) is present at 12:50 UT and possibly at 11:20 UT. (iv) Strong flow shears are evident in the convection cell located slightly
north of Ny ˚Alesund at 11:20 UT and well to the north of
Ny ˚Alesund at 12:50 UT. The locations of these flow shears
are consistent with the the presence of polar arcs in the op-tical data. As we shall see below, the activation of the lobe cell during the interval 12:30–13:05 UT (FC 4) gave rise to corresponding positive H-component deflection recorded by high-latitude magnetometers on the Greenland east coast.
From the convection data in Fig. 8 we also notice the pres-ence of flow channel FC 3 in the prenoon sector, located on the downstream side of the cusp/convection throat, at 11:10 and 11:20 UT (upper panel in Fig. 8).
2.5 Ground magnetic observations
Figure 9 shows magnetometer data from high latitudes on the Greenland eastcoast during the interval 09:00–14:00 UT (see http://www.dmi.dk/projects/chain/). The Greenland east chain is located ∼2 h to the west of the optical site on Sval-bard. Local noon (12:00 MLT) at the station is at ∼10:30 UT. We note the following features: (i) negative deflection dur-ing 10:30–11:00 UT, (ii) negative bay disappeardur-ing from 11:10 UT onwards, and (iii) positive deflection during the in-terval 12:30–13:05 UT. Positive H deflection corresponds to an eastward-directed equivalent ionospheric Hall current and associated westward-directed plasma convection (see lower
-03 -03 -03 -09 -09 -09 -15 -15 -21 -21 -27 -27 03 09 12 Dec 1999 12:40:00 - 12:42:00 UT 0 m/s 2000 2000 m/s APL MODEL 0<BT<4 Bz-/By+ 03 nT (-54 min) +Y +Z 56 kV SuperDARN http://superdarn.jhuapl.edu JHU/APL.Software by R.J.Barnes -03 -03 -09 -09 -09 -15 -15 -15 -21 -21 -27 03 03 09 09 12 Dec 1999 12:50:00 - 12:52:00 UT 0 m/s 2000 2000 m/s APL MODEL 4<BT<6 Bz-/By+ 04 nT (-54 min) +Y +Z 52 kV SuperDARN http://superdarn.jhuapl.edu JHU/APL.Software by R.J.Barnes
Fig. 8. Plasma convection data obtained from SuperDARN radars during the intervals 11:10–11:12 UT/14:40 MLT (upper left), 11:20–
11:22 UT/14:50 MLT (upper right), 12:40–12:42 UT/16:10 MLT (lower left), and 12:50–12:52 UT/16:20 MLT (lower right). White circle marks the approximate FOV of the ASC in Ny ˚Alesund.
right picture in Fig. 8). Features (ii) and (iii) correspond to the time of appearance of polar arcs in the auroral records
from Ny ˚Alesund, Svalbard (Fig. 4). In the discussion
sec-tion these features (polar arcs/positive H-deflecsec-tion at high latitudes) will be related to activations of the lobe cell con-vection shown in Fig. 2.
3 Discussion
We have reported observations of the complex configuration of auroral forms and activities observed during southeast ori-entation of the IMF. The emphasis is on the system of cusp-polar arcs in the postnoon sector. Before turning our atten-tion to these observaatten-tions we contrast them briefly with the prenoon observations shown in Fig. 3 in terms of the
so-lar wind-magnetosphere-ionosphere interconnection topol-ogy illustrated in Fig. 10.
The high-latitude auroral brightening events seen in Fig. 3 during the interval 05:00–08:00 UT (08:30–
11:30 MLT/∼77–80◦ MLAT) are interpreted in terms of
solar wind-magnetosphere-ionosphere coupling on the old-open magnetic field lines marked OO in Fig. 10. The associ-ated system of FACs is marked C1-C2. For documentation of these currents we refer to Farrugia et al. (2003). The associ-ated plasma convection channel (FC 3 in Fig. 2) is illustrassoci-ated by the plasma convection data in our Fig. 8. We note that Su-perDARN data also exist for the interval 05:00–08:00 UT, but the spatial coverage is not so good as later on this day. Con-vection data for 07:30 UT are shown in a recent paper where we discuss the PMAFs/prenoon versus PMAFs/postnoon in more detail (Sandholt and Farrugia, 2006b).
served during the interval 06:20–08:10 UT (∼09:50–
11:40 MLT/∼73–75◦MLAT) is attributed to a sequence of
plasma injections on the newly open (NO) field lines (FTEs) shown on the prenoon (left) side in Fig. 10. The sequence of brightening events observed in the interval 08:30–10:40 UT is attributed to newly open field lines in the postnoon sector
(marked t0 in Fig. 10). Each of these brightenings are
followed by PMAFs.
One important aspect of the present observations of post-noon activity from the ground is that we are able to supple-ment the precipitation pattern inferred from large statistical studies of satellite data (Newell et al., 2004) by new informa-tion on the small- and medium scale structure. The combi-nation of ground observations of the aurora and plasma con-vection may allow us to distinguish between phenomena be-longing to the merging- and lobe convection cells.
Our main objective is to document the detailed associa-tion that exists between aurora and plasma convecassocia-tion at high latitudes in the postnoon sector during intervals of steady
IMF conditions with non-zero By component (clock
an-gle = 135◦), and their responses to (i) the gradual southward
and (ii) sharp eastward/northward IMF transitions recorded by Wind at 12:00–12:30 UT and 12:30 UT, respectively. The responses to these IMF variations help us to distinguish be-tween the merging and lobe convection cells.
From the ground perspective we are able to distinguish be-tween standard BPS arcs in the auroral oval in the southern part of the FOV and the oval-aligned polar arcs located fur-ther north. The following features of the observations are essential. (i) The first appearance of polar arcs along the
Ny ˚Alesund meridian under steady south-east IMF
condi-tions occurred at 11:10 UT (14:40 MLT), (ii) From this time onwards the aurora typically configures in two latitudinally separate branches. (iii) The auroral dynamics takes the form of a sequence of brightening events. (iv) Each of these bright-ening event consists of the successive activation of forms in the lower branch followed by forms in the higher-latitude
branch. (v) The events in the high-latitude branch (polar
arcs in 15:00–17:00 MLT/75–78◦ MLAT sector) are
char-acterized by the following phase motions: (a) brightening and westward (noonward) expansion, followed by (b) fading and eastward retraction (see schematic illustration in Fig. 2). (vi) The sharp northward/eastward transition of the IMF at 12:30 UT elicited a fading of the low-latitude branch of the aurora and the activation of polar arcs at higher latitudes and the lobe convection cell during the interval 12:30–13:05 UT. (vii) The system of auroral forms which we refer to as cusp 2 – polar arcs (Fig. 2) is documented by ASC observations dur-ing the interval 12:50–13:05 UT (Fig. 7). (viii) The asso-ciation between polar arcs and lobe cell convection is indi-cated by the convection data reported in Fig. 8 and the mag-netograms shown in Fig. 9.
GREENLAND-EAST H-component meridional chain December 12, 1999
9 10 11 12 13 14 UT -50 0 50 NRD DMH 40 nT
Fig. 9. Greenland east chain data for the interval 09:00-14:00 UT.
Black and red traces show the H-component magnetic deflection recorded at stations Nord (NRD; 81◦MLAT) and Danmarkshavn (DMH; 77◦MLAT), respectively.
Fig. 10. Schematic view of the solar wind-magnetosphere-ionosphere interconnection topology for an IMF pointing southeast. The view is from the Sun. Merging and lobe reconnection lines (X) located in different planes on the postnoon/dusk side and the mag-netic tension force on newly open field lines are indicated on the dawn and dusk sides. Newly open (NO), old open (OO), and open lobe (L) field lines are marked. FACs linked to auroral forms in the pre- and postnoon sectors are indicated for the northern hemi-sphere. FACs flowing along old open field lines linked to the high-latitude boundary layer/magnetopause on the dawn (dusk) side in the northern (southern) hemisphere are marked C1-C2. The iono-spheric closure via the Pedersen current there is marked JP. Newly
reconnected and recently reconnected lobe field lines are marked t1
and t2, respectively. FACs along these field lines are labelled L1 and
L2. The track of spacecraft Polar on 3 December 1997 (see Farrugia et al., 2003) is indicated. Insert in upper right corner shows the IMF direction (θ =135◦) in GSM Y-Z coordiates.
These observations will be discussed in relation to the schematic illustration of the solar wind/IMF-magnetosphere-ionosphere interconnection topology shown in Fig. 10. We note that this schematic is consistent with a recent MHD sim-ulation study of the interconnection topology for the case of
nonzero IMF Bycomponent (Park et al., 2006). In the Park
et al. (2006) study the indicated regions of magnetic recon-nection on the pre- and postnoon sides appears as regions of low magnetic field intensity where the draped magnetosheath field is antiparallel to the geomagnetic field.
The FAC configuration shown on the dawn side is taken from ground-satellite conjunction studies by Sandholt and Newell (1992) and Farrugia et al. (2003). In the figure we distinguish between newly open (NO) and old open (OO) magnetic field lines. A lesson from the aurora (PMAFs) is that the reconnection process appears in the form of a se-quence of pulses. Furthermore, the momentum transfer along the old open flux tubes via the FACs marked C1-C2 in Fig. 10 gives rise to a plasma convection channel at the boundary of the dawn-side polar cap that contributes significantly to the dawn–dusk asymmetry of plasma convection in the polar cap (marked FC 3 in Fig. 2).
A central feature in the interpretation of the dusk side ob-servations is the distinction between reconnection X-lines lo-cated at sub-cusp and those lolo-cated at latitudes of the magne-tospheric lobe, as marked in Fig. 10. The following features are essential: (i) X-line at subcusp latitudes (in the region of near-antiparallel fields, as suggested by Crooker (1979) and Luhmann et al. (1984)) giving rise to a sequence of auroral brightening events centered in the 13:00–14:30 MLT sector (see Fig. 4). (ii) X-line at higher latitudes in the lobe giv-ing rise to (a) the FAC system marked L1-L2, (b) the cusp 2 aurora, (c) a channel of enhanced sunward convection, and (d) polar arcs in the 15:00–17:00 MLT sector in our case (Fig. 4). (iii) The evolution of the reconnection process at the magnetopause involving sub-cusp and lobe events may be inferred from the aurora (see below). (iv) Channel of enhanced noonward (sunward) convection (marked FC 4 in Fig. 2) observed during the interval 12:30–13:05 UT and pos-sibly during 11:20–11:30 UT (see magnetograms and Super-DARN data), giving rise to local flow shears and FACs. The brightening of the polar arcs is related to this.
The association between flow shear at the ionospheric level and polar arcs is well documented in theory and ob-servations (Reiff et al., 1978; Burch et al., 1979; Eriksson et al., 2005). The phenomenon of enhanced sunward con-vection (our flow channel FC 4) and the associated FACs and polar arcs have been documented for northward IMF condi-tions by Eriksson et al. (2005). Here we report the similar phenomenon for a different IMF orientation characterized by
clock angles within ∼100–135◦. The presence of polar arcs
and the lobe cell for southward IMF and |By/Bz|>1
condi-tions is in line with the MHD simulation studies of Crooker
et al. (1998). The present study indicates that the
oval-aligned polar arcs disappear (or retracts eastward, beyond our
FOV) only when the clock angle increases above 150◦, as
observed in the interval 12:00–12:30 UT in our case. Such behavior is in line with the idea of using the “anti-epsilon” function as a parameter for solar wind-magnetosphere cou-pling at high magnetopause latitudes (Kullen et al., 2002). “Anti-epsilon” approaches zero only for very high IMF clock angles.
From the present auroral observations we may infer inter-esting aspects of the evolution of the reconnection process on the magnetopause, as has been indicated in Fig. 10. In previ-ous studies it has been suggested that the reconnection pro-cess appears in the form of a series of “reconnection waves” rolling over the magnetopause starting at the subsolar region and progressing tailward (Milan et al., 2000). In the present case the observation of the successive activations of auroral forms from lower to higher latitudes in the postnoon sector (Fig. 4) may be interpreted in terms of the successive activa-tion of reconnecactiva-tion pulses at sub-cusp latitudes and in the lobe. This type of progression of the “reconnection wave” is indicated in Fig. 10 by the labelling of field lines with time
markers t0, t1, and t2. While t0marks the reconnection pulse
at sub-cusp latitudes, labels t1, and t2mark the evolution of
field lines following a pulse of lobe reconnection. Thus, t1
and t2represent different times that have elapsed since lobe
reconnection. For clarity, we note that the X-line at lobe lat-itudes in Fig. 10 lies tailward of (one dimension is missing) the X-line at sub-cusp latitudes.
The FACs labelled L1-L2 in Fig. 10 is closed in the iono-sphere by a Pedersen current. The associated poleward di-rected E-field gives rise to a channel of sunward convec-tion (called FC 4 in Fig. 2). The L1-L2 FAC system is the FACs on open lobe field lines, poleward of the R1-R2 FACs, that has been documented by FAST data in Eriksson et al. (2002). Thus, in our view, the manifestation of a pulse of lobe reconnection in the magnetosphere-ionosphere system proceeds as follows: (i) activation of the L1-L2 currents, (ii) activations of the cusp 2 aurora and convection channel FC 4, (iii) enhanced flow shear (converging E-field) at the poleward boundary of FC 4, (iv) brightening/westward ex-pansion of polar arcs (accelerated electrons in converging E-field regime; (see Reiff et al., 1978; Kullen et al., 2002) in the region of the outward-directed FAC marked L2, and (v) fad-ing/retraction of the same polar arcs when lobe reconnection is switched off.
Finally we note that the most equatorward FAC pair on the dusk (right) side in Fig. 10 is closed in the ionosphere by a poleward directed Pedersen current. The upward-directed current component is closely associated with PMAFs (Lock-wood et al., 1989) as observed in the interval 09:00– 11:00 UT in the present case (Figs. 3 and 4).
This paper addresses the question of spatial-temporal struc-ture of the dayside magnetosphere-ionosphere system un-der southeast IMF conditions as inferred from the aurora. The aurora is a key parameter for understanding the fine-structure of the inter-related system of particle precipitation, field-aligned currents, and plasma convection in the dayside magnetosphere. The dayside morphology under southeast-and southwest directed IMF consists of the following essen-tial elements (see Fig. 3):
(i) PMAFs/prenoon, (ii) the “midday gap aurora”, (iii) PMAFs/postnoon, (iv) polar arcs, (v) the cusp 2 aurora in the postnoon sector, and (vi) the duskside BPS arc.
A characteristic IMF By-related precipitation asymmetry in
PMAFs/prenoon versus PMAFs/postnoon has been docu-mented in a recent paper (Sandholt and Farrugia, 2006b).
In the present paper we focus on the morphology in the
12:00–17:00 MLT sector during the prevailing positive By
conditions on 12 December 1999. Both spatial and temporal structures were observed. The spatial structure consists of the following elements, observed when the IMF clock angle
is within ∼90–150◦:
(i) 12:00–15:00 MLT sector: a sequence of brightening events and associated noonward- and poleward moving forms (PMAFs/postnoon),
(ii) 15:00–17:00 MLT sector: latitudinally bifurcated aurora with brightening events progressing from the southern form (BPS arc) to the northernmost branch (polar arc).
The temporal structure consists of the following:
(i) disappearance of the northernmost branch (polar arcs) and intensification of the southernmost branch in response to a
gradually increasing IMF clock angle (approaching 160◦)
during the interval 12:00–12:30 UT (15:30–16:00 MLT), (ii) re-activation of the northernmost branch (polar arcs and cusp 2) and weakening of the southernmost form during the interval 12:40–13:05 UT.
The polar arc brightening events appearing within ∼75–
77◦MLAT/15:00–17:00 MLT are characterized by a
sequen-tial evolution of 2–3 forms that may be separated in two phases: (i) brightening and noonward (westward) expansion and (ii) fading and eastward retraction.
SuperDARN data are applied in order to place the ob-served auroral phenomena in the context of plasma convec-tion. The following results are obtained: (i) the phenomenon of PMAFs/postnoon appearing at the poleward boundary of a
convection channel (at ∼72–73◦MLAT/13:00–15:00 MLT)
in the merging cell, (ii) polar arcs (at ∼75–77◦MLAT/15:00–
17:00 MLT) appearing in the region of flow shear in a smaller convection cell embedded within the larger duskside merging cell.
The polar arcs and small, high-latitude convection cell are suppressed when the IMF clock angle increases above
∼150◦, while the same phenomena are
activated/strength-ened in association with the abrupt change of IMF clock
an-activation in response to northward turning of the IMF, we also refer to Sandholt et al. (2002b)). The smaller convec-tion cell within the merging cell may be identified as a lobe cell or a viscous cell (see Reiff and Burch (1985)). The ob-served response to IMF variability indicate that it is a lobe cell.
Acknowledgements. The Wind data are courtesy of R. P. Lepping
and K. W. Ogilvie. We thank B. Lybekk and E. Trondsen for tech-nical assistance during the auroral observation campaigns in Ny
˚
Alesund, and with the presentation of the optical data. Magnetome-ter data from the Greenland east chain has been kindly provided by J. Watermann (see http://www.dmi.dk/projects/chain/). The au-roral observation program on Svalbard is supported by the Norwe-gian Research Council, the NorweNorwe-gian Polar Research Institute and AFOSR Task 2311AS. This work is supported in part by NASA Living with a Star grant NAG5-12189, NASA Wind/SWE and MFI grant NNG05GC75G, and by NASA grant NNG05GG25G.
Topical Editor I. A. Daglis thanks L. Blomberg and another ref-eree for their help in evaluating this paper.
References
Burch, J. L., Fields, S. A., and Heelis, R. A.: Polar cap electron acceleration region, J. Geophys. Res., 84, 5863–5874, 1979. Crooker, N. U.: Dayside merging and cusp geometry, J. Geophys.
Res., 84, 951–959, 1979.
Crooker, N. U., Lyon, J. G., and Fedder, J. A.: MHD model merging with IMF By: Lobe cells, sunward polar cap convection, and
overdraped lobes, J. Geophys. Res., 103, 9143–9151, 1998. Dandekar, B. S. and Pike, C. P.: The midday discrete auroral gap, J.
Geophys. Res., 83, 4227–4236, 1978.
Eriksson, S., Bonnell, J. W., Blomberg, L. G., Ergun, R. E., Mark-lund, G. T., and Carlson, C. W.: Lobe cell convection and field-aligned currents poleward of the Region 1 current system, J. Geo-phys. Res., 107(A8), 1185, doi:10.1029/2001JA005041, 2002. Eriksson, S., Peria, W. J., Bonnell, J. W., Su, Y. J., Ergun, R. E.,
Tung, Y. K., Parks, G. K., and Carlson, C. W.: Lobe cell con-vection and polar cap precipitation, J. Geophys. Res., 108(A5), 1198, doi:10.1029/2002JA009725, 2003.
Eriksson, S., Baker, J. B. H., Petrinec, S. M., Wang, H., Rich, F. J., Kuznetsova, M., Dunlop, M. W., Reme, H., Greenwald, R. A., Frey, H. U., Luhr, H., Ergun, R. E., and Balogh, A.: On the gen-eration of enhanced sunward convection and transpolar aurora in the high-latitude ionosphere by magnetic merging, J. Geophys. Res., 110, A11218, doi:10.1029/2005JA011149, 2005. Farrugia, C. J., Sandholt, P. E., Maynard, N. C., Torbert, R. B.,
and Ober, D. M.: Temporal variations in a four-sheet field-aligned current system and associated aurorae as observed during a Polar-ground magnetic conjunction in the midmorning sector, J. Geophys. Res., 108(A6), 1230, doi:10.1029/2002JA009619, 2003.
Fasel, G.: Dayside poleward moving auroral forms: A statistical study, J. Geophys. Res., 100, 11 891–11 906, 1995.
Greenwald, R. A., Baker, K., Dudeney, J. R., Pinnock, M., Thomas, E. C., Villain, J. P., Cerisier, J.-C., Senior, C., Hanuise, C., Hunsucker, R. D., Sofko, G. J., Koehler, J., Nielsen, E., Pelli-nen, R., Walker, A. D. M., Sato, N., and Yamagishi, H.:
DARN/SUPERDARN: A Global View of the Dynamics of High-Latitude Convection, Space Sci. Rev., 71, 761–796, 1995. Kullen, A., Brittnacher, M., Cumnock, J. A., and Blomberg, L. G.,
Solar wind dependence of the occurrence and motion of polar au-roral arcs: A statistical study, J. Geophys. Res., 107(A11), 1362, doi:10.1029/2002JA009245, 2002.
Lockwood, M., Sandholt, P. E., Cowley, S. W. H., and Oguti, T., Interplanetary magnetic field control of dayside auroral activity and the transfer of momentum across the dayside magnetopause, Planet. Space Sci., 37, 1347–1365, 1989.
Luhmann, J. G., Walker, R. J., Russell, C. T., Crooker, N. U., Spre-iter, J. R., and Stahara, S. S.: Patterns of potential magnetic field merging sites on the dayside magnetopause, J. Geophys. Res., 89, 1739–1744, 1984.
Maynard, N. C., Burke, W. J., Sandholt, P. E., Moen, J., Ober, D. M., Lester, M., Weimer, D. R., and Egeland, A., Observa-tions of simultaneous effects of merging in both hemispheres, J. Geophys. Res., 106, 24 551–24 578, 2001.
Maynard, N. C., Ober, D. M., Burke, W. J., Scudder, J. D., Lester, M., Dunlop, M., Wild, J. A., Grocott, A., Farrugia, C. J., Lund, E. J., Russell, C. T., Weimer, D. R., Siebert, K. D., Balogh, A., Andre, M., and Reme, H.: Polar, Cluster and SuperDARN evi-dence for high-latitude merging during southward IMF: tempo-ral/spatial evolution, Ann. Geophys., 21, 2233–2258, 2003. Milan, S., Lester, M., Cowley, S. W. H., and Brittnacher, M.:
Con-vection and auroral response to a southward turning of the IMF: Polar UVI, CUTLASS and IMAGE signatures of transient flux transfer at the magnetopause, J. Geophys. Res., 105, 15 741– 15 756, 2000.
Moore, T. E., Fok, M.-C., and Chandler, M. O.: The day-side reconnection X line, J. Geophys. Res., 107(A10), 1332, doi:10.1029/2002JA009381, 2002.
Newell, P. T. and Meng, C. I.: The cusp and the cleft/boundary layer: Low-altitude identification and statistical local time varia-tion, J. Geophys. Res., 93, 14 549–14 556, 1988.
Newell, P. T., Ruohoniemi, J. M., and Meng, C. I.: Maps of precipitation by source region, binned by IMF, with iner-tial convection streamlines, J. Geophys. Res., 109, A10206, doi:10.1029/2004JA10499, 2004.
Park, K. S., Ogino, T., and Walker, R. J.: On the im-portance of antiparallel reconnection when the dipole tilt and IMF By are nonzero, J. Geophys. Res., 111, A05202,
doi:10.1029/2004JA010972, 2006.
Reiff, P. H. and Burch, J. L.: IMF By-dependent dayside plasma flow and Birkeland currents in the dayside magnetosphere, 2, A global model for northward and southward IMF, J. Geophys. Res., 90, 1595–1609, 1985.
Reiff, P. H., Burch, J. L., and Heelis, R. A.: Dayside auroral arcs and convection, Geophys. Res. Lett., 5, 391–394, 1978. Ruohoniemi, J. M. and Baker, K. B.: Large-scale imaging of
high-latitude convection with Super Dual Auroral Radar Network HF radar observations, J. Geophys. Res., 103, 20 797–20 811, 1998.
Sandholt, P. E. and Farrugia, C. J.: Multipoint observations of sub-storm intensifications: The high-latitude aurora and electron in-jections in the inner equatorial plasma sheet, Geophys. Res. Lett., 28, 483–486, 2001.
Sandholt, P. E. and Farrugia, C. J.: Does the aurora provide evidence for the occurrence of antiparallel magnetopause reconnection?, J. Geophys. Res., 108(A12), 1466, doi:10.1029/2003JA010066, 2003.
Sandholt, P. E. and Farrugia, C. J.: Spatiotemporal structure of the reconnecting magnetosphere under By-dominated
inter-planetary magnetic cloud conditions, J. Geophys. Res., 111, doi:10.1029/2005JA011514, 2006a.
Sandholt, P. E. and Farrugia, C. J.: The role of poleward moving auroral forms in dawn-dusk asymmetry of auroral precipitation induced by IMF By, J. Geophys. Res., in press, 2006b.
Sandholt, P. E. and Newell, P. T.: Ground and satellite observations of an auroral event at the cusp/cleft equatorward boundary, J. Geophys. Res., 97, 8685–8691, 1992.
Sandholt, P. E., Lockwood, M., Oguti, T., Cowley, S. W. H., Free-man, K. S. C., Lybekk, B., Egeland, A., and Willis, D. M.: Mid-day auroral breakup events and related energy and momentum transfer from the magnetosheath, J. Geophys. Res., 95, 1039– 1060, 1990.
Sandholt, P. E., Farrugia, C. J., Moen, J., Noraberg, Ø., Lybekk, B., Sten, T., and Hansen, T.: A classification of dayside auroral forms and activities as a function of IMF orientation, J. Geophys. Res., 103, 23 325–23 346, 1998.
Sandholt, P. E., Farrugia, C. J., Cowley, S. W. H., and Lester, M.: Dayside auroral bifurcation sequence during By-dominated
in-terplanetary magnetic field: Relationship with merging and lobe convection cells, J. Geophys. Res., 106, 15 429–15 444, 2001. Sandholt, P. E., Farrugia, C. J., Lester, M., Cowley, S. W. H.,
Mi-lan, S., Denig, W. F., Lybekk, B., Trondsen, E., and Vorob-jev, V.: Multistage substorm expansion: Auroral dynamics in relation to plasma sheet particle injection, precipitation, and plasma convection, J. Geophys. Res., 107(A11), 1342, doi:10.1029/2001JA900116, 2002a.
Sandholt, P. E., Farrugia, C. J., Moen, J., and Denig, W. F.: The cusp in rapid transition, J. Geophys. Res., 107(A12), 1427, doi:10.1029/2001JA009214, 2002b.
Sandholt, P. E., J., M., Farrugia, C. J., Cowley, S. W. H., Lester, M., Milan, S. E., Valladares, C., Denig, W. F., and Eriksson, S.: Multi-site observations of the association between aurora and plasma convection in the cusp/polar cap during a south-eastward (By≃|Bz|) IMF orientation, Ann. Geophys., 21, 539–558, 2003.
Sandholt, P. E., Farrugia, C. J., and Denig, W. F.: Detailed day-side auroral morphology as a function of local time for southeast IMF orientation: implications for solar wind – magnetosphere coupling, Ann. Geophys., 22, 3537–3560, 2004.
Southwood, D. J.: The ionospheric signature of flux transfer events, J. Geophys. Res., 92, 3207–3213, 1987.
Weimer, D. R.: Models of high-latitude electric potentials derived with a least error fit of spherical harmonic coefficients, J. Geo-phys. Res., 100, 19 595–19 608, 1995.