HAL Id: hal-00316246
https://hal.archives-ouvertes.fr/hal-00316246
Submitted on 1 Jan 1996
HAL is a multi-disciplinary open access
archive for the deposit and dissemination of sci-entific research documents, whether they are pub-lished or not. The documents may come from teaching and research institutions in France or abroad, or from public or private research centers.
L’archive ouverte pluridisciplinaire HAL, est destinée au dépôt et à la diffusion de documents scientifiques de niveau recherche, publiés ou non, émanant des établissements d’enseignement et de recherche français ou étrangers, des laboratoires publics ou privés.
Auroral-arc splitting by intrusion of a new convection
channel
H. U. Frey, G. Haerendel, S. Buchert, B. S. Lanchester
To cite this version:
H. U. Frey, G. Haerendel, S. Buchert, B. S. Lanchester. Auroral-arc splitting by intrusion of a new convection channel. Annales Geophysicae, European Geosciences Union, 1996, 14 (12), pp.1257-1264. �hal-00316246�
Correspondence to: H. U. Frey
Ann. Geophysicae 14, 1257—1264 (1996) ( EGS — Springer-Verlag 1996
Auroral-arc splitting by intrusion of a new convection channel
H. U. Frey1, G. Haerendel1, S. Buchert2, B. S. Lanchester3
1 Max-Planck-Institut fu¨r extraterrestrische Physik, Giessenbachstr., D-85740 Garching, Germany
2 Institut fu¨r Geophysik und Meteorologie, TU Braunschweig, Mendelssohnstr. 3, D-38106 Braunschweig, Germany 3 University of Southampton, Department of Physics, Southampton, SO17 1BJ, UK
Received: 6 March 1996/Revised: 24 June 1996/Accepted: 25 June 1996
Abstract. During a run of the Common Programme Three of the EISCAT radar the splitting of an auroral arc was observed by high time-resolution, ground-based cameras when the UHF radar beam was close to the arc. The evening eastward electrojet situation with a large-scale northward ionospheric electric field was disturbed by the intrusion of a convection channel with southward electric field from the east. The interaction of the new convection channel with the auroral arc caused changes in arc brightness and arc splitting, i.e. the creation of a new arc parallel to the preexisting auroral arc. The event is described as one possibility for the creation of parallel arcs during slightly disturbed magnetic conditions far from the Harang discontinuity.
1 Introduction
Auroral arcs are the optical signature of energy conversion processes in the magnetosphere. The conversion of mag-netic energy into kimag-netic energy of accelerated electrons occurs at an altitude of about 1000—10000 km (Shelley
et al., 1976) in a current circuit connecting the ionosphere
and the magnetosphere. The current circuit is set up by the transfer of momentum between the hot magnetospheric plasma and the ionosphere. The resulting magnetic shear stresses can be released in the process of auroral particle acceleration (Haerendel, 1980, 1989, 1994).
The steady-state situation of auroral-arc creation and proper motion has been extensively examined (see e.g. Beaujardie´re et al., 1977; Marklund et al., 1982; Bru¨ning and Goertz, 1986; Haerendel, 1989; Haerendel et al., 1993; Opgenoorth et al., 1990; Lewis et al., 1994; Frey et al., 1996). However, auroral arcs are very dynamic systems and show deformation (Oguti, 1981) caused by different physical processes in the magnetosphere. Some of the
main features of auroral arcs, like the westward-travelling surges and omega bands (Baumjohann, 1991), spirals (Hallinan, 1976), folds (Wagner et al., 1983) or curls (Hal-linan and Davis, 1970), are explained. But none of the existing theories of auroral-arc formation is able to ex-plain the creation of very small scales of auroral arcs (Borovsky, 1993), nor can these theories explain other kinds of deformation, such as unfolding transformations (Oguti, 1975). In this paper we want to discuss a typical phenomenon of auroral-arc dynamics, splitting of the arc. In this special example, however, the splitting is caused by the interaction of two independent current circuits and not by the acceleration mechanism itself.
2 Instrumentation
From 6 to 8 December 1994 the EISCAT Common Pro-gramme Three (CP-3) was run scanning from geomagnetic south at 19° elevation to 20° north with about 10° steps within 30 min and resting at each scan position for 60—120 s. The electron density profiles were measured in the short-pulse mode from +90-km altitude to 220—440-km altitude depending on the elevation angle and in the long-pulse mode between +150—600-km altitude. The common volume of the three receiving stations was kept at 275-km altitude for each scan position.
During the same time we observed the aurora with two image-intensified CCD cameras installed at the site of the EISCAT transmitter near Tromsø at a frame rate of 25 per second. The field of view of the wide-angle camera (86°] 64°) could be moved from south to north, while the narrow-angle camera was always pointing to local geomagnetic zenith with a field of view of 15°]21°. While the narrow-angle camera used a filter, the wide-narrow-angle camera was operated without filter during the time discussed in this paper. Nevertheless, we calculated absolute brightnesses from these white-light observations. Assuming a ratio between the emission of the green auroral line and the full auroral spectrum as typical for IBC III aurora (Vallance Jones, 1974), a model spectrum was evaluated with the
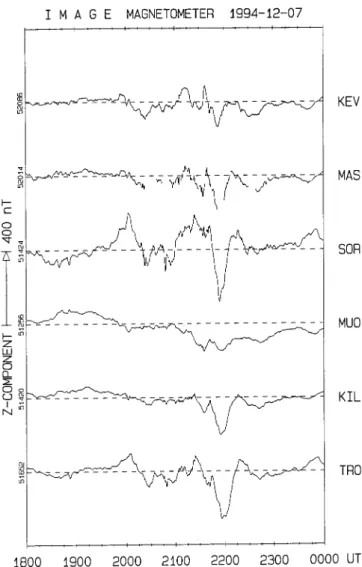
Fig. 1. Northward horizontal component of the ground-mag-netometer disturbances at different IMAGE magground-mag-netometer chain stations on 7 December 1994
Table 1. Geomagnetic location of IMAGE magnetometer chain stations
Station Code Latitude Longitude Kevo KEV 64.80 113.39 Masi MAS 64.89 110.58 Soroya SOR 66.08 110.30 Muonio MUO 63.53 109.38 Kilpisja¨rvi KIL 64.81 107.93 Tromsø TRO 65.64 106.98
Fig. 2. Vertical component of the ground-magnetometer distur-bances at different IMAGE magnetometer chain stations on 7 De-cember 1994
absolute sensitivity function of the camera calibrated with a standard light source and interference filters. Taking into account the properties of the optics and atmospheric extinction green-line intensities can be estimated.
3 Observations
According to the ground-magnetometer data from 7 De-cember, northern Scandinavia (Table 1) was dominated by the eastward electrojet between 1800 and 1920 UT (Fig. 1)
with its approximate centre over a line between Kevo and Tromsø (Fig. 2). Beginning at 19:15 the horizontal X-com-ponent of the ground magnetic disturbance decreased and changed to negative values at 19:47 with a temporal min-imum at Tromsø of !182 nT at 20:03, followed by an increase to very small disturbances at 20:20. A clear west-ward electrojet situation was measured after 21:00. The positive disturbance of the Z-component around 20:00 at the coastal stations Soroya and Tromsø is caused by the coast effect (Untiedt and Baumjohann, 1993).
In the early evening only very weak auroral structures were observed, with one arc of +1-kR brightness (557.7 nm) appearing at 19:10 at 40° north elevation and leaving the field of view of our wide-angle camera towards north at 19:15. The decrease in the ground-magnetometer X-component coincided with the first visibility of the auroral arc under study at 45° south elevation at 19:19 (Fig. 3). This arc of less than 10-km thickness and about 20-kR brightness showed brightness patterns and rays moving towards east with velocities of up to 8 km s~1. Because this arc was far south from the magnetic zenith, we observed the poleward side of this arc, and the east-ward motion of small-scale structures is consistent with
Fig. 3. Sequence of CCD camera images of the auroral arc under study. The field of view is 86°]64° with north to the right and east on top, and the UT is given in the upper right part. The image are
contrast enhanced. The integration time of the images at 19:38 and 19 :40 is twice the integration time of all other images (10 ms)
the creation by a U-shaped potential (Haerendel et al., 1996). Between 19:24 and 20:29 the arc moved from south to north with a mean but not constant velocity of 72$10 m s~1 and reached local magnetic zenith at 19:43:30. At 19:28 the arc became weaker and broader with a brightness minimum of about 3 kR at 19:38. The velocity of the motion of internal structures decreased to 2—3 km s~1 eastward. Later the arc became brighter again and changed into a broad, inverted-V-like arc of 50-km thickness at 19:52.
The dynamics of this arc were analysed in greater detail between 19:39:00 and 19:47:00, when the EISCAT radar measured close to it (Fig. 4). A dynamic representation of cuts through the arc along the radar scan direction is given in Fig. 5. The original northward motion of the arc stopped and its brightness increased by a factor of 2 be-tween 19:39:30 and 19:40:20, fading again after 19:40:35. Another brightness increase occurred at 19:41:20 by a fac-tor of 2 within 16 s, but 12.2 km south from the location of the original brightness maximum together with westward
Fig. 4. CCD camera image of the auroral arc. The location of local magnetic zenith (diamond) and the position of the radar electric field measurements traced down to 110-km altitude (asterisk) are marked. EISCAT measured the plasma drift vectors at these positions (from south to north, left to right) 19:38:40—19:40:40, 19:41:10— 19 : 42:10, 19:42:30—19:43:40 and 19:44:10—19:45:50
Fig. 5. Representation of brightness cuts through the auroral arc observed on 7 December 1994 along the radar scan. South is left and north is right. Cuts taken between 19:39:00 and 19:47:00 in 1-s steps are given from bottom to top. The short bars represent the radar positions during the measurements 19:41:10—19:42:10 and 19:42:30—19:43:40
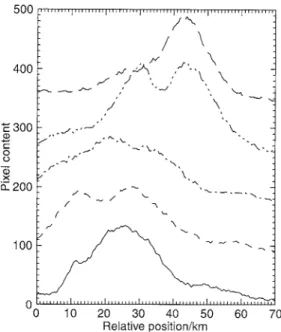
Fig. 6. South-north brightness profiles along the scan direction through the arcs in 1-min steps beginning 19:40:25 from bottom to
top. The profiles are shifted for better comparability
ray motions at its equatorward side. At 19:41:35 a parallel arc 17$1 km further north developed close to the orig-inal latitude position of the brightness maximum. Both arcs decreased brightness after 19:42:10 with the northern arc fading below the sensitivity limit of the camera. After 19:42:45 the brightness increased again by a factor of 2.5 within 19 s, and with a delay of 12 s the northern arc followed. Maximum 557.7-nm arc brightnesses of 10$2
and 11$2 kR were determined for the southern arcs and 8$2 and 11$2 kR for the northern arcs, respectively. The brightness between the arcs was about 60% of the maximum within the arcs, but this estimate may be too high because the gap between the arcs was off zenith. During the further increase in brightness, the energy input changed from the southern arc to the northern, which became the only arc after 19:43:35. At that time clear westward motions of brightness patterns with velocities of 2.5 km s~1 could be seen at the equatorward edge of this northern arc. After 19:45, north of the arc, a band of diffuse auroral brightness moved into the field of view of the cameras from the east with a mean velocity of about 1 km s~1, together with an increase in arc brightness from east to west. The connection between both bands created the broad inverted-V-like structure after 19:50. Another representation of the temporal development of two paral-lel arcs is given in Fig. 6.
The plasma velocity measurements (Fig. 7) between 19:00 and 19:30 verify the large-scale eastward electrojet situation. The scan between 19:30 and 20:00 exhibits east-ward plasma drifts between 19:43 and 19:48 when the common volume was north of the arc. The next scan between 20:00 and 20:30 indicates the northward motion of the region of eastward plasma drift (southward iono-spheric electric field). Close to the arcs very strong velocity variations within the dwell time of a single antenna posi-tion were observed in the EISCAT data, which is a signa-ture of field-aligned currents associated with the arcs.
During the time of arc splitting the southward compo-nent of the plasma drift was 200—300 m s~1 with respect to the fixed observer. One has to add the mean arc velocity of 72 m s~1 northward, which was, as mentioned earlier, oscillatory. This again confirms that the arc is not frozen in the ionospheric plasma and that sometimes oscillations can be observed (Haerendel et al., 1993; Frey et al., 1996).
Fig. 7. 20-s-integrated plasma drift measurements by the EISCAT CP-3 programme. The location of the arc was traced up to the 275-km altitude of flow measurement and is marked during each scan. The scale for 1000 m s~1 plasma drift velocity is given in the lower right corner. East is right
Fig. 8. Electron density profiles (10-s integration) measured by the EISCAT CP-3 programme on 7 December 1994 19:41:10 ( full line) and 19:42:10 (broken line) with 64° elevation
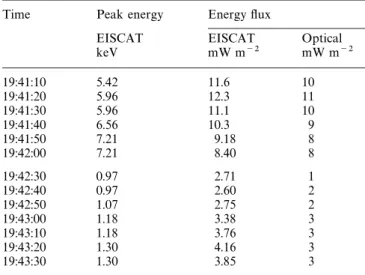
Table 2. Comparison of data derived from optical observations and from EISCAT measurements
Time Peak energy Energy flux
EISCAT EISCAT Optical keV mW m~2 mW m~2 19:41:10 5.42 11.6 10 19:41:20 5.96 12.3 11 19:41:30 5.96 11.1 10 19:41:40 6.56 10.3 9 19:41:50 7.21 9.18 8 19:42:00 7.21 8.40 8 19:42:30 0.97 2.71 1 19:42:40 0.97 2.60 2 19:42:50 1.07 2.75 2 19:43:00 1.18 3.38 3 19:43:10 1.18 3.76 3 19:43:20 1.30 4.16 3 19:43:30 1.30 3.85 3 4 Discussion
In his qualitative description of auroral-arc metamorph-oses, Oguti (1975) described arc splitting as a major kind of deformation and initiator of arc activation. But Oguti’s cases do not fit our observation of the appearance of a new, unconnected arc, because in all cases he describes the new arc as arising from and being connected to the old arc. Though we cannot rule out a connection between both arcs outside the field of view of our cameras, this is unlikely. Our field of view is much larger than that of Oguti’s camera, +100° compared to +60°. Furthermore, we add here the temporal change of the arc brightness which shows the contrary situation, that the increase in brightness is the initiator of the creation of a new parallel arc.
The electron density profiles measured by the radar between 19:41:10 and 19:42:10 have been used to estimate the peak energy and energy flux of the electron spectrum that caused the arc. At the beginning of this interval the original arc was in the radar, later the radar beam was between the arcs (Fig. 5). The electron density profiles (Fig. 8) were modelled by solving the time-dependent coupled continuity equations for the important ions, and the electron transport equation (Lanchester et al., 1994). The fitted peak energies and energy fluxes are given in Table 2. The arc brightnesses measured at the magne-tic foot-point of the radar common volume were used for the calculation of energy fluxes from the optical data. As the auroral-line brightness also depends on the energy of the precipitating electrons, this value has been taken from the radar data and the energy fluxes were derived follow-ing Rees and Luckey (1974) from the estimated green-line intensities (Section Instrumentation). Generally, the trends of both data sets are equal but the optical data are lower. This must be due to an improper transformation of the recorded full spectrum to green-line intensities.
Addi-tionally, the energy fluxes derived from the radar data are likely to be underestimated in real terms because of the 10-s time average. More detailed comparison of these two methods is the subject of further work.
In Fig. 8 the increase in the peak electron energy (decrease in altitude of maximum electron density) can be seen. The second local electron density maximum at high-er altitudes (130—180 km) in the profile from 19:42:10 is due to the measurement of the radar above the southern arc. The optical observations (Fig. 5) confirm that the decrease in the energy flux measured by the radar from 19:41:20 to 19:42:10 is apparent and due to the motion of the arc relative to and away from the fixed radar position. The energy input into the arc centre, however, increased as shown by the increase in arc brightness.
Fig. 9a, b. Sketch of the ionospheric-magnetospheric current system a before and b after the onset of the negative bay in the Tromsø ground-magnetometer data of Fig. 1
During the quiet-time evening eastward electrojet situ-ation (Iijima and Potemra, 1978) the arc was connected to a downward current sheet further south (Fig. 9a). This can be deduced from the ground-magnetometer data and the westward direction of ionospheric plasma flow in the whole area probed by the EISCAT scan (Fig. 7).
The splitting of the auroral arc between 19:40 and 19:45 was caused by the intrusion of a new narrow current circuit into the large-scale ionospheric current system (Fig. 9b). Inside the new current circuit between 69° and 71° latitude the plasma drifts eastwards. The related Hall current creates the negative bay of the horizontal ground-magnetic component between 19:40 and 20:00. Thus it seems that the upward field-aligned current in the area of the northern arc is fed by a southward Pedersen current arriving from further north, where it is connected to a downward jE, whereas the southern (edge of the) arc is still related to the original northward Pedersen current. The increase in arc brightness from east to west and the intrusion of a diffuse auroral structure (Section Observa-tions) suggest that this new convection channel arrived from magnetic midnight. This interpretation is consistent with the short positive deflection of the ground-magnetic D component between 19:45 and 20:20.
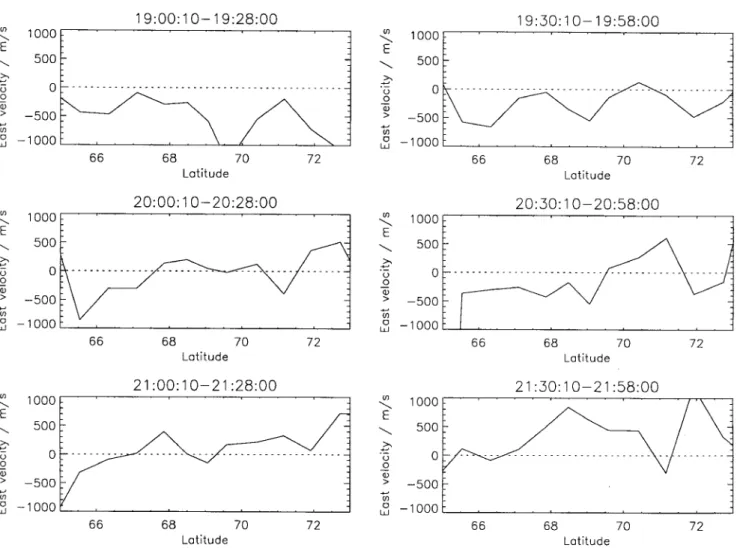
The change of the ionospheric electric field from pole-ward to equatorpole-ward at the arc is reminiscent of the electric-field pattern at the Harang discontinuity (Maynard, 1974). But, although the Harang discontinuity is known as a very dynamic structure which is not fixed in space and time and changes with magnetic activity (Kam-ide, 1988), this arc splitting is probably not the
manifesta-tion of a dislocamanifesta-tion of that large-scale flow boundary. In addition to the change of the ground-magnetic H distur-bance from positive to negative, the Harang discontinuity is characterised by a negative D bay (Chen and Rostoker, 1974). This signature can be seen clearly in the mag-netometer data not only at Tromsø (Fig. 1), but also at all other magnetometer sites of the IMAGE network after 21:00. The eastward component of the ionospheric plasma flow velocities is given in Fig. 10. Between 19:00 and 19:28 the plasma motions were directed westward. A localised eastward flow can be seen in the Tromsø area (69.6° latitude) between 19:30 and 20:28, while the scan between 19:30 and 19:58 still measured westward drift in the region between 71° and 73° latitude (Fig. 7). The Harang discon-tinuity appears more clearly at about 69.5°, 67.1° and 65.5° during the scans beginning 20:30, 21:00 and 21:30, respectively. The situation between 19:30 and 20:28 is disturbed in the Tromsø area, but most probably the Harang discontinuity is measured by the 20:00—20:28 scan at about 71.5° latitude, i.e. about 200 km north of Tromsø. The connection of two different current circuits to initially two and later one broad arc is also supported by the optical signature of the asymmetry of arc brightness (Haerendel et al., 1996). Before 19:42 the southern edge of the arc was brighter and more dynamic than the northern edge. After 19:45 the northern part of the arc became the leading edge with greater brightness and stronger motions of small-scale patterns.
During the time interval from 19:30 to 20:00 there are no clear features of a substorm in the magnetometer data and the optical signatures of the aurora. But the inter-pretation of the new convection channel as the westward electrojet of a small localised substorm or pseudo-breakup occurring in the magnetic midnight region north of Russia is a possible explanation of the origin of the new current circuit. Northern Scandinavia may only slightly be influenced by this small disturbance, but the westward auroral electrojet may explain the main experimental fea-tures.
The change of the northward component of the hori-zontal magnetic disturbance (Fig. 1) from positive to nega-tive disturbances at the eastern station Kevo occurs 170 s before that in Tromsø. The increase in arc brightness from the east, the intrusion of the band of diffuse aurora from east, and the strong coast effect at the stations Soroya and Tromsø caused by an intensified ionospheric current are further indications for the possibility of a westward elec-trojet.
5 Conclusions
The auroral-arc splitting described here was caused by the interaction of two different current systems with north-ward and southnorth-ward ionospheric electric fields. The intru-sion of a new, oppositely directed flow and current system coincided with temporal oscillations of the arc brightness and subsequent continued intensification. The observed event may be seen as a forerunner of the west- and south-ward displacement of the Harang discontinuity. But its spatial extent is best explained as an intrusion of an
Fig. 10. East component of the plasma velocities measured by EISCAT at six south-north scans between 19:00 and 21:58
eastward convection channel arriving from the midnight sector in the manner of an avalanche, and which may be caused by a westward-expanding substorm electrojet into only slightly disturbed regions. Such events can cre-ate parallel arcs and may not be uncommon phenomena.
Acknowledgements. The authors thank H. Lu¨hr for providing the
IMAGE data. The IMAGE magnetometer network is a joint project of European research groups. The German section is funded through grants of the Deutsche Forschungsgemeinschaft.
Topical Editor D. Alcayde´ thanks Y. Kamide and another referee for their help in evaluating this paper
References
Baumjohann, W., Electrodynamics of active auroral forms: West-ward travelling surges and omega bands, in Auroral physics, C.-I. Meng, M. J. Rycroft and L. A. Frank (eds.), AGU, Washington, 1991.
Beaujardie{ re, O. de la, R. Vondrak, and M. Baron, Radar observa-tions of electric fields and currents associated with auroral arcs,
J. Geophys. Res., 82, 5051, 1977.
Borovsky, J. E., Auroral arc thicknesses as predicted by various theories, J. Geophys. Res., 98, 6101, 1993.
Bru~ ning, K., and C. K. Goertz, Dynamics of a discrete auroral arc, J.
Geophys. Res., 91, 7057, 1986.
Chen, A. J., and G. Rostoker, Auroral-polar currents during periods of moderate magnetospheric activity, Planet. Space Sci., 22, 1101, 1974.
Frey, H. U., G. Haerendel, D. Knudsen, S. Buchert, and O. H. Bauer, Optical and radar observations of the motion of auroral arcs, J.
Atmos. ¹err. Phys., 58, 57, 1996.
Haerendel, G., Auroral particle acceleration — an example of a uni-versal plasma process, ESA J., 4, 197, 1980.
Haerendel,G., Cosmic linear accelerators, ESA SP, 285, 37, 1989. Haerendel, G., Acceleration from field-aligned potential drops,
Astrophys. J. Suppl. Ser., 90, 765, 1994.
Haerendel, G., S. Buchert, C. LaHoz, B. Raaf, and E. Rieger, On the proper motion of auroral arcs, J. Geophys. Res., 98, 6087, 1993. Haerendel, G., B. U. Olipitz, S. Buchert, O. H. Bauer, E. Rieger, and C. LaHoz, Optical and radar observations of auroral arcs with emphasis on small-scale structures, J. Atmos. ¹err. Phys., 58, 71, 1996.
Hallinan, T. J., Auroral spirals, 2. Theory, J. Geophys. Res., 81, 3959, 1976.
Hallinan, T. J., and T. N. Davis, Small-scale auroral arc distortions,
Planet. Space Sci., 18, 1735, 1970.
Iijima, T., and T. A. Potemra, Large-scale characteristics of field-aligned currents associated with substorms, J. Geophys. Res., 83, 599, 1978.
Kamide, Y., Electrodynamic processes in the Earth’s ionosphere and
magnetosphere, Kyoto Sangyo University Press, Kyoto, 1988.
Lanchester, B. S., J. R. Palmer, M. H. Rees, D. Lummerzheim, K. Kaila, and T. Turunen, Energy flux and characteristic energy of an elemental auroral structure, Geophys. Res. ¸ett., 21, 2789, 1994.
Lewis, R. V., P. J. S. Williams, G. O. L. Jones, H. J. Opgenoorth, and M. A. L. Persson, The electrodynamics of a drifting auroral arc,
Marklund, G., I. Sandahl, and H. Opgenoorth, A study of the dynamics of a discrete auroral arc, Planet. Space Sci., 30, 179, 1982.
Maynard, N. C., Electric field measurements across the Harang discontinuity, J. Geophys. Res., 79, 4620, 1974.
Oguti, T., Metamorphoses of aurora, Mem. Natl. Inst. Polar Res., Ser. A 12, 1975.
Oguti, T., TV observations of auroral arcs, in Physics of auroral arc
formation, S.-I. Akasofu and J. R. Kan (eds.), AGU, Washington,
1981.
Opgenoorth, H. J., I. Ha~ ggstro~m, P. J. S. Williams, and G. O. L. Jones, Regions of strongly enhanced perpendicular electric fields adjacent to auroral arcs, J. Atmos. ¹err. Phys., 52, 449, 1990.
Rees, M. H., and D. Luckey, Auroral electron energy derived from ratio of spectroscopic emission, 1. Model computations, J.
Geo-phys. Res., 79, 5181, 1974.
Shelley, E. G., R. G. Johnson, and R. D. Sharp, Satellite observations of an ionospheric acceleration mechanism, Geophys. Res. ¸ett., 3, 148, 1976.
Untiedt, J., and W. Baumjohann, Studies of polar current systems using the IMS Scandinavian magnetometer array, Space Sci.
Rev., 63, 245, 1993.
Vallance Jones, A., Aurora, D. Reidel, Dordrecht, 1974.
Wagner, J. S., R. D. Sydora, T. Tajima, T. Hallinan, L. C. Lee, and S.-I. Akasofu, Small-scale auroral arc deformations, J. Geophys.
Res., 88, 8013, 1983.
.
![Fig. 3. Sequence of CCD camera images of the auroral arc under study. The field of view is 86° ] 64° with north to the right and east on top, and the UT is given in the upper right part](https://thumb-eu.123doks.com/thumbv2/123doknet/14793137.602353/4.877.67.719.133.867/sequence-camera-images-auroral-study-field-north-right.webp)