Dancing with the Stars: The Value of Design in Real Estate Development
by
Minkoo Kang
B.S., Interior Design, 2010
Hanyang University
Submitted to the Program in Real Estate Development in Conjunction with the Center for Real Estate in Partial
Fulfillment of the Requirements for the Degree of Master of Science in Real Estate Development
at the
Massachusetts Institute of Technology
February, 2019
2019 Minkoo Kang
All rights reserved
The author hereby grants to MIT permission to reproduce and to distribute publicly paper and electronic copies of
this thesis document in whole or in part in any medium now known or hereafter created.
Signature of Author
Certified by
Accepted by
Signature redacted
'
Center for Real Estate
Signature redacted
Signature redacted
Professor Dennis Frenchman Class of 1922 Professor of Urban Design and Planning, Director, Center for Real Estate School of Architecture and Planning
MAS '
OF TECHNOLOGY
CHUETSNTTE
F EB 2
8
2019
LIBRARIES
Dancing with the Stars: The Value of Design in Real Estate Development
by
Minkoo Kang
Submitted to the Program in Real Estate Development in Conjunction with the Center for Real Estate on January 15, 2019 in Partial Fulfillment of the Requirements for the Degree of Master of Science in Real
Estate Development
ABSTRACT
This study investigates the financial performance of awarded architectural design for buildings in
Manhattan, New York. Awarded design is based on the achievement of the architect and/or the
architecture firm receiving prestigious awards from the industry such as the Pritzker prize, AIA
Architecture Firm Award, the Architectural Innovation Award of the Wall Street Journal to name
just a few. To measure financial performance, I use several datasets, Real Capital Analytics,
Compstak, Walkscore and NYC public data for New York City. To identify awarded design and
compare it to non-awarded design, I employ a matched-pair analysis. I find 846 building
transactions with 89 awarded design transactions that are matched geographically to
757
non-awarded design transactions within a quarter mile radius over the 2000 to 2017 period. The
results of the multivariate hedonic analysis suggest that, compared with buildings in the
quarter-mile neighborhood, office buildings designed by awarded architects and awarded architecture
firms have a statistically and economically significant transaction premium of 23.1 percent,
ceteris paribus, with a model that explains just under 90 percent of the variation in transaction
price. Results of this analysis are intended as way for designers to have agency in the design
build development practice and for developers and investors to understand the value of engaging
in awarded design effects.
Thesis Supervisor: Dr. Andrea Chegut
Title: Research Scientist for Center for Real Estate
TABLE OF CONTENTS
I
Obstacle & Intention 06Setting the Architectural Stage 08
11
Why (Still) New York: Big Apple, Big Data 10 Why Now: Current Climate of Design in the Built 14Environment
Money & Design: How Finance/Economics define 20 Design
Stepping Stone 24
II
Studying the Value of Design Methods 26Data 38
Identifying Awarded Architects and Firms 40
Control Group Data 56
Descriptive Statistics 60
Methodology 66
Results: Awarded Designs and Transaction Prices 68
Results: Awarded Architects & Firms and 69
Transaction Prices
Robustness: All Architects & Firms and 72
Transaction Prices
Conclusion 74
Reference 76
Appendix 78
INVESTMENT
& DESIGN
REAL ESTATE &DSG
DEVELOPMENT
ARCHITECTURE
& DESIGN
FROM SINGLE DISCIPLINE SET OF UNDERSTANDINGS
OBSTACLE
In recent years, due to increased market education and growth in number of leading examples, investing in high quality design became a standard for the real estate market in New York City. Despite the growing interest, however, a limited number of studies and discussions have been gener-ated to help create a shared value surrounding the subject of design. In this study, we have identified that the difficulty of obtaining data relgener-ated to design performance being one of the biggest hurdles in enabling further studies to disentangle the value of design. One principle problem is knowing who designed a building, what is their architectural legacy, and can it be matched to a financial performance measure.
INVESTMENT
& DESIGN
REAL ESTATE
DEVELPMENT
ARCHITECTURE
DEVELOPMENT
TO A SHARED KNOWLEDGE PLATFORM
INTENTION
To resolve this issue, we find and measure the architectural legacy of the architects of New York City buildings and pair that with financial data. In addition to using the awards as means to identify architects who have won high status among their peers, this study intend to broaden the scope of understanding the value of design by adding substantially more driving factors in the real estate transaction pricing process by incorporating buyer and seller decisions for all of the transactions over time, specifying the type of awards, and adding information on architects to every build-ing in the sample data set. The added measures improved our model's ability to explain the variation in transaction price. We believe combinbuild-ing new measurements with the accumulated knowledge on design generated by architects will enable us to open up a substantial area for future re-search regarding the value of design, and moreover will help create agency for design in the realm of finance and economics.
SETTING THE ARCHITECTURAL STAGE
DEFINITIONS
DESIGN
The terminology design is limit-ed to the design of architecture, especially the design of commer-cial buildings.
BUILT ENVIRONMENT
Man-made structures, features,
and facilities viewed collectively as an environment in which peo-ple live and work. In this study, we are limiting the terminology to buildings and infrastructure in an urban setting.
DESIGN DEVELOPMENT
In this research, the terminology "design development" is used to indicate a real estate develop-ment model that engages both the work of an architect and real estate development profession-al. It is a business model that typically requires the architect or a designer to invest in the equity portion of the project to form a partnership with a real estate de-veloper. The partnership benefits from increased control in design.
A
look
ilt) the Luture: a render (f \lauilntai. PI(tographi:
(ItyReuAltyNew York 2020: A Sea of Design
As part of its latest development report, real estate agency cityrealty has released a series of visualizations, illustrating the new york skyline in the year 2020. In summary, Cityrealty reported while fewer developers in 2016 are signing on to build sky-grazing towers, condominium prices are still on an upward trajectory with anticipated sales totaling roughly $30 billion through 2019. The report added, the new ground breaking devel-opments has largely concentrated on midtown in recent years, there is now set to be a new wave of construction in the financial district.
WHY (STILL) NEW YORK:
BIG APPLE, BIG DATA
1921 1932 1999 2018 2022
I
00!u .-," Amok,WHY (STILL) NEW YORK: BIG APPLE, BIG DATA 60 - - --50 Government 40 30- - -Non-residential 20 - - -.-.-.-.-10 Residentdial 0 2001 2002 2003 2004 2005 2006 2007 2008 2009 2010 2011 2012 2013 2014 2015 2016 2017 2018 2019 2020
Figure
1
-Annual Construction Spending in New York City, 2001-2020 (in billions)LUr, IMAGE 1.
Note: Change in the skyline of New
York
Ciyfrom 1921. Source: https://www.theguardian. com/cities/gallery/2018/oct/19/ rising-high-the-evolving-skyline-new-york-city-manhattan-in-pictures FIGUE 1.Note: The graph shows the hihest construction spending in 2018. Source: Dodge Data & Analytics,
NMS
Department of Labe, public sector capital budgets. US. Census Bureau,Urbanomics
New York City has historically been the center of modern ar-chitecture and the pinnacle of architectural aesthetics. Not only is the city both a showcase and a testing bed of modern
architectural innovations, but it is also a museum in its own
right with an ever-growing collection of carefully preserved
architectural artifacts from the past.
The reputation of the city as the capital of modern architecture
still remains intact thanks to the continued influx of
skyline-al-tering developments. The year 2018, marked the highest con-struction spending New York has ever witnessed in its history. The highlight among the developments was the growth in the number of buildings designed by internationally renowned architects. In 2014, more than 50 buildings designed by the so-called star-architects were to break ground in Manhattan alone. The ambitious developments are mostly upon com-pletion in 2019 and some are already available for sale in the market.
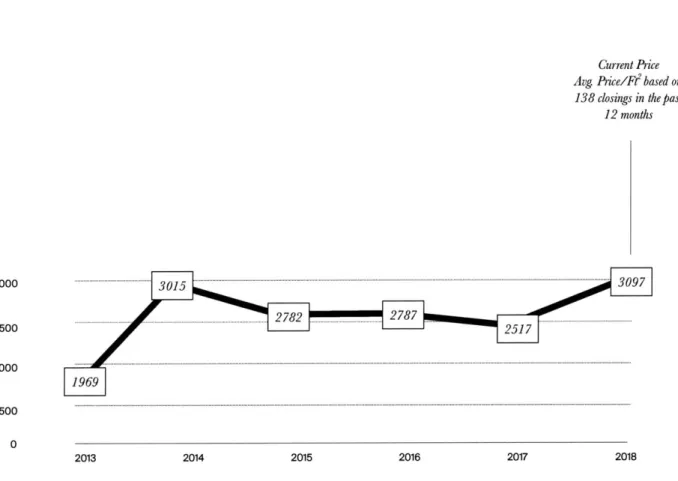
WHY (STILU NEW YORK: BIG APPLE, BIG DATA
Current Price
Avg. Price/Ft2 based on
138 closings in the past
12 months 3000 2500 2000 1500 2013 2014 2015 2016 2017 2018
Figure 2 -Star-Architect Condo Price Change Summary During Past Five Years Shown by Median Price
FIGURE 2.
Note:
Condominiums designed by internationally renown architects maks the hhest price per SFin New ork Source: CiyRealy Starchitect Condo Index (https://wwwci!Yreal!Y.com/ nyc/building-indices/starchitect-con-dos/building-list/1 12)Amongst various building types, especially pronounced was the sales premium associated with the new supply of Man-hattan's luxury condominiums designed by renown architects. According to the sales data provided by CityRealty, a New York based real estate brokerage and consultant firm, as of June 2018, buyers of the condominiums designed by Pritzker prize laureates paid an average $3,126 per square foot, higher than prices in indices such as The CityRealty 100 (at $2,477
per square foot), a sales data covering every sale in the past
10 years for 100 of Manhattan's most expensive condominium
buildings.
0
.... 2 7 8 2 ... ... . 2 7 8 7 ...
2517
WHY (STILL) NEW YORK: BIG APPLE, BIG DATA
=Follow
"In God we trust. Everyone else bring data."
linkd.in/1
kf4xrQ
7:20 AM - 12 Mar 2014
116 Retweets SOUkes
,**'
~@@@@
Q 10 L-1 116 Q 80
Image 2 -Previous Mayor of NYC, Michael Bloomberg's Tweet Regarding New York City Open Data Law
IMAGE 2.
Source: Twitter https://twittet:com/ mikebloomberg/status/ 443753465488367617?lang=en
W
OpenData
Analytics
MWC
Tdmdsfn&1%.A
-,
In addition to the rich history of the city and the current
build-ing boom, the immense data on the built environment that is available today makes New York the ideal city for this research. The continuing effort to open the city's database encouraged and boosted researchers to better understand the built envi-ronment, as demonstrated in "Open Data Law", NYC's recent endeavor to consolidate all public data into a single, easily-ac-cessible platform. The database and the advanced data pro-cessing technology available today is opening a new horizon in understanding the price dynamics of the building industry in any given time
m
13
Mike Bloomberg
0
WHY NOW: CURRENT CLIMATE OF
DESIGN IN THE BUILT ENVIRONMENT
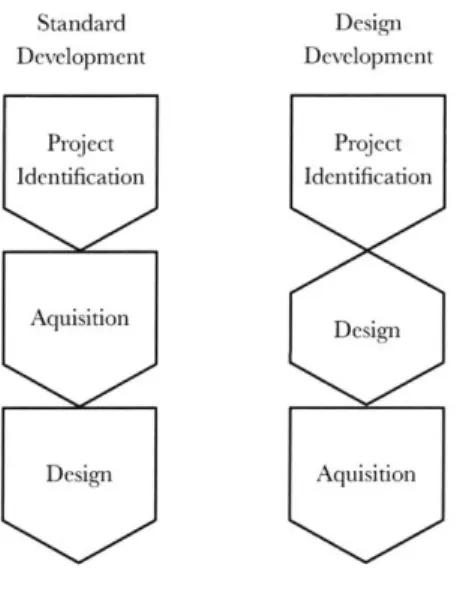
Standard Development Process Project Identification Aquisition
[
Due Diligence[
Permitting IConcept Design Phase Market Study
Site Analysis Massing Studs Concept Prop sAl Concept Plan &
Sectiun
Suggestive Views RederinigsSchematic Design
(SD)
Phase Civil Site PlanBuilding Floor Plans Roof Plan Conceptual Details Structural & MEP
Code Analysis
Design Development (DD) Phase
Site Plans Building Elevations Site Sections Building and Wall Sections Typical Design Details Landscaping Plan Code Analysis Plan Details Architectural Floor Plans & Elevations Interior Elevations Reflected Ceiling Plans Schedules
Construction Documentation (CD) Phase
Overall Detail Requirements for Construction of the Project
Construction
WHY NOW: CURRENT CLIMATE OF DESIGN IN THE BUILT ENVIRONMENT Standard Development Project Identification Aquisition Design Design Development Project Identification Design Aquisition
Strength of engaging Design in the acquisition process:
-Lowers risk by identifying project's spatial Ieasihility
-Improves financial underwriting by providing floor area
information with better accuracy
-Creative solutions for unconventionaly shaped land plots
Figure 4 -Standard Real Estat Development Process Compared with Design Development Process
FIGURE 3.
Note: Diagram showing the relation-ship between the standard real estate development process and its overlap with standard desn process.
FIGURE 4.
Note: The desin development model allows thefirm to closely manage design to maximize its potential value.
In recent years, there was a surge of interest in the subject of
design from multiple areas of the building industry. Design has
become one of the most important amenities for real estate
developers. A growing number of design development com-panies are being established in the major gateway cities such as New York and San Francisco, with a mission to create bet-ter development through design and ultimately to differentiate themselves from competitors. The two noticeable strategies for developers approaching design are either by working with
famous architects or by creating an in-house design team
to initiate and manage design in the closest manner. Hiring renown architects are not something new however, the latter model is a newly growing trend in New York.
WHY NOW: CURRENT CLIMATE OF DESIGN IN THE BUILT ENVIRONMENT
ARCH
I
EVI
MORTAR I
Mortar Arch + Dev(2003) Founder (Architecture & Development)
Alloy
ALLOY Development LLC (2006) CEO Chairman (Architecture) , -(Finance) S I President(Architecture
& Constniction)oloo-0
DDG Partners (2009) CEO President (Finance) 0 iDevelopmiemCOO Chief Crnativr
Oti:er
(Developmien & CCO.AAr hitecur, Financme.
Figure 5 -Desgin Devclopmcnt Companies in New York
FIGURE
5.
Note: The diagram shows the inter-disciplinary management structure of design development companies in
New
York Ci.
The real estate development industry is actively re-inventing their relationship with design. The two most well known design development companies in New York are Alloy Development and ddg, established in 2006 and 2009 respectively, have architects as owners/partners of the business. Similar to the role of creative directors in the fashion industry, they take charge in managing the design from its inception to comple-tion on behalf of the development company's interest.
WHY NOW: CURRENT CLIMATE OF DESIGN IN THE BUILT ENVIRONMENT
Image 3 -
Nickinscy
Quartcrly Rcport, 2018. The Business Value of DesignIMAGE 3.
Source: https://www.mckinsey.com/ businessfunctions/mckinsey-design/ our-insights/the-business-value-of design
Design is no longer a foreign concept for the investors as well. Investors have been witnessing the appreciation of de-sign from the market and how that translates into additional profit for their investment. Since 1982, few academic studies from real estate finance and economics have attempted to uncover the investment premiums related with well-designed buildings. There are some differences in the subject market, building product, and the methods used to measure the value of design, however, the results unequivocally show on average 20% sales premium for well-designed buildings.
WHY NOW: CURRENT CLIMATE OF DESIGN IN THE BUILT ENVIRONMENT 0 .. . . . . . . - -
.
...
-W
... ... -.. .-... - -...- --... ......-
...
...-..
...
...
..
...
--......
...-
...-
...
....
-......
...
..
...- -... -.....
...
....-.....
..-...
-.....
...
.0 56,800T
48,900 41,900 3 6 ,50 0
... ... ... 1993 1996 1999 2002 2005 73400 75,000 -- 76,700 ....
...
...
..
.
...
...
....
...
...
...-.
.
2008F7~7J1
.
6% 5% 4% 3% 2% 1% 0% 2011 2013 2015Figure 6 -Average Coinpe sation fir All Architectural Staf Postitions ovcr T1mw 1in 2015 Dollar.
FIGURE
6.
Note:
According to the 2015 ALA Compensation Survey the average compensationfor architectural staff positions is still recoveringfrom the Great Recession. The report, found that average compensationfor staffpositions rose 3.5 percent since early 2013 (or1.75 percent peryear). This growth
is upfrom the Great Recession, during which annual compensation increased an average of less than
1
percent, but moderate compared to the past two decades, when annual compensation in-creases ranged between 4 and 5percent. Source: ALA Compensation Report 2015Architects, on the other hand, have been riding the waves of
change. Design is no longer the sole realm of architects.
To-day, design is multi-faceted, highly specialized, and interdisci-plinary. So architectural work requires a creative manipulation of specialized design developed by a socially diverse group of experts to deliver the job that once was done by architects. In-creasingly architectural work is distributed and dispersed, col-laborative and entrepreneurial, knowledge-based and
open-sourced. (Peggy Deamer, 2014)
The growing diversity of the work, however, doesn't seem to be contributing to the growth of its market size. According to a survey done by Building Design Magazine, architects' earn-ings have steadily deteriorated by 30% since 2008. While the result can be interpreted as an influence of the global financial crisis, previous periods show that fees rarely return to their pre-recession levels. (Charles Holland, 2014)
On the other side of the spectrum, there is a widely accept-ed notion that well-designaccept-ed space adds more value to the built environment. Sadly, there isn't much public discourse beyond the point; the talk always seems to pivot between the exorbitant price of real estate market and the fetishistic con-sumption of the character of few architects that has reached 120K 100K 80K 60K 40K 20K 0
-WHY NOW: CURRENT CLIMATE OF DESIGN IN THE BUILT ENVIRONMENT
FINANCIAL
TIMES
Age
o(Lhe
\Lardiect'Did Ariana Grande just drop $16M on a condo in Zaha Hadid's Chelsea building?
POSlEDONWNED JUNE20, 2018 BY AI88E
tobeHrbpk . .
Another Soaring Starchitect Tower
Ascends Over Revitalized
Downtown Manhattan
Keith Flamer Oue tth R
it It t ,
po utr
I nh d Iuxy/hu c'
Figure 7 - Media
Outlet
on the Rise of DesignFIGURE 7.
Alote: The media often associates design with an emphasis on the celebrity status and the iconiciy of the structure.
TOP IMAGE Sources: https://www.ft.com/content/ d064d57c-dV1-11e6-86ac-]253d-b7791c6 MIDDLE IMAGE https://www.6sqft.com/did-ariana- grande-just-drop-I6m-on-a-condo-in-zaha-hadids-chelsea-building/ BOTTOM IMAGE
https://www.forbes.com/sites/
keithflamer/2017/09/30/an- other-soaring-starchitect-tower-as- cends-over-revitalized-downtown-man-hattan/#184535e74b33a pseudo-celebrity status. The popular terminology
'star-ar-chitect' or 'starchitectecture' (Foster 2008; Barbas, Delautre,
and Oakman 2015; Ponzini 2016) well represents the general public's conception of the subject. The terminology associ-ates design with an emphasis on the celebrity status and the
iconicity
of the structure. While the implication of the terminol-ogy is indeed one aspect of design, it also demonstrates thelimited outlook on the current climate of design.
Design has been clearly a subject of growing interest from different industries that define the built environment. However, design is represented and valued differently across the indus-try. As the findings show above, the subject has been adapted and absorbed by different entities, each of them creating its own cluster of understanding and usage with very few
over-laps. As the innovation theory proves, the innovation, in this
context design, should be widely adopted in order to self-sus-tain since the lack of agency of the subject often leads to de-terioration (Everett Rogers, 1962). With New York experiencing its biggest building boom of the century, a collective effort
towards creating a common ground to nurture a more
collab-orative future for design is imminent. As a contribution, our research focuses on identifying and bridging the gap between money and design
m
MONEY AND DESIGN: HOW FINANCE,
ECONOMICS DEFINE DESIGN
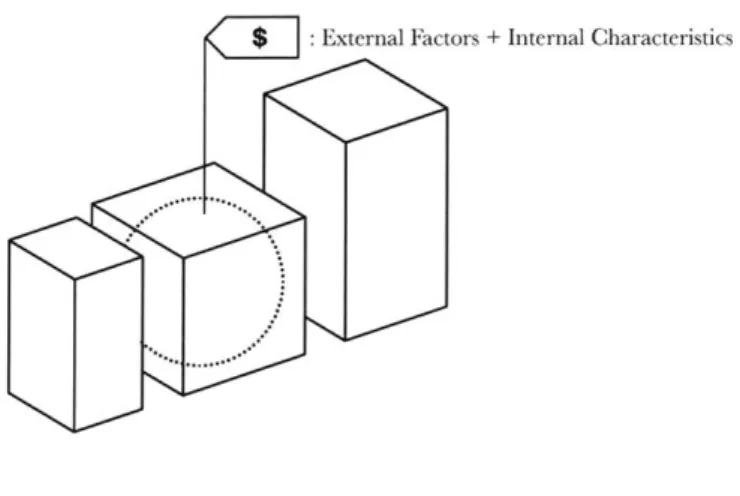
$
: External Factors + Intcrnal Characteristics: Exteriial Factors
--- . : Internal Characteristics
The Hedonic Pricing Method is ain asset
pricing method that starts from the premise that the price of a property is determined both by internal characteristics and external factors that affect the property's transaction price.
External Factors: Location, Transaction
Time, Building Age, Size, Parcel Area, LEED Status, etc.
Internal Characteristics: Building
Ame-nities, Mechanical, Electrical, and Plumbing (MEP) Quality, Building Occupants Use, etc.
MONEY AND DESIGN: HOW FINANCE, ECONOMICS DEFINE DESIGN
Due to the immense data collected on the US commercial real estate market, nowadays at any given time we can analyze and understand the commercial real estate price dynamics and can predict future trends with improved accuracy. Two of the main analysis techniques that are often used in this area are the Repeat Sales Index Method and the Hedonic Pricing Method.
The Repeat Sales Index Method calculates changes in the sales price of the same piece of real estate over a specific period of time. By definition, this method can reflect the mar-ket conditions in any given period (Geltner & Fisher, 2007) and its strength lies on the ability to reflect the capital gains or depreciation in the market (Chegut, 2013). However, since the methodology is based on available appraisal information and needs a set of properties of repeated sales, a significant amount of time is required to achieve a matured and reliable dataset. Due to this drawback this methodology is not capable of capturing the innovations that are occurring in the market and therefore is not considered to be an appropriate method-ology for the purpose of this study.
On the other hand, the Hedonic Pricing Method is a met-ro-level transaction based index. It is an asset pricing method that starts from the premise that the price of a property is determined both by internal characteristics of the property and the external factors that affect the property's transaction price. Examples of external factors are location, time, age, area of the building, and the internal characteristics are build-ing amenities, operation systems, LEED certification that are offered by the building. Different from the Repeated Sales Index, Hedonic Pricing Methodology uses cross-sectional data and does not require repeated observations of the same
FIGURE 8.
Note: Visual interpretation of the Hedonic Pricing Model
MONEY AND DESIGN: HOW FINANCE, ECONOMICS DEFINE DESIGN
Emporis is a real estate data mining company with specializing in high-rise and skyscrapers
Buildings in Manhattan Identified in Database Information on the Architect of building Design Architect of building Landscape Architect of building Interior Designer of building 83,301 buildings (100%) 7256 buildings (9% coverage) 146 buildings (0.
17%
coverage) 125 buildings (0.15%
coverage) 201 buildings (0.24% coverage)Figure 9-1 -Data Providers with Information on Architects
Note: Emporis and NYC DoB are the only two data providersfor information on architects, however; the
qualiy and the accessibiliy of the data are highly limited.
property. Due to this reason, the Hedonic approach is an ideal methodology to measure the innovations and technologies that are implemented in the current real estate marketplace. As one of the key aspects of innovation in the built environ-ment, the complex nature of design can be disentangled and measured by adopting the Hedonic Pricing Methodology. The inherent strength of the Hedonic analysis is that it is an extremely flexible approach that can yield credible results re-garding a wide range of subject matters. For instance, 'Loca-tion:' one of the external characteristic that is commonly used in real estate asset pricing studies, can be further studied by looking into related variables such as walk-scores; to mea-sure the walkability of the neighborhood, or building visibility scores; to measure the presence of the building compared to the surrounding context. Since, the two examples, walk-ability and the iconicity, are often elements that is frequently discussed and valued in the design process of the building, the results of the hedonic analysis may support or guide the designer's future work by providing numerical measurement on the performance related to the design decisions that were made in the past. However there is limited data on design.
So far we have identified largely two directions when
measur-ing the value of design from the academic literature of real
estate finance and economics. The two approaches are either
relying on peer recognition; taking the award-winning
build-ings and comparing with others to measure its transaction or
rental premium, or collaborating with a group of experts to ex-amine and evaluate the design of the building to understand the premium related to it. Given the extent of externalities and internalities generated by design, both approaches show lim-ited ability in explaining the value of design beyond the recognition of its associated premium.
MONEY AND DESIGN: HOW FINANCE, ECONOMICS DEFINE DESIGN
Buildings
The New York City Department of Buildings
" Enforces the city's building codes and
zoning regulations * Issues building permits
* The data base includes detail informa-tion regarding over 1,000,000 new and existing buildings.
d Currently the information on architects are only available upon request and per buildnig basis.
Figure 9-2 -Data Providers with Information on Architects
Note: Emporis and
NYC
DoB are the only two data providersfor information on architects, however, thequaliy and the accessibility of the data are highly limited.
The biggest challenge behind design studies is the general conception in the subject's elusiveness that subsequently lim-ited the measurement and availability of design related data. Surprisingly the most fundamental aspects of design are often
disregarded from both private and public data sources that
are frequently used when studying the built environment. For instance, the information on architects who are responsible
for the overall design quality of the building is often omitted. In
fact, Emporis and New York City Department of Buildings (DoB) are the only two sources of data among all the private and public data providers that include such information. Even with these two data providers, the quality and accessibility of the data are highly limited. The database of Emporis only includes data on the high rise buildings and the coverage is less than
10% of the buildings in Manhattan. On the other hand, since
one of the Department of Building's function is to issue build-ing permits, the information on architects should be available for every building that is built, however, such information is only available by request and by per building basis.
Using a compromised dataset can be particularly troublesome when analyzing the subject with the Hedonic Pricing Model since the result heavily relies on the quality and the quantity of the data that is used. Design influences both the external and internal characteristics of the building but so far only a handful
of measurements have been looked at. A better
understand-ing of the relationship between the quality of design and value
is needed since it could enhance communication between
the city, investors, developers, and architects, who frequently argue with their own set of assumptions about the relationship between the design, cost, and return n
STEPPING STONE
I
7''
er_,Kd) Zg
kbfV1&f
STEPPING STONE
"Design" is important in ways of affecting the current building industry, however, it is considered a difficult topic to discuss in the context of business decision making. Design still remains an elusive subject and has been studied very little in the con-text of economics and finance. The popular reason being the lack of consensus on the definition of "design" and its effect on hindering the measurement for its "value" (Vandell, 1989). Data empowers agency, however, there has been an absence of valid measuring systems to value the contribution of de-sign in the built environment. By utilizing the immense pool of data available today, our research aims to challenge this popular notion of design and to provide a missing link to help
understand the fuller picture of the current ecosystem of the
built environment. Hopefully, this research can be used as a
stepping stone for future studies to ultimately help create an
agency for design in the discussion of finance and economics
m
LEFr, IMAGE 4.
Michael Heizer, Slot Mass (section drawing),
1968-2017
18-ton rock and 2 steel earth liners depicted,
STUDYING THE VALUE OF DESIGN METHODS
The related academic papers that I have identified below are the attempts using the hedonic pricing method to under-stand design in the built environment. Largely two different approaches were found when understanding and measuring the effects of design on the value of the building. One set of papers examine the quality of design by associating it with the architect's achievement and the recognition of their peers by looking at a sample of buildings designed by architects who have won important architectural prizes (Hough and Kratz,
1982; Fuerst, McAllister, and Murray, 2010; Cheshire and Der-icks, 2014). The other approach chooses to conduct a survey by a group of experts to grade the overall design quality of the sample buildings. The experts score building elements such as facade fenestration, building material, massing composi-tion, etc. of the sample buildings and the overall design score of the building is derived by averaging the scores of each ele-ment (Vandell and Lane, 1989; Nase, Berry, and Adair, 2016). In 1982, Hough and Kratz in one of the earliest and most often cited academic papers examining the economics of architec-ture argued that commercial buildings in the central business district (CBD) of Chicago that have won a Chicago AIA Jury award outperformed in rents per square foot as high as 23% relative to the market for comparable buildings.
Another similar study was done in 2010. Fuerst, McAllister, and Murray conducted a national, rather than a city, level research focusing on buildings designed by Pritzker prize and/or AIA Gold medal winning architects in the USA. The results of the hedonic analysis also showed premiums that are 5%-7% higher in rents, and 17% higher sales prices in the buildings designed by the award-winning architects compared with oth-er buildings in the same submarket.
The premiums indicated in both of the studies were large enough to hint a strong relationship between the design qual-ity of the award-winning architects and the economic perfor-mance of the building. However, the study leaves a few unan-swered questions. First, the data does not integrate the cost of providing good design, i.e. construction and operation cost associated with the building's iconic structure and additional fee charges from hiring award-winning architects. Second, the data does not provide any indication on the different aspects of design and associates the value relying solely on the archi-tect's representation; as the production of design becomes more complex the delineation of the input of awarded archi-tect on the design becomes questionable. Third, the award criteria do not capture the current innovations of the industry since the type of awards that are considered in the study only represents the category of lifetime achievement awards which is based on the architect's work throughout their career with a threshold of at least 30 years of accumulated projects. Research done in 1990 by Vandell and Lane attempted to un-cover few of the missing links of the previous study by includ-ing the construction and operation costs into the framework of the regression analysis and by disentangling the multiple dimensions of design into categories such as, the decorative-ness of the fagade, color and texture of the surface material, quality of the surface material, and massing. 102 class-A commercial office buildings in Boston and Cambridge were evaluated by a group of architects accordingly and the results confirmed a strong influence of design on rents. Buildings that were rated in the top 20% for design quality were predict-ed to extract almost 22% higher rents than those ratpredict-ed in the bottom 20%. In contrast, the data showed a weak relationship between vacancy behavior and design quality. Finally, good
STUDYING THE VALUE OF DESIGN METHODS
D.E.Hough &C.G.Kratz, 1982 Can "Good" Architecture Meet the Market Test?
Data Recognized by "official" Criteria 139 Commercial Office build- Conclusion is $1.85 (or $1.64) per
authority LDMK & CAIA ing rents in Chicago CBD in 1978 square foot truly the value of "good"
20 buildings out of 139 new architecture? If so, at an average
rentable area of 844,000 square feet for post-1955 Chicago office buildings, the annual return to this attribute would be $1.6 million (or $1.4 million, using the $1.64 per square foot premium).
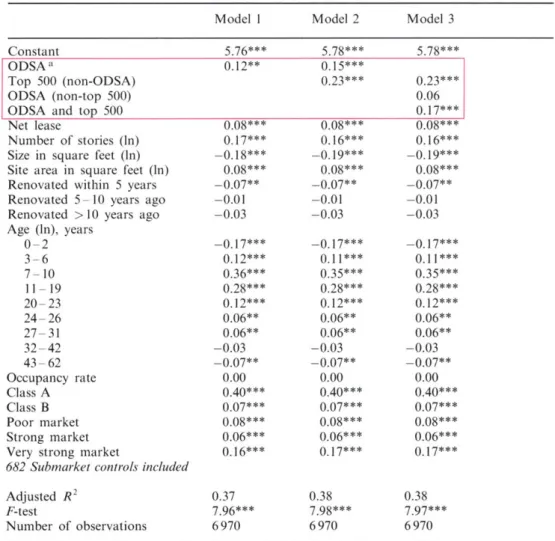
F.Fuerst, P.McAllister & C.B.Murray, 2010 Designer
Bulidings:
Estimating the economicvalue of 'signature'
architectureData CoStar US national database Criteria Pritzker Prize+AIA Gold Medal, Conclusion Compared with buildings for commercial office rental (16,932 499 buildings out of 16,932 in the same submarket, ODSAs have
buildnigs observed) & sales (9,418 rents that are 5% - 7% higher than
non-sales observed) in 682 submarket ODSAs and sell for prices 12% -17%
clusters higher. In other words, for the average
structure, movement into the next higher design quintile will increase rents from $2758/SF to $28.96SF.
K.D.Vandell & J.S.Lane, 1989 The Economics of Architecture and Urban Design
Data 102 Commercial Office Survey
criteria
Survey done by panel of Conclusion The coefficient forbuilding Rents and Vacancy architects. Examined in 4categories and DESIGN, although positive, is not
sig-rates in Boston, 1979 -1986 given overall rating. nificant. Consists with the notion that design does not necessarily have to
Categories Decorativeness of Facade, cost more to the extent that "overin-Color and texture of surface material, quality vestment" may contribute to negative of surface material, massing marginal returns to design.
I.Nase, J.Berry & A.Adair, 2016
Impact of
quality-led designon
real estate valueData 424 Condominium Criteria Survey done by group of local ex- Conclusion Empirical findings indicate
units in Belfast city center, perts.7 categories on
a
5-grade Likert scale. that from the seven building quality2000 -2008 features initially investigated, the ones
Categories Facade material, facade iden- mostly valued by end users are those tity, quality of material used, fenestration, that are easily perceived visually. massing, height in floors, building condition
Table
1 -
Design Value StudiesSTUDYING THE VALUE OF DESIGN METHODS
I
I
I
1. Examine the Quality of Design by Associating it with Architecture Awards
0 1 2 3 4 5
2. Scoring Process for Design Quality Variables ex) Massing, Fenestration, Material Quality, etc.
Figure 10 -
lypical
Methods Used to Measure the Efficts of Design on the Value of the Buildingdesign was shown to cost more to produce on average, but not necessarily in every case. The magnitude of the point esti-mates of the rent, vacancy, and construction cost effects sug-gest that good design may not, in fact, be more profitable on average, but as with a lottery, may provide a small probability of a high return to the developer.
A similar methodology was used to study the price premium
related with good design on the residential market by Nase, Berry, and Adair in 2016. The study combined the hedonic modeling approach paired with the spatiotemporal model to understand the impact of quality led design on the residential market in Belfast, Ireland. The research took transaction data of 424 condominium units and conducted a survey done by local experts. The survey included 7 categories on a 5-grade scale such as fagade material, fagade identity, quality of mate-rial used, fenestration, massing, the height of floors, and over-all building condition. The empirical findings indicate that from the 7 design characteristics examined, the ones most valued
by the home buyers are those that are most visible, i.e. the
appropriateness to the surroundings of a building's material quality, fenestration, and massing. The other design features namely fagade material, fagade identity, overall building condi-tion, and floor height were found to be statistically non-signifi-cant.
The scoring methodology that is used in the two studies are based on the assumption that the experts' opinions are
close-ly correlated with the judgment process in architectural design
practice, therefore, the estimated numerical value incorpo-rates the value of design with less error. However, the method inherits certain limitations. For example, the subjectivity of design may be amplified due to the small number of experts included in the group causing skewness or inconsistency in the resulting score data. In addition, the design elements in which the buildings are measured by are solely focusing on the exterior of the building which leaves out the quality of the interior space and the building's inner spatial relationship that is important for understanding the user's experience and the performance of the building.
STUDYING THE VALUE OF DESIGN METHODS
oon
on ArchitectsOur Rese
Figure 11 -
O
In line with the studies listed above, other studies find that certain architectural styles (Asabere, Hachey, and Grubaugh,
1989), features of exterior of the building (Moorhouse & Smith,
1994) and urban design features of the neighborhood (Song & Knaap, 2003) achieve rental and sales premium for the resi-dential market. The more recent studies that are currently un-dergoing in this area attempts to include daylight and views to understand the subject. These findings are informative for the current research since they demonstrate how the market, in general, values design in the context of the built environment. Our research differs from these previous studies. It focuses on different types of awards that can include a broader range of architects, it includes architecture firms as well as indi-vidual architects and further elaborates on the estimation by incorporating information on architects and architecture firms of every building in the data set. The data and methodology of this research are detailed below m
arch Approach
Reseacrh Approach
Z-FIGURE 10.
Note: The diagram illustrates the two popular study methodologies used in measuring the value of desgn.
FIGURE 11.
Note: The diagram illustrates our research approach, focusing on different types of awards and incorporates infor-mation on architects and architecture firms of every buliding in the data set.
STUDYING THE VALUE OF DESIGN METHODS D. E. Hough & C. G. Kratz, 1982
In 1982, Hough and Kratz in one of the earliest and most often cited academic papers
examin-ing the economics of architecture argued that commercial buildexamin-ings in the central business district
(CBD) of Chicago that have won a Chicago AIA
Jury
award out performed in rents per square
foot as high as
23%
relative to the market for comparable buildings.
TABLE
1
Summary of Results for Hedonic Price Equation Regressions for Downtown Office Buildings
Explanatory Linear Models Semilog Models
variables (1) (2) (3) (4) DISTCM -0.906 -0.809 -1.188 -1.176 (3.79) (3.81) (4.07) (4.45) DISTRR -0.218 - -0.158 -(0.81) (0.46) PUBPK
0.072
- 0.525 0.491 (0.31) (2.15) (2.11)AGE
-0.047
-0.046
-0.892
-0.899
(5.38) (5.35) (4.68) (4.78) GRSFLR0.000095
- 0.713 -(0.11) (0.53) RTAFL 0.015 0.015 0.392 1.055 (0.69) (1.57) (0.29) (4.24) NOPLRS 0.055 0.056 0.932 1.442 (2.01) (4.13) (0.69) (4.34) REST -0.518 - -0.481 -(1.27) (124) CONF 0.894 0.911 0.661 0.682 (2 29) (2.40) (1.79) (1.93) SNKSHP 0.181 - -0.199 -(0.44) (0.50) ELTRK -0.767 -0.894 -0.736 -0.941 (1.73) (2.30) (1.82) (2.46) LDMK -0.417 -0.304 -0.858 -0.811 (0.62) (0.46) (1.43) (1.38) CAIA 1.703 1701 1.928 1845 (2.84) (2.941 (3.62) (3.53) CONSTANT 10.722 10.049 4.188 4.588 R20
602 0.609 0.655 0.658F
17.05 27.83 21 20 30.50Note: Dependent variable is average annual rent per square foot; absolute
t-statistics
in parentheses; in semilog models, all explanatory variables are in
natural logs, except REST, CONF,SNKSHP,
ELTRK LDMK, and CAIA.STUDYING THE VALUE OF DESIGN METHODS D. E. Hough & C. G. Kratz, 1982
Can "Good" Architecture Meet the Market Test?
A considerable rent premium is paid for "good" new architecture but not for "good" old
architec-ture. Chicago AIA award increases the annual rent about $1.85/SF, however Land Mark status
decreases the annual rent about $0.81/SE (D.E.Hough & C.G.Kratz, 1982)
-1 -0.5
LANDMARK STATUS
-0.81/SF***
0
0.5
1 1.5 2 ($/SF)CHICAGO AlA AWARD
$ 1.85/SF *"
SIGNIFICANCE**
Asterisks in a regression table Indicate the level of the statistical significance of a regression coefficient.
*** P<0.01, ** P<0.05, * p<0.1
COEFFICIENT% The standard
error is our estimate of the standard deviation of the coefficient.
STUDYING THE VALUE OF DESIGN METHODS
F.Fuerst, P. McAllister, & C. B. Murray, 2010
Another study done in 2010 by Fuerst, McAllister, and Murray conducted a national, rather than
city, level research focusing on buildings designed by Pritzker prize and/or AIA Gold medal
win-ning architects in the USA. The results of the hedonic analysis also showed premiums that are
5%-7% higher in rents, and 17% higher sales prices in the buildings designed by the award
win-ning architects compared with other buildings in the same submarket.
Table 3. Results from hedonic estimation of sale prices. Dependent variable is natural log of the sale price ($ per square foot).
Model I Model 2 Model 3
Constant 5.76*** 5.78*** 5.78***
ODSA a
0.12**
0.15***
Top 500 (non-ODSA)
0.23***
0.23***
ODSA (non-top 500)
0.06
ODSA
and top 5000.17***
Net lease
0.08***
0.08***0.08***
Number of stories (ln) 0.17*** 0.16*** 0.16***
Size in square feet (ln) -0.18*** -0.19*** -0.19***
Site area in square feet (ln) 0.08*** 0.08*** 0.08***
Renovated within 5 years -0.07** -0.07** -0.07**
Renovated 5-10 years ago -0.01 -0.01 -0.01
Renovated >10 years ago -0.03 -0.03 -0.03
Age (ln), years 0-2 -0.17*** -0.17*** -0.17*** 3-6 0.12*** 0.1l***
0.11***
7- 10 0.36***0.35***
0.35***
11-19 0.28*** 0.28***0.28***
20-23 0.12*** 0.12*** 0.12*** 24-26 0.06** 0.06** 0.06** 27-31 0.06** 0.06** 0.06** 32-42 -0.03 -0.03 -0.03 43-62 -0.07** -0.07** -0.07** Occupancy rate 0.00 0.00 0.00 Class A 0.40*** 0.40*** 0.40*** Class B 0.07*** 0.07*** 0.07*** Poor market 0.08*** 0.08*** 0.08*** Strong market 0.06*** 0.06*** 0.06***Very strong market 0.16*** 0.17*** 0.17***
682 Submarket controls included
Adjusted R2 0.37 0.38 0.38
F-test 7.96*** 7.98*** 7.97***
Number of observations 6970 6970 6970
***Significant at 1% level; ** significant at 5% level; * significant at 10% level.
STUDYING THE VALUE OF DESIGN METHODS
F.Fuerst, P. McAllister, & C. B. Murray, 2010
What is the economic value of 'signature'
architecture?
Compared with buildings in the same submarket, Office Designed by Signature Architects have
rents that are 5%
- 7%
higher than Office Designed by Non-Signature Architects and sell for
prices 12%
-
17% higher. (E Fuerst, P. McAllister & C. B. Murray, 2010)
0(%) 2 4 6 8 10 12 Rent Premium 6% ** 14 16 Transaction Price Premium
14.5/
*** SIGNIFICANCE***Asterisks in a regression table indicate the level of the statistical significance of a regression coefficient.
* p<0.01, * p<0.05, * p<0.1
COEFFICIENT % The standard
error is our estimate of the standard deviation of the coefficient.
STUDYING THE VALUE OF DESIGN METHODS
K. D. Vandell &J. S. Lane, 1989
A research done in 1990 by Vandell and Lane included the construction and operation costs into
the framework of the regression analysis and by disentangling the multiple dimensions of design
into categories such as, the decorativeness of the fagade, color and texture of the surface
materi-al, quality of the surface materimateri-al, and massing. 102 class-A commercial office buildings in Boston
and Cambridge were evaluated by a group of architects accordingly and the results confirmed a
strong influence of design on rents. Buildings that were rated in the top 20% for design quality
were predicted to extract almost 22% higher rents than those rated in the bottom 20%.
Determinants of Contract Rents and Vacancy Rates: Preferred OLS and
2SLS Specifications
Determinants of Contract Determinants of Vacancy
Rents Rates
Dependent Variable: Dependent Variable:
Independent Log(RFNT) Log(VAC + .005)
Variable OLS 2SLS OLS 2SLS
INTERCEPT 3.006" 2.960" 4.301 3.495
(.145) (.150) (5.662) (7.033)
AGE (LNAGEA' -. 00928" -. 00771* -. 6238** -. 62208
for Vac. Equ.) (.00242) (.00281) (.1532) (.1535)
TOTAREA 1.029 x 10-'* 1.105 x 10⁻⁷ (.572 x 10~) (.570 x 10~7)
LNT
OFLRS .089* .0890" - -(.0410) (.0405) DESIGN .0459 .0488" -. 4650 --. 4923 (.0288) (.0286) (.5485) (.5670) CE NTER -.000006020
-. 000006280 - -(.00000328) (.00000325) TSTOP .0000537 .0000663* -. 000780 -.000767 (.0000322) (.0000339) (.000474) (.000488) PARKING .00000404 .00000441 - -(.00001766) (.00001745) ONPARK -. 1032 -.0996 (.0667) (.0660) LNVACA, LNVACAPb .00151 .0178 --(.00698) (.0167) LNRENT, LNRENTPc - - .2943 -.0357 (1.7285) (2.1975) kz .6401 .6486 .2161 .2157 N 55 55 55 55 DEP MEAN 3.317 3.317 .5319 .5319 F-VALUE 11.673' 12.077" 4.722" 4.713" aLNAGEA = Log(AGE - .005)"LNVACA = Log(VAC + .005); LNVACAP Predicted Log(VAC - .005) from first stage
OLNRENT - Log(RENT); LNRENTP = Predicted Log(RENT) from first stage 'significant at 10% level
"significant at 5% level
STUDYING THE VALUE OF DESIGN METHODS K. D. Vandell & J. S. Lane, 1989
Does well designed buildings rentfor more?
For the average structure, 5.
0% increase in rents with every increase of one in the design rating.
In other words, movement into the next higher design quintile will increase rents from $27.58/SF
to $28.96SE (K.D.Vandell &J.S.Lane, 1989)
Does good design result in lower vacancy?
Insignificant, though consistently negative as expected and always with in the narrow range -.4003
to -.5127 in all specifications. This suggests that, at the mean, an increase of one quintile in
de-sign quality would decrease the vacancy rate from 1.7% to 1.0%. (K.D.Vandell &J.S.Lane, 1989)
0 (%) 1 -i 2 3 4 5 6 Rent Premium 5% ** Vacancy Rate
1.35%
SIGNIFICANCE*Asterisks in a regression table indicate the level of the statistical significance of a regression coefficient.
COEFFICIENT % The standard
error is our estimate of the standard deviation of the coefficient.
STUDYING THE VALUE OF DESIGN METHODS
I.Nase, J.Berry & A.Adair, 2016
The study done by Nase, Berry, and Adair in 2016, combined the hedonic modeling approach
paired with the spatiotemporal model to understand the impact of quality led design on the
resi-dential market in Belfast, Ireland. The research took transaction data of 424 condominium units
and conducted a survey done by local experts. The survey included 7 categories on a 5-grade
scale such as fagade material, fagade identity, quality of material used, fenestration, massing, the
height of floors, and overall building condition. The empirical findings indicate that from the
7
design characteristics examined, the ones most valued by the home buyers are those that are most
visible, i.e. the appropriateness to the surroundings of a building's material quality, fenestration,
and massing. The other design features namely fagade material, fagade identity, overall building
condition, and floor height were found to be statistically non-significant.
Table 2. Hedonic and spatial model comparisons.
Variable Model
1
Hedonic (OLS) Model 2 SEM (ML) Model 3 SAR (ML)Constant 1.5332 (1.8328) 3.0714** (3.4862) -1.4176 (-1.6753) Age -0.1312* (-2.3588) -0.1644** (-3.0613) -0.1241* (-2.4979) Area 0.9155* (12.6764)
0.8427**
(12.3922) 0.8054** (12.1854) Garage 0.1761* (3.6562) 0.1930** (4.4050) 0.2111** (4.8876) Bedrooms -0.0108 (-0.4963) -0.0016 (-0.0774) 0.0083 (0.4216) Receproom 0.1357 (1.7292) 0.1741* (2.4100) 0.1682* (2.3957) Floorno0.0594**
(3.8029) 0.0429* (2.8552) 0.0343* (2.3914) Finishing 0.0823** (2.9538) 0.0529 (1.9259) 0.0432 (1.7071) Identity 0.1172** (3.0372) 0.0817* (2.1308) 0.0447 (1.2421) Materialqual 0.3195** (9.7516) 0.2394** (6.1798) 0.1749** (5.0190) Fenestration 0.1102** (3.0104) 0.1102** (3.1965) 0.0909** (2.7652) Massing 0.0724** (3.5583) 0.0675** (3.4033) 0.0769** (4.2348) Height 0.0328 (1.3987) 0.0140 (0.5887) 0.0079 (0.3748) Condition 0.0214 (0.6128) 0.0293 (0.8707) 0.0312 (1.0008) Connect 0.0681** (2.9810) 0.0574* (2.5617) 0.0654** (3.2051) BpR 0.0102** (5.7598)0.0077**
(4.4278) 0.0067** (4.0656) Attindex -0.0392** (-2.7200) -0.0408** (-2.8341) -0.0471** (-3.6494) Dgreen -0.0898** (-4.5197) -0.0807** (-4.0771) -0.0882** (-4.9730) NearST 0.0220* (2.5806) 0.0201* (2.1370) 0.0289** (3.7711) PWdist 0.0757** (7.6161)0.0647**
(6.4809) 0.0566** (6.1024) yr2002 -0.0058 (-0.1151) 0.0577 (0.4684) 0.0527 (1.1633) yr2003 0.1260* (2.5254) 0.1721 (1.4025) 0.1846** (4.1258) yr2004 0.0556 (1.1846) 0.0969 (0.8203) 0.1056* (2.5103) yr2005 0.1744** (3.2972) 0.2234 (1.6761) 0.1878** (3.9737) yr2006 0.4421 ** (8.7191)0.5057**
(4.1295) 0.3189** (6.4205) yr2007 0.6397** (11.9617) 0.6657** (5.3196) 0.4682** (8.5984) yr20080.4555**
(9.0797) 0.4825** (3.9844) 0.3387** (6.9931) Lambda (A) 0.6581** (8.9581) Rho (p) 0.4279** (7.5933) Sigma2 (02) 0.0210 0.0176 0.0167 R2 0.8494 0.8634 0.8706 Log-likelihood 18.9413 218.4580 231.9330 N 373 373 373STUDYING THE VALUE OF DESIGN METHODS
I.Nase, J.Berry & A.Adair, 2016
What is the impact of quality led designfor real estate value?
Empirical findings indicate that from the seven building quality features initially investigated, the
ones mostly valued by end users are those that are easily perceived visually. (I.Nase,J.Berry &
A.Adair, 2016)
0
5 10 15 20 25 30 35 (%) Building condition 2.14% Height 3.28% Massing 7.24%* Finishing 8.23% * Fenestration 11.02% ** Identity11.72%*
SIGNIFICANCE *Asterisks in a regression table indicate the level of the statistical significance of a regression coefficient.
-I-p-I-COEFFICIENT % The standard error is our estimate of the standard deviation of the coefficient.
* p<0.01, * p<0.05, * p<0.1
Material quality
DATA
The commercial building transaction database used in this empirical study was obtained from the Wide Data Project of MIT Real Estate Innovation Lab, which is a combination of publicly available data from New York government entities, Real Capital Analytics (RCA), and Compstak data. The inte-grated database provides fundamental hedonic variables that we will be using.
Real Capital Analytics (RCA) is a private data provider special-izing in property transaction data based in New York City. The database collects data from a network of independent sourc-es with particular emphasis on the building transaction data that includes financing details, prior transaction history, and true owner identification to complete profiles. From this data-base, we use variables including the transaction price for each contract signed that becomes the dependent variable. The variables used in this study are Price, Submarket, Transaction Year, Built Year, Number of Floors, Building Area (SqFt), Land
Parcel Area, Renovation Year, Buyer Type, Seller Type, and Lender Type. This study uses RCA building transaction data as a primary database.
Compstak is a private commercial real estate data platform with offices in New York and Los Angeles. The data is crowd-sourced from verified and active professionals at commercial brokerages and appraisal firms and provides lease and sales comparable data. Compstak database contains variables that include lease contract characteristics, tenant profile, and mar-ket variables to name a few. From this database, we included a variable which is Building Class. The Building Class variable is an important variable used to control for the overall quality of the buildings in the sample dataset and is a variable that is only available in the Compstak data. We have assigned the building identification number (BIN) for each transaction ob-servation in RCA and matched with the Compstak data set for better accuracy.
DATA
~A
L
CAPITAL
R
.
ANALYTICS
Transactions. Trends. Tools.
+
e
COMPSTAK
+
Walk Score
PRIMARY DATABASE Variables in Use: Price Submarket Transaction Year Built Year Number of Floors Building Area (SqFt) Land Parcel Area Renovation Year Buyer Type Seller Type Lender Type ADDITIONAL DATABASE Variables in Use: Building Class
+
ADDITIONAL DATABASE Variables in Ue:Walk Score assigned to
every building in datrabase
DATA ON ARCHITECTS
The information on architects were manually gathered through multiple sources such as, firm portfolio website, media articles, and architectural magazines
Figure 12 -Data Structure
In addition, we have included a Walk Score variable using the data provided by Walkscore.com. The Walk Score is a metric created to measure the walkability of the neighborhood with a score range from 0 to 100. Neighborhoods with access to public transit, better commutes, and proximity to the people and places, achieve higher scores. For this study, we have matched the address of individual buildings observed in the building transaction sample dataset with the Walk Score pro-vided from the website
Finally, we have included the information on architects who designed the buildings in the integrated database. The infor-mation was gathered using multiple sources that include, the architect's web portfolio, architecture magazine, articles from various publications, and Wikipedia .
FIGURE 12.
Note: The diagram illustrates the data structure of this research.
IDENTIFYING AWARDED
ARCHITECTS AND FIRMS
Since the objective of this research is to understand the value of design through the contributions of renown architects and architecture firms, defining the significant architects and firms becomes the central issue for this research.
As the scale of the building grows and adds complexity to the project, the business management aspect of the architecture and design industry have continuously evolved. To prevent the knowledge loss and to secure the design quality of the company, architecture firms are creating a new management model that is in between the typical master and apprentice system and the hierarchical corporate management model (Booth, 2006).
To incorporate this recent trend, we have employed multiple types of awards that each has a significant difference in their evaluation criteria, but nevertheless carries similar weight in value among the industry. Largely three types of award groups are considered in this research.
The first group includes lifetime achievement awards that evaluate the architect's accumulated body of work throughout their career. The group includes: the RIBA Royal Gold Med-al, AIA Gold MedMed-al, the Pritzker Prize, the UIA Gold MedMed-al, and the Golden Lion for Lifetime Achievement Award. These awards are typically given to architects with more than 30
years of experience based on their lifetime contribution on expanding the knowledge of the industry. These awards are considered the highest recognition and considered to be the most influential in the architecture industry. The awards are given annually or biannually.
The second group incorporates awards that are given to the contemporary and innovative architects. The group includes: Cooper Hewitt National Design Award and the Wall Street Journal Innovation Awards in Architecture. These awards are given annually and a large part of the evaluation is based on the impact of the architect's project on the year the award is given. Due to this reason, the demographics of the past winners of these awards tend to be younger than the lifetime achievement award laureates.
The third award category is an attempt to recognize the col-laborative effort and the business management side of archi-tecture design by including the AIA Archiarchi-tecture Firm Award. The AIA Architecture Firm Award is a unique award since it recognizes the architecture firm that has produced a nota-ble architecture for at least a decade. The candidates of the award are any individual firms or successor firm or organiza-tion of architects whose home office is based in the US.


![Amplitude analysis of B[superscript +] →J/ψϕK[superscript +] decays](data:image/gif;base64,R0lGODlhAQABAIAAAP///wAAACH5BAEAAAAALAAAAAABAAEAAAICRAEAOw==)