HAL Id: inserm-00763468
https://www.hal.inserm.fr/inserm-00763468
Submitted on 10 Dec 2012
HAL is a multi-disciplinary open access
archive for the deposit and dissemination of
sci-entific research documents, whether they are
pub-lished or not. The documents may come from
teaching and research institutions in France or
abroad, or from public or private research centers.
L’archive ouverte pluridisciplinaire HAL, est
destinée au dépôt et à la diffusion de documents
scientifiques de niveau recherche, publiés ou non,
émanant des établissements d’enseignement et de
recherche français ou étrangers, des laboratoires
publics ou privés.
Moundou.
Ndeindo Ngangro, Doudeadoum Ngarhounoum, Mosurel Ngangro, Ngakoutou
Rangar, Mahinda Siriwardana, Virginie Des Fontaines, Pierre Chauvin
To cite this version:
Ndeindo Ngangro, Doudeadoum Ngarhounoum, Mosurel Ngangro, Ngakoutou Rangar, Mahinda
Siri-wardana, et al.. Pulmonary tuberculosis diagnostic delays in Chad: a multicenter, hospital-based
survey in Ndjamena and Moundou.. BMC Public Health, BioMed Central, 2012, 12 (1), pp.513.
�10.1186/1471-2458-12-513�. �inserm-00763468�
R E S E A R C H A R T I C L E
Open Access
Pulmonary tuberculosis diagnostic delays in Chad:
a multicenter, hospital-based survey in Ndjamena
and Moundou
Ndeindo Ndeikoundam Ngangro
1,2*, Doudeadoum Ngarhounoum
3, Mosurel N Ngangro
4, Ngakoutou Rangar
5,6,
Mahinda G Siriwardana
1, Virginie Halley des Fontaines
2and Pierre Chauvin
1,2Abstract
Background: Tuberculosis remains one of the leading causes of morbidity and mortality in low-resource countries. One contagious patient can infect 10 to 20 contacts in these settings. Delays in diagnosing TB therefore contribute to the spread of the disease and sustain the epidemic.
Objectives: The aim of this study was to assess delays in diagnosing tuberculosis and the factors associated with these delays in the public hospitals in Moundou and Ndjamena, Chad.
Methods: A structured questionnaire was administered to 286 new tuberculosis patients to evaluate patient delay (time from the onset of symptoms to the first formal or informal care), health-care system delay (time from the first health care to tuberculosis treatment) and total delay (sum of the patient and system delays). Logistic regression was used to identify risk factors associated with long diagnostic delays (defined as greater than the median). Results and discussion: The median [interquartile range] patient delay, system delay and total delay were 15 [7–30], 36 [19–65] and 57.5 [33–95] days, respectively. Low economic status (aOR [adjusted odds ratio] =2.38 [1.08-5.25]), not being referred to a health service (aOR = 1.75 [1.02- 3.02]) and a secondary level education (aOR = 0.33 [0.12-0.92]) were associated with a long patient delay. Risk factors for a long system delay were a low level of education (aOR = 4.71 [1.34-16.51]) and the belief that traditional medicine and informal care can cure TB (aOR = 5.46 [2.37-12.60]).
Conclusion: Targeted strengthening of the health-care system, including improving patient access, addressing deficiencies in health-related human resources, and improving laboratory networks and linkages as well as community mobilization will make for better outcomes in tuberculosis diagnosis.
Keywords: Tuberculosis, Delay, Diagnosis, Treatment Background
Tuberculosis (TB) is one of the leading causes of morbid-ity and mortalmorbid-ity: 9.2 million new cases of TB and 1.7 mil-lion deaths due to this disease were reported worldwide in 2007. The majority of these cases occurred in developing countries, particularly in Asia and Africa [1]. In limited-resource countries, one contagious patient can infect 10 to 20 people during the natural history of the disease [2]. Lin X et al. found that 30 days of infectious disease is enough
for the bacillus to pass from the index case to the house-hold members [3]. Consequently, any delay in the diagno-sis, care and treatment of TB patients not only exposes them to severe morbidity and a greater risk of mortality, but it also contributes to the spread of the epidemic [4-7]. Thus, one of the main goals of TB control programs should be the prompt diagnosis and treatment of TB patients.
TB is one of Chad’s major public health concerns [8]. In 2009, the prevalence of TB was 480/100,000 popula-tion, with an annual incidence estimated at 283/100,000 population and a specific mortality of 63/100,000 popu-lation [8]. The disease has been the target of a national * Correspondence:ndeindo.ndeikoundam_ngangro@etu.upmc.fr
1Inserm, UMRS, 707, Paris, France
2Université Pierre et Marie Curie-Paris6, UMRS, 707, Paris, France
Full list of author information is available at the end of the article
© 2012 Ndeikoundam Ngangro et al.; licensee BioMed Central Ltd. This is an Open Access article distributed under the terms of the Creative Commons Attribution License (http://creativecommons.org/licenses/by/2.0), which permits unrestricted use, distribution, and reproduction in any medium, provided the original work is properly cited.
control program since 1990, and the DOTS strategy was adopted in 1994. TB care and treatment are free in Chad. Patients with symptoms suggestive of TB are identified when they visit a first-level health service and are subse-quently referred to a hospital, where a diagnosis of TB can be confirmed. The main diagnostic tools used are the spu-tum smear test and chest radiography. When the diagnosis is confirmed, standard treatment regimens are prescribed in accordance with World Health Organization (WHO) recommendations.
A study conducted at a hospital in Ndjamena in 2003 determined the TB diagnostic delay to be 75 days. How-ever, the authors did not clearly distinguish between the patient delay and the health-care system delay [9]. The objectives of our study were to investigate pulmonary TB diagnostic delays and to identify factors associated with these delays in order to strengthen the TB prevention pro-gram. For the period from the onset of symptoms to the initiation of TB treatment, we sought to distinguish the “patient delay” (time to the first access to care, whether formal or informal) and the “health-care system delay” (time from the first access to care to the initiation of TB treatment).
Methods
Setting
A multicenter questionnaire-type survey was conducted from August to October 2009 in three hospitals, two of which are in the Chadian capital, which has the largest number of TB patients (the Hôpital Général de Référence de Ndjaména [HGRN] and the Hôpital de l’Union [HU]). Both serve mainly local and urban TB patients. The third hospital, Hôpital de Moundou (HM), is the regional hos-pital for the Western Logone region (440 km south of Ndjamena). Regular hospitals are designed to serve a population of 100,000 to 200,000, but referral hospitals have a population base larger than this. The population of Ndjamena is 833,531, and of the 650,000 inhabitants of Western Logone, 142,000 live in Moundou. Patients are supposed to visit a health center first. From there, under the referral system, the more severe cases are sent to dis-trict hospitals, then to regional hospitals and, lastly, to the HGRN.
Study population
Newly diagnosed cases of pulmonary TB aged 15 years or older were recruited consecutively and prospectively. The TB cases were classified according to the guidelines of the Chadian TB control program (WHO guidelines). Patients with other lung diseases or extrapulmonary TB, those who declined to give their consent and those who were too weak to answer the questionnaire were excluded from this study. Assuming a frequency of extended total delay of 60% among individuals exposed to a risk factor and of
40% among those not exposed, the study required a sam-ple size of least 225 patients.
Data
A semi-structured questionnaire was used to collect the data. It was translated into Arabic and Sara when neces-sary. The questionnaires were filled out by trained inter-viewers who conducted face-to-face interviews shortly after diagnosis. The patients’ medical records were cross-checked to confirm and complete the data.
The outcome variables were the patient delay (PD; defined as the time interval between the onset of a cough lasting more than 15 days and/or of major symptoms according to the national TB control program guidelines, i.e., night sweats, weight loss, fever and respiratory symp-toms− all the cases were reviewed by a pneumologist to date the onset of TB symptoms − and the first formal or informal health care received); the health-care system delay (HSD; defined as the time interval between the pre-viously mentioned care and the initiation of TB treat-ment); and the total delay (TD; defined as the sum of the patient and system delays). The delays were estimated in number of days. Delays were considered extended when they were longer than their respective median values.
The independent variables to be studied were chosen after an intensive literature review. They were the indivi-dual’s demographic and socioeconomic characteristics, such as gender, age (divided into five groups), rural resi-dency, defined as living outside the city (yes/no), health insurance status (yes/no), and level of education (in five groups of increasing numbers of years of education). Economic status was assessed by calculating a wealth score based on housing status, the construction quality of the dwelling, the sources of drinking water and elec-tricity, the type of sanitation, the ownership of certain items (such as a car, a motorbike, a bicycle, a refrigerator or a television) and the case’s occupational status. We also asked the patients how they would pay the add-itional expenses. The answers were grouped into five categories: the household’s savings, a loan, financial help from relatives or friends, selling his/her belongings, and earnings from continuing to work. We also asked the patients if one of their friends or relatives was a health-care worker (yes/no).
Three medical findings were considered as well: the presence of hemoptysis (yes/no), the result of the smear test (positive or negative) and the patient’s HIV sero-logical status (positive, negative, unknown).
Knowledge and attitudes concerning TB were assessed with questions regarding the cause of TB, its mode of transmission, its treatment, the link between TB and AIDS, and the primary care received.
Distance between the patient’s residence and the closest health facility was divided into three categories (≤ 1 km,
between 1 and 5 km, and ≥ 5 km). Lastly, whether or not the case had been referred to the hospital by a primary care facility was examined.
Statistical analysis
The distributions of the independent variables with the three different delays were compared using a chi-square test (or Fischer’s exact test where the numbers were small), and quantitative variables were compared using the (non-parametric) Wilcoxon test and the Kruskal and Wallis test. The associations between the ordinal variables (age and wealth score) and the outcomes of interest were assessed for trends. Next, since the delays differed according to the three hospitals, we performed bivariate analysis to make the same comparisons after adjusting for the study site and examined whether there were any interactions. Lastly, we included all the variables with a p-value ≤ 0.20 in bivariate analysis and selected them by backward analysis, fitting a logistic regression model for each delay separately. In multivariate analysis, the categories for knowledge of TB treatment were medical care, no response and other responses. The categories for the first health care received were formal (health center, hospital, pharmacist or private doctor) and informal (other responses), and the means for paying the additional expenses were classified according to the ability (savings, work) or inability (other responses) to pay. Epidata 3.1 software was used to build the database. Statistical analyses were performed with SAS 9.2.
Ethical issues
Since there is no ethics committee in Chad, research authorization was obtained from the Chadian Health Ministry. Each patient had been informed of the study’s objectives and his/her right to decline to participate. Verbal informed consent was obtained before every inter-view. No act that could harm the patients’ dignity or phys-ical integrity was committed during this study.
Results
Population characteristics
Two-hundred and eighty-six newly diagnosed patients were included in the analysis (Figure 1). They were mainly men (67.1%). The median age was 32 years, with less than a fourth of this population being over the age of 41. The education level was low: one-fifth of the population had no education, and only one-tenth of the patients had reached a postgraduate level. Only a minority (17.5%) of the patients lived in a rural area. The average size of the patients' households was 6.1 persons. Half of them were unemployed and had no income. More than 80% of the smear tests were positive. One-fifth of the patients were HIV-positive, and one-third of them had not been tested for HIV. Very few patients (13%) had health insurance, and more than half of them (60.4%) expected financial
help from their relatives. One-third of the patients sought treatment by visiting a hospital, 22% by buying drugs on the informal market, 21% by visiting a health center, 13% by using traditional medicine, less than 8% by consulting a private doctor, and 3.5% by consulting a pharmacist. Only 2.1% of them did not seek health care.
Comparison of the hospital populations
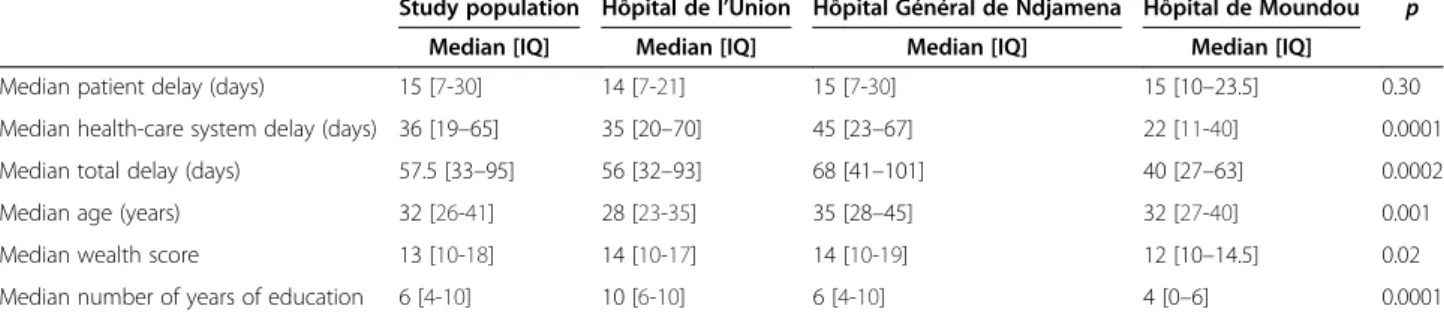
The patients at the HM and the HGRN seemed to be older than those at the HU (p≤0.001), and the patients at the HU were likely to be more educated (p < 0.0001) (Table 1). The wealth scores were higher for the HM and the HGRN than for the HU (p = 0.02). Unemployment also seemed to be more frequent for the HU than for the other two facilities (p < 0.01). There was a higher rate of HIV-positive serology for the HGRN (29.4%) than for the HM (20.3%) and the HU (5.8%), and the HIV serological status of more than half of the patients was unknown at the HU and the HM compared to only one-fifth at the HGRN (p < 0.0001). Because the HSD (p < 0.0001) and TD (p = 0.0002) were much longer for the HGRN, bivariate analysis was adjusted for the hospital.
Risk factors associated with an extended patient delay
Once adjusted for the study hospital (Table 2), protective factors were a higher level of education, having health in-surance, the belief that people hide their TB, having a health professional among one’s relatives, and the primary care having been obtained by consulting a pharmacist. On the other hand, an extended PD was associated with a re-mote community health facility, selling one’s belongings in order to pay the additional expenses, and not knowing how TB is transmitted. In multivariate analysis (Table 3), an extended PD was associated with a low wealth score, an intermediate education level, misconceptions about TB treatment, and having no referral to a hospital.
355 eligible patients
6.2% too weak to anwser 6.7% not found 3.1% declined 286 patients interviewed 298 patients recruited 4% questionnaires with inconsistent answers
Risk factors associated with an extended health-care system delay
In bivariate analysis, knowing that TB treatment is free and having received the primary care in a hospital were asso-ciated with a shorter HSD, while a low level of education, a low economic status, remote residence, living in a rural area, and the belief that traditional medicine can cure TB were associated with an extended HSD. In multivariate analysis, a low wealth score, having no knowledge about the correlation between AIDS and TB, a poor knowledge of TB treatment, and being treated at the HGRN were the three characteristics associated with an extended HSD.
Factors associated with an extended total delay
Univariate analysis (Table 4), showed that having health in-surance, unknown HIV serological status, knowing that TB treatment is free, and not knowing about the link between AIDS and TB were associated with a shorter TD. Living in a rural area, believing that traditional healing can cure TB and having started to undertake health care by using a traditional treatment appeared to be significantly asso-ciated with an extended TD. In multivariate regression analysis, a low economic status, the absence of hemoptysis, the belief in the efficacy of traditional and informal treat-ments, and being treated at either of Ndjamena’s hospitals were four characteristics associated with a longer TD. Discussion
This study reveals a long delay in TB diagnosis, with an HSD 2.4 times longer than the PD (Table 1). The results show that a low economic status, a low level of educa-tion and the belief in the efficacy of tradieduca-tional treat-ments were associated with extended diagnostic delays.
Patient delay, health-care system delay and total delay
Lin X et al. found that TB infection spreads in the index case’s household after 30 days [3]. Three-fourths of the patients in this study began their TB treatment at least 33 days after the onset of symptoms (Table 1). There-fore, the delays in diagnosing TB observed in this study are likely to be important in the spread of this disease.
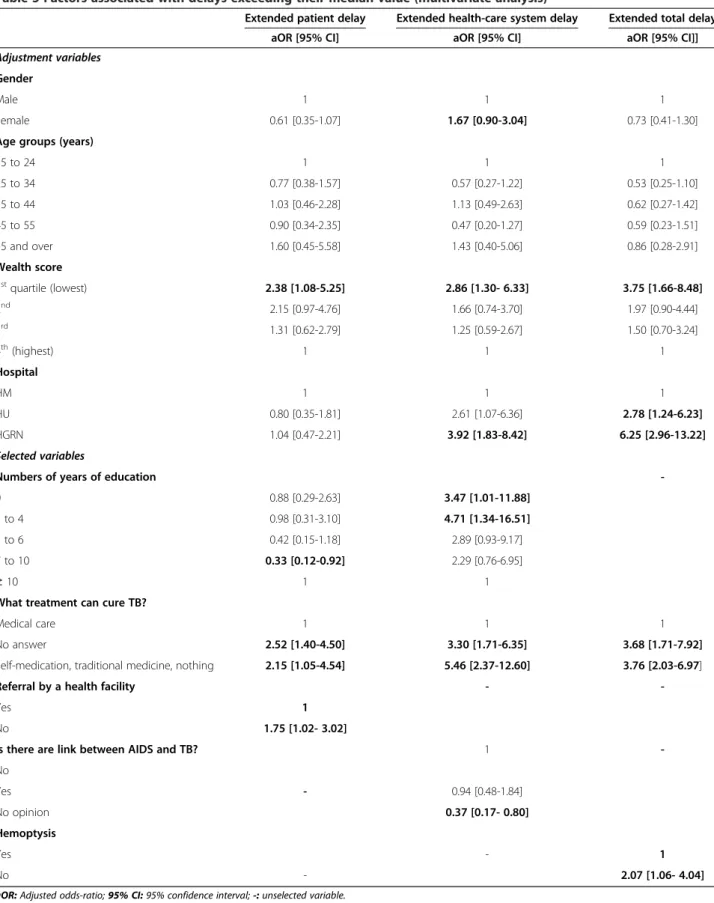
The median PD of 15 days is equal to the duration of a cough that should be considered suspicious for TB, accord-ing to the national program guidelines. The median HSD in this study is one of the longest observed, while the PD is one of the shortest compared to the findings in other set-tings (Table 5). This could be explained by the decision to include informal care in the definition of the primary care received by the patients in this study. Indeed, some authors consider the PD to be the time interval between the onset of symptoms and the first formal medical treatment received. Thus, the exclusion of informal and traditional health care from the definition of the primary care received seems to compound the patient’s role in the delay in TB diagnosis [6,7]. Therefore, the impact of informal care on the TD may be underestimated in resource-limited coun-tries. For example, we observed that more than half of the patients visited a conventional care provider first and that those with formal care trajectories were likely to be diag-nosed earlier. Therefore, traditional medicine and informal care should be considered part of the health-care system in studies conducted in developing countries.
Determinants of patient delay
Several studies have shown that the inability to pay for health care is a barrier to seeking it [10-12]. Surprisingly, this was also the finding in this study, even though TB treatment is free. Indeed, patients bear certain direct and indirect costs (drugs, consultations, investigations, trans-portation, lost days of work, etc.) from the onset of symp-toms to when TB is suspected. Although tests for TB are performed free of charge, patients still pay the rest of the expenses: food, transportation, lost income and so on. This prediagnostic cost can represent 7.1% of the median annual household income in Kenya, and patients may spend up to 125% of their monthly income to get a proper diagnosis in Ethiopia [13,14]. Mesfin et al found that spending time seeking care instead of earning money worsens TB patients’ financial burden and impoverishes their households [14]. This economic pressure may lead patients to delay their first visit to a doctor if the symp-toms appear to be mild.
Table 1 Characteristics of the study hospitals
Study population Hôpital de l’Union Hôpital Général de Ndjamena Hôpital de Moundou p
Median [IQ] Median [IQ] Median [IQ] Median [IQ]
Median patient delay (days) 15 [7-30] 14 [7-21] 15 [7-30] 15 [10–23.5] 0.30
Median health-care system delay (days) 36 [19–65] 35 [20–70] 45 [23–67] 22 [11-40] 0.0001
Median total delay (days) 57.5 [33–95] 56 [32–93] 68 [41–101] 40 [27–63] 0.0002
Median age (years) 32 [26-41] 28 [23-35] 35 [28–45] 32 [27-40] 0.001
Median wealth score 13 [10-18] 14 [10-17] 14 [10-19] 12 [10–14.5] 0.02
Median number of years of education 6 [4-10] 10 [6-10] 6 [4-10] 4 [0–6] 0.0001
Table 2 Factors associated with delays exceeding their median value (univariate analysis )
Size Median PD [IQ] Percentage of patients
≥the median PD
P Median HSD [IQ] Percentage of patient
≥the median HSD
P Median TD [IQ] Perecentage of patients ≥the median TD P Sociodemographic characteristics Gender Male 192 15.0 [9.0 – 30. 0] 58.3 0.03 35.0 [18.5-66.0] 48.4 0.31 61.5 [33.0 – 94.0] 52.6 0.26 Female 94 11.5 [7.0 – 30.0] 44.7 39.5 [21.0-65.0] 55.3 52.0 [34.0 -89.0] 44.7 Age groups (years) 15 to 24 60 14.0 [7.0 – 25.5] 48.3 0.42 45.0 [20.0 – 70.0] 58.3 0.08 65.5 [33.0 – 95.0] 56.7 0.31 25 to 34 103 15.0 [7.0 - 30.0] 50.5 31.0 [19.0 – 54.0] 40.8 49.0 [31.0 – 88.0] 42.7 35 to 44 67 15.0 [7.0 – 27.0] 55.2 44.0 [16.0 – 64.0] 55.2 57.0 [33.0 – 88.0] 49.3 45 to 55 37 15.0 [10.0 – 30.0] 62.2 35.0 [21.0 – 78.0] 48.7 63.0 [40.0 – 108.0] 54 55 and over 19 21.0 [10.0 – 60.0] 68.42 46.0 [20.0 – 65.0] 68.4 67.0 [45.0 – 109.0] 63.2 Wealth score 1stquartile (lowest) 78 15.0 [10.0 – 30.0] 61.5 0.10 49.0 [23.0 – 68.0] 60.3 0.26 71.0 [42.0 -115.0] 60.3 0.19 2nd 68 15.5 [7.0 – 30.0] 60.3 33.0 [18.0 – 59.0] 48.5 55.5 [37.5 – 88.0] 48.5 3rd 79 14.0 [7.0 – 24.0] 48.1 33.0 [18.0 – 60.0] 45.6 51.0 [30.0 – 90.0] 45.6 4th(highest) 61 14.0 [7.0 – 30.0] 44.3 35.0 [20.0 – 66.0] 47.5 48.0 [28.0 -88.0] 44.3 Numbers of years of education 0 58 17.0 [10.0 – 31.0] 66.7 0.005 42.0 [21.0 – 68.0] 51.9 0.07 64.5 [35.0 – 115.0] 55.6 0.42 1 to 4 43 15.0 [10.0 – 30.0] 67.4 42.0 [18.0 – 66.0] 60.5 61.0 [36.0 – 110.0] 53.5 5 to 6 77 15.0 [7.0 - 30.0] 52 45.0 [23.0 – 69.0] 55.8 64.0 [40.0 – 90.0] 54.6 7 to 10 87 13.0 [7.0 – 21.0] 39.1 35.0 [19.0 – 65.0] 48.3 50.0 [30.0 – 85.0] 44.8 ≥ 10 24 21.0 [12.0 – 30.0] 62.5 22.5 [14.5 – 39.0] 25 46.5 [31.5 -92.5] 37.5 Health insurance Yes 39 12.0 [7.0 – 30. 0] 35.9 0.02 26.0 [12.0 – 63.0 ] 35.9 0.06 37.0 [25.0 – 86.0] 33.3 0.04 No 247 15.0 [7.0 -30.0] 56.7 40.0 [20.0 – 66.0] 53 61.0 [36.0 – 95.0] 52.6 How the patients planned to pay the additional expenses Savings 51 14.0 [7.0 – 22.0] 71.4 0.01 38.0 [17.0 – 55.0] 57.1 0.38 56.0 [33.0 – 80.0] 71.4 0.8 Loan 7 30.0 [7.0 – 45.0] 45.1 43.0 [21.0 – 59.0] 51 73.0 [48.0 – 105.0] 49 Help from relatives 167 15.0 [7.0 – 30.0] 50.9 41.0 [19.0 – 67.0] 55.1 58.0 [33.0 – 95.0] 50.3 Working 28 15.0 [7.0 – 40.0] 60.7 35.0 [21.0 – 67.0] 35.7 54.5 [38.5 – 85.0] 46.4 Selling belongings 25 30.0 [17.0 -45.0] 84 29.0 [23.0 – 61.0] 44 68.0 [47.0 – 115.0] 56 Rural residence Yes 50 20.5 [10.0 – 45.0] 64 0.12 54.5 [23.0 – 100.0] 66 0.01 93.0 [48.0 – 123.0] 66 0.02 No 236 15.0 [7.0 – 30.0] 51.7 34.5 [19.0 – 60.0] 47.5 53.5 [32.5 – 88.0] 46.6
Table 2 Factors associated with delays exceeding their median value (univariate analysis ) (Continued) Clinical aspects Hemoptysis Yes 61 19.0 [10.0 – 30.0] 60.7 0.25 54.0 [26.0-72.0] 59 0.15 75.0 [39.0 – 113.0] 60.7 0.08 No 225 15.0 [7.0- 30.0] 52 35.0 [18.0 – 60.0] 48.4 55.0 [32.0 – 88.0] 47.1 HIV serological status Negative 118 14.0 [7.0 -30.0] 46.5 0.13 44.0 [21.0 – 71.0] 56.8 0.06 62.5 [36.0 – 105.0] 53.4 0.04 Positive 62 16.0 [9.0 -30.0] 62.9 41.5 [21.0 - 64.0] 54.8 66.5 [45.0 – 99.0] 59.7 Unknown 106 15.0 [7.0 – 30.0] 55.7 31.5 [14.0 – 60.0] 41.5 49.5 [30.0 – 83.0] 40.6 Do people hide their TB? Yes 224 14.0 [7.0 -30.0] 49.6 0.02 41.0 [20.0 – 66.0] 52.7 0.25 61.5 [33.0 – 92.0] 52.7 0.10 No 46 20.0 [10.0 – 30.0] 71.7 33.5 [19.0 – 66.0] 47.8 51.0 [37.0 – 108.0] 45.7
Did not know 16 18.5 [10.0 – 25.5] 62.5 17.5 [10.0 – 47.5] 31.3 46.5 [27.5 – 63.5] 25
Knowledge, attitudes and beliefs Knew what causes TB Yes 37 14.0 [7.0 – 30.0] 46 0.38 32.0 [17.0 71.0] 40.5 0.22 52.0 [36.0 – 99.0] 46 0.72 No 249 15.0 [7.0 – 30.0] 55 38.0 [20.0 – 64.0] 52.2 58.0 [33.0 – 93.0] 50.6 Knew how TB is transmitted Yes 58 9.5[7.0 – 21.0] 34.5 0.001 35 [20-65] 48.3 0.77 49.0 [30.0 – 78.0] 44.8 0.46 No 228 15.0[8.5 – 30.0] 58.8 36.5 [19-65.5] 51.3 59.5 [34.5 – 94.0] 51.3 Knew that TB treatment was free Yes 111 15.0 [7.0 – 25.0] 55 0.80 23.0 [12.0 – 51.0] 35.1 0.0003 45.0 [28.0 – 75.0] 37.8 0.002 No 175 15.0 [7.0- 30.0] 53.1 46.0 [25.0 – 69.0] 60.6 67.0 [39.0 -101.0] 57.7 Is there a link between AIDS and TB? Yes 102 14.0 [7.0 – 30.0] 47.1 0.18 35.0 [19.0 – 70.0] 49 0.04 52.5 [30.0 – 93.0] 49 0.04 No 98 15.0 [7.0 – 30.0] 60.20 44.5 [24.0 – 66.0] 60.2 69.5 [48.0 – 108.0] 59.2
Did not know 86 15.0 [10.0 – 21.0] 54.7 28.0 [15.0 – 51.0] 41.9 47.0 [31.0 – 73.0] 40.7
What treatment can cure TB? Self-medication 5 15.0 [15.0 – 20.0] 80 0.02 12.0 [10.0 – 30.0] 20 0.0001 30.0 [25.0 – 32.0] 20 0.0001 Medical care 120 10.0 [7.0 – 21.0] 40.8 25.5 [17.0 – 52.0] 37.5 45.0 [30.5 – 74.5] 35.8 No answer 114 18.0 [10.0 – 30.0] 63.2 38.0 [19.0 – 70.0] 53.5 63.5 [37.0 – 105.0] 55.3 Nothing 4 22.5 [11.0 – 30.0] 75 50.5 [27.0 – 63.0] 75 73.0 [38.0 -93.0] 50 Traditional medicine 43 15.0 [11.0 – 30.0] 60.5 57.0 [43.0 – 74.0] 81.4 75.0 [58.0 – 107.0] 79.1
The PD seems to decrease when the level of education increases [15]. A higher level of education may be asso-ciated with a better knowledge of TB and a better under-standing of the health-care system. Thus, more educated patients promptly consult a health professional shortly after the onset of symptoms. However, a higher level of education might also be associated with self-medication and the postponement of the first visit to a doctor.
Typically, patients with suspected TB would be seen in lower-level facilities and referred to the next level for fur-ther management. Thus, the referral system needs to be simple and efficient in order to reduce delays. When patients are not familiar with the referral system, they are likely to seek treatment outside the conventional services
or make multiple visits to the same lower-level facilities without progressing upward. In our study, referral was associated with a shorter PD, which is contrary to the find-ings of other studies, where referral was associated with a longer PD (more obvious symptoms of TB due to a delayed first visit to a doctor) [16]. Surprisingly, there were few referrals in our study, despite the fact that the entire study population consisted of TB cases. This may be a reflection of the poor case-detection skills of lower-level health-care providers.
Determinants of the health-care system delay
Similar to other studies which found that low income was associated with longer delays, we noted that low economic
Table 2 Factors associated with delays exceeding their median value (univariate analysis ) (Continued)
Access to and use of health services Referral by a health facility Yes 127 14.0 [7.0 – 30.0] 46.5 0.03 35.0 [19.0 – 64.0] 49.6 0.81 62.0 [35.0 – 91.0] 52 0.63 No 159 15.0 [8.0 – 30.0] 59.8 36.0 [19.0 – 66.0] 51.6 56.0 [30.0 -95.0] 48.4 Distance from home to the closest service ≤ 1km 146 14.0 [7.0 - 24.0] 48 0.01 35.0 [19.0 -65.0] 49.3 0.08 52.0 [34.0 -89.0] 46.6 0.14 1 to 5 km 109 15.0 [7.0 - 30.0] 55 35.0 [19.0 -61.0] 47.7 58.0 [30.0 – 90.0] 50.5 ≥ 5 km 30 30.0 [30.0 - 45.0] 80 55.0 [26.0 – 71.0] 70 89.0 [52.0 -115.0] 66.7 First health care received Self-medication 6 18 [14 – 35] 66.7 0.14 38.5 [33 – 43] 50 0.006 56.0 [45.0 – 75.0] 50 0.04 Health center 62 15.0 [7.0 – 30.0] 61.3 39.5 [19.0 – 66.0] 51.6 57.5 [33.0 – 93.0] 50 Hospital 78 15.0 [10.0 – 30.0] 61.5 20.5 [10.0 – 53.0] 32 40.5 [27.5 – 75.0] 38.5 Pharmacist 10 9.0 [7.0 – 14.0] 20 34.5 [19.0 -49.0] 40 43.0 [37.0 – 56.0] 20 Private doctor 23 14.0 [7.0 – 21.0] 39.1 35.0 [20.0 – 85.0] 47.8 61.0 [30.0 – 103.0] 52.2 No health care 6 30.0 [15.0 – 30.0] 83.3 48.0 [20.0 – 71.0] 50 63.5 [49.0 – 101.0] 50 Informal drug market 63 14.0 [7.0 – 30.0] 47.6 44.0 [23.0 – 69.0] 63.5 64.0 [37.0 -113.0] 54 Traditional medicine 38 14.0 [7.0 – 30.0] 47.4 54.0[34.0 – 81.0] 71 68.5 [50.0 – 110.0] 73.7 Knew a health professional Yes 101 14.0 [7.0 – 27.0] 42.6 0.006 43.0 [20.0 – 66.0] 56.4 0.17 63.0 [36.0 – 95.0] 55.5 0.22 No 185 15.0 [9.0 – 30.0] 60 34.0 [19.0 – 65.0] 47.6 56.0 [32.0 – 93.0] 47 Hospital HU 69 14.0 [7.0 – 21.0] 44.9 0.06 35.0 [20.0 -70.0] 49.3 0.0002 56 [32-93] 46.4 0.0001 HGRN 153 15.0 [7.0 – 30.0] 52.9 45.0 [23.0 -67.0] 60.1 68 [41-101] 60.8 HM 64 15.0 [10.0- 23.5] 65.5 22.0 [11.0 – 40.0] 29.7 40 [27-63] 28.1
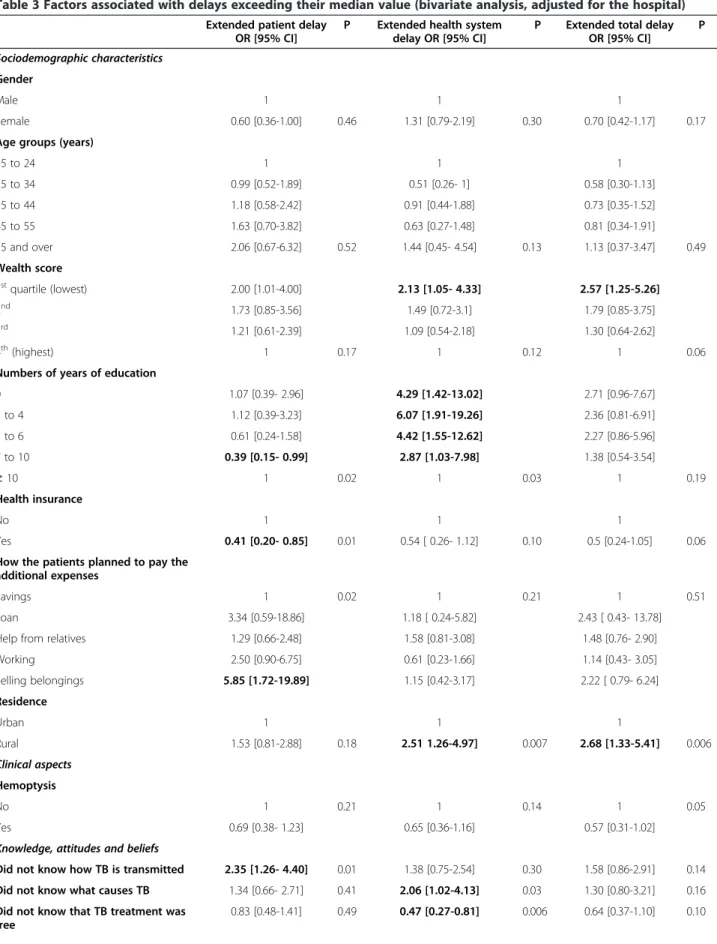
Table 3 Factors associated with delays exceeding their median value (bivariate analysis, adjusted for the hospital)
Extended patient delay OR [95% CI]
P Extended health system delay OR [95% CI]
P Extended total delay OR [95% CI] P Sociodemographic characteristics Gender Male 1 1 1 Female 0.60 [0.36-1.00] 0.46 1.31 [0.79-2.19] 0.30 0.70 [0.42-1.17] 0.17
Age groups (years)
15 to 24 1 1 1 25 to 34 0.99 [0.52-1.89] 0.51 [0.26- 1] 0.58 [0.30-1.13] 35 to 44 1.18 [0.58-2.42] 0.91 [0.44-1.88] 0.73 [0.35-1.52] 45 to 55 1.63 [0.70-3.82] 0.63 [0.27-1.48] 0.81 [0.34-1.91] 55 and over 2.06 [0.67-6.32] 0.52 1.44 [0.45- 4.54] 0.13 1.13 [0.37-3.47] 0.49 Wealth score 1stquartile (lowest) 2.00 [1.01-4.00] 2.13 [1.05- 4.33] 2.57 [1.25-5.26] 2nd 1.73 [0.85-3.56] 1.49 [0.72-3.1] 1.79 [0.85-3.75] 3rd 1.21 [0.61-2.39] 1.09 [0.54-2.18] 1.30 [0.64-2.62] 4th(highest) 1 0.17 1 0.12 1 0.06
Numbers of years of education
0 1.07 [0.39- 2.96] 4.29 [1.42-13.02] 2.71 [0.96-7.67] 1 to 4 1.12 [0.39-3.23] 6.07 [1.91-19.26] 2.36 [0.81-6.91] 5 to 6 0.61 [0.24-1.58] 4.42 [1.55-12.62] 2.27 [0.86-5.96] 7 to 10 0.39 [0.15- 0.99] 2.87 [1.03-7.98] 1.38 [0.54-3.54] ≥ 10 1 0.02 1 0.03 1 0.19 Health insurance No 1 1 1 Yes 0.41 [0.20- 0.85] 0.01 0.54 [ 0.26- 1.12] 0.10 0.5 [0.24-1.05] 0.06
How the patients planned to pay the additional expenses
Savings 1 0.02 1 0.21 1 0.51
Loan 3.34 [0.59-18.86] 1.18 [ 0.24-5.82] 2.43 [ 0.43- 13.78]
Help from relatives 1.29 [0.66-2.48] 1.58 [0.81-3.08] 1.48 [0.76- 2.90]
Working 2.50 [0.90-6.75] 0.61 [0.23-1.66] 1.14 [0.43- 3.05] Selling belongings 5.85 [1.72-19.89] 1.15 [0.42-3.17] 2.22 [ 0.79- 6.24] Residence Urban 1 1 1 Rural 1.53 [0.81-2.88] 0.18 2.51 1.26-4.97] 0.007 2.68 [1.33-5.41] 0.006 Clinical aspects Hemoptysis No 1 0.21 1 0.14 1 0.05 Yes 0.69 [0.38- 1.23] 0.65 [0.36-1.16] 0.57 [0.31-1.02]
Knowledge, attitudes and beliefs
Did not know how TB is transmitted 2.35 [1.26- 4.40] 0.01 1.38 [0.75-2.54] 0.30 1.58 [0.86-2.91] 0.14
Did not know what causes TB 1.34 [0.66- 2.71] 0.41 2.06 [1.02-4.13] 0.03 1.30 [0.80-3.21] 0.16
Did not know that TB treatment was free
status lengthened the HSD [17,18]. Spending time seeking care and having to pay the necessary expenses to access it may impede the patient’s progression through the health-care system [19]. In Myanmar, Lönnroth et al showed that implementing measures to address the financial burden of TB can significantly shorten diagnostic delays [20]. Eco-nomic impediments to accessing health care are likely to contribute to the lengthening of the HSD in Chad, despite the fact that TB treatment is free there.
The organization of health care and its quality may affect the HSD [19]. Indeed, the centralization of TB diag-nosis requires a visit to a hospital for the sputum smear test and a chest radiograph. In this study, the longest HSDs were associated with having been diagnosed in Ndjamena. This could be explained by the fact that this is a larger city with more-substantial health-care facilities, with the result that there are a larger number of potential
steps in the pathway of care. Storla et al. do, in fact, call at-tention to the harmful role of repeated visits at the same level of care as one of the mechanisms that can contribute to diagnostic delay in TB [7]. The hierarchical level of care might also increase the risk of lengthening the HSD, given that the patients diagnosed at the HGRN seem to have had a longer HSD.
A poor knowledge of TB may lead to a longer HSD [19]. Believing in the efficacy of informal care and especially of traditional medicine in curing TB was significantly asso-ciated with longer HSDs in this study. The literature shows similar findings in different contexts, such as Vietnam, Nepal and South Africa [21-23]. These patients may use traditional healers as gatekeepers to enter the health-care system. The ability of these healers to identify TB symptoms and to then promptly refer the patient to a trained health professional could impact the HSD. Thus,
Table 3 Factors associated with delays exceeding their median value (bivariate analysis, adjusted for the hospital)
(Continued)
Is there a link between AIDS and TB?
No 1 0.12 1 0..39 OR=1 0.41
Yes 0.57 [0.32-1.01] 0.74 [0.42-1.31] 0.79 [0.44-1.41]
Did not know 0.60 [0.32-1.13] 0.65 [0.35-1.23] 0.65 [0.35-1.23]
What treatment can cure TB?
Self- medication 4.46 [0.47-42.67] 0.02 0.85 [0.09-8.30] 0.0003 1.89 [0.18-19.96] 0.0001
Medical care 1 1 1
No answer 2.37 [1.38- 4.05] 2.38 [ 1.37- 4.13] 3.05 [1.73- 5.40]
Nothing 4.22 [0.43-41.99] 5.80 [0.56-60.43] 5.24 [0.42-65.45]
Traditional medicine 2.20 [1.05-4.60] 5.70 [2.39-13.65] 5.02 [2.16-11.67]
Access to and use of health services Referral by a health facility
Yes 1 0.04 1 0.18 1 0.63
No 1.66 [1.02- 2.70] 1.41 [0.86- 2.32] 1.13 [0.69-1.85]
Distance from home to closest service
≤ 1 km 1 0.01 1 0.09 1 0.15
1 to 5 km 1.25 [0.75- 2.07] 0.99[0.59-1.66] 1.24 [0.74- 2.08]
≥ 5 km 3.99 [1.52-10.48] 2.56[1.05-6.24] 2.38 [0.99- 5.74]
First care received
Self-medication 1.58 [0.27-9.44] 0.10 0.77[0.14-4.15] 0.03 0.80 [0.15- 4.34] 0.09 Health center 1 1 1 Hospital 0.92 [0.46-1.84] 0.48[0.24-0.98] 0.70 [0.35- 1.41] Pharmacist 0.19 [0.04-0.99] 0.50[0.13-1.98] 0.20 [0.04- 1.01] Private doctor 0.37 [0.13-1.03] 0.62[0.23-1.68] 0.72 [ 0.26-1.99] No health care 2.83 [0.31-26.29] 0.63[0.12-3.48] 0.62 [0.11- 3.40]
Informal drug market 0.57 [0.28-1.17] 1.38[0.66-2.87] 0.95 [0.46-1.96]
Traditional medicine 0.49 [0.21-1.14] 2.05[0.83-5.06] 2.46 [0.97- 6.24]
training traditional healers on and involving them in the TB detection strategy might reduce the HSD.
Determinants of total delay
The centralization of the point of diagnosis of TB, the referral pattern, the cost of care and the misunderstand-ing of the requirements of TB treatment influenced the TD in the same manner as they influenced the PD and the HSD. As a result, a longer TD was associated with a lower economic status, with the belief in the efficacy of informal treatment and with having been diagnosed at a Ndjamena hospital.
A low sensitivity of the TB screening criteria may also be a key factor in delays. Indeed, the TD was longer in the ab-sence of hemoptysis. The inability of a health-care provider to suspect TB when the pulmonary signs are mild might explain this association [19]. This is probably one of the reasons why the TB detection rate remains so low in Chad. Some factors seem to affect the first and the second phase of the pathway of care in opposite directions [19], and their effects on the TD may be the result of this op-posite influence on the PD and the HSD. For example, being a woman was associated with a shorter PD, but paradoxically, it may be associated with a longer HSD. The women’s behaviour was unlikely to be significantly different from that of the men at the beginning of the trajectory of care, but afterwards, they were likely to en-counter some gender-specific barriers once they entered the health-care system. The gender-specific parameters that may have been associated with the slow progression of women through the health-care system include a lack of financial independence, a lower social status, family responsibilities and a lack of respect from health-care providers. Consequently, public health interventions should be tailored to different circumstances.
Limitations
Since it excluded patients who died before reaching the hospital and those who were too ill to be interviewed, this study may underestimate TB diagnostic delays in Chad. This should be taken into account when interpreting the results of this study. These results concern patients who had access to public tertiary hospitals in Ndjamena and
Moundou. Since WHO estimated the TB case-detection rate at 26% in Chad in 2009 [8], there is a need to under-stand the behavior of patients who are not detected. Another study should help identify the determinants of their health care trajectories.
The multicenter design of this study enabled us to inves-tigate the factors associated with the delayed initiation of TB treatment at two different levels of the health-care sys-tem and in two different cities and regions.
Conclusion
The TD in Ndjamena and Moundou is too long. A fourth of the patients began their TB treatment at least 95 days after the onset of symptoms. The 286 patients in this study may have exposed 1740 members of their respective households to a risk of TB infection when they were infec-tious. The ability to pay for care, the level of education, knowledge of TB and knowledge of the organization of health care may determine the length of the delay in the diagnosis of TB. Significant differences in diagnostic delays might also depend on the quality of care, on the ability of health professionals to use the TB detection protocol, and on how they interact with the patients.
Implementing measures to inform the general public about TB and the availability of free TB treatment could help shorten diagnostic delays. Certain measures, such as microfinance, might improve the performance of the refer-ral pattern by reducing the financial burden of TB for patients. Transporting sputum specimens from first-level facilities to the nearest hospitals could decentralize TB diagnosis without decreasing the quality of the sputum smear test. This decentralization would also reduce the cost incurred by patients to get diagnosed.
Training health workers on the management of TB via regular mentoring and supervision could improve the management of TB. The need to limit the transmission of the bacillus may encourage active screening of the house-holds of contagious patients, despite the cost of this meas-ure. Involving traditional healers and informal health professionals in the screening strategy might also facilitate patient access to TB diagnosis. Lastly, regular monitoring, a TB control program and the evaluation of this program are necessary to facilitate the use of public TB services.
Table 4 Comparison of the PD, HSD and TD with the findings in the literature
PD [Ref] HSD [Ref] TD [Ref]
African studies 2 to 7 days [24,25] 2 to 30 days [16,26-31] 26 to 44 days [26,32]
14 days [16,33-35] 35 days [36] 52 to 62 days [25,29,37]
21 to 60 days [26-28,30,38-40] 42 to 63 days [2,24,25,38] 77 to 120 days [2,24,28,31,36,38,41,42]
Our study 15 days 36 days 57.5 days
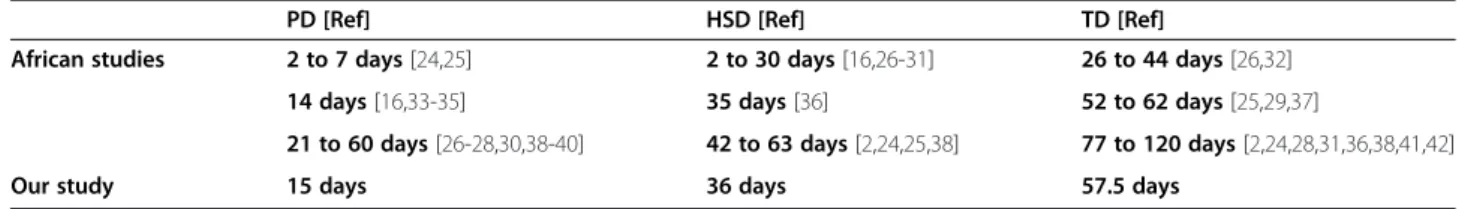
Table 5 Factors associated with delays exceeding their median value (multivariate analysis)
Extended patient delay Extended health-care system delay Extended total delay
aOR [95% CI] aOR [95% CI] aOR [95% CI]]
Adjustment variables Gender
Male 1 1 1
Female 0.61 [0.35-1.07] 1.67 [0.90-3.04] 0.73 [0.41-1.30]
Age groups (years)
15 to 24 1 1 1 25 to 34 0.77 [0.38-1.57] 0.57 [0.27-1.22] 0.53 [0.25-1.10] 35 to 44 1.03 [0.46-2.28] 1.13 [0.49-2.63] 0.62 [0.27-1.42] 45 to 55 0.90 [0.34-2.35] 0.47 [0.20-1.27] 0.59 [0.23-1.51] 55 and over 1.60 [0.45-5.58] 1.43 [0.40-5.06] 0.86 [0.28-2.91] Wealth score 1stquartile (lowest) 2.38 [1.08-5.25] 2.86 [1.30- 6.33] 3.75 [1.66-8.48] 2nd 2.15 [0.97-4.76] 1.66 [0.74-3.70] 1.97 [0.90-4.44] 3rd 1.31 [0.62-2.79] 1.25 [0.59-2.67] 1.50 [0.70-3.24] 4th(highest) 1 1 1 Hospital HM 1 1 1 HU 0.80 [0.35-1.81] 2.61 [1.07-6.36] 2.78 [1.24-6.23] HGRN 1.04 [0.47-2.21] 3.92 [1.83-8.42] 6.25 [2.96-13.22] Selected variables
Numbers of years of education
-0 0.88 [0.29-2.63] 3.47 [1.01-11.88]
1 to 4 0.98 [0.31-3.10] 4.71 [1.34-16.51]
5 to 6 0.42 [0.15-1.18] 2.89 [0.93-9.17]
7 to 10 0.33 [0.12-0.92] 2.29 [0.76-6.95]
≥ 10 1 1
What treatment can cure TB?
Medical care 1 1 1
No answer 2.52 [1.40-4.50] 3.30 [1.71-6.35] 3.68 [1.71-7.92]
Self-medication, traditional medicine, nothing 2.15 [1.05-4.54] 5.46 [2.37-12.60] 3.76 [2.03-6.97]
Referral by a health facility -
-Yes 1
No 1.75 [1.02- 3.02]
Is there are link between AIDS and TB? 1
-No Yes - 0.94 [0.48-1.84] No opinion 0.37 [0.17- 0.80] Hemoptysis Yes - 1 No - 2.07 [1.06- 4.04]
Competing interests
The authors declare no conflict of interest.
Authors’ contribution
NNN designed the study protocol, collected and analysed the data and drafted the article. DN and NR revised the study protocol, collected the data and revised the article. MNN revised the study protocol and the article. MGS revised the article. VHF and PC revised the study protocol, supervised the data analysis and revised the article. All authors approve this submitted version of the article.
Acknowledgments
This study was supported by the Chadian Health Ministry. We thank Dr. Abdelatti, Mr. Fina-Teysou and Mr. Guinloungoum of the Chadian TB control program for their advice and help.
The Chadian Health Ministry was not involved in the design, the analysis, the interpretation of the results or in the writing of this article. We also thank Dr. P. Izulla (Kenya) for his assistance in editing the English version of the article.
Author details
1Inserm, UMRS, 707, Paris, France.2Université Pierre et Marie Curie-Paris6,
UMRS, 707, Paris, France.3Hôpital Régional, Moundou, Chad.4Ministère de la santé publique, Direction générale des activités sanitaires, Ndjamena, Chad.
5Hôpital général de référence, Ndjamena, Chad.6Faculté des sciences de la
santé, Université de Ndjamena, Ndjamena, Chad.
Received: 12 September 2011 Accepted: 20 June 2012 Published: 9 July 2012
References
1. Glaziou P, Floyd K, Raviglione M: Global burden and epidemiology of tuberculosis. Clin Chest Med 2009, 30(4):621–636.
2. Lawn SD, Afful B, Acheampong JW: Pulmonary tuberculosis: diagnostic delay in Ghanaian adults. Int J Tuberc Lung Dis 1998, 2(8):635–640. 3. Lin X, Chongsuvivatwong V, Lin L, Geater A, Lijuan R: Dose–response
relationship between treatment delay of smear-positive tuberculosis patients and intra-household transmission: a cross-sectional study. Trans
R Soc Trop Med Hyg 2008, 102(8):797–804.
4. Golub JE, Bur S, Cronin WA, Gange S, Baruch N, Comstock GW, Chaisson RE: Delayed tuberculosis diagnosis and tuberculosis transmission. Int J Tuberc
Lung Dis 2006, 10(1):24–30.
5. Asch S, Leake B, Anderson R, Gelberg L: Why do symptomatic patients delay obtaining care for tuberculosis? Am J Respir Crit Care Med 1998, 157 (4):1244–1248.
6. Sreeramareddy CT, Panduru KV, Menten J, Van den Ende J: Time delays in diagnosis of pulmonary tuberculosis: a systematic review of literature.
BMC Infect Dis 2009, 9:91.
7. Storla DG, Yimer S, Bjune GA: A systematic review of delay in the diagnosis and treatment of tuberculosis. Bmc Public Health 2008, 8:15. 8. Wordl Health Organization: Global Tuberculosis Control 2010. In: Global
tuberculosis control: WHO report 2010. vol. WHO/HTM/TB/2010.7, Wordl Health Organization. Geneva: World Health Organization; 2010.
9. Martin A, Baptiste JP, Krieger G: Respiratory infections: SARS and tuberculosis. Clin Occup Environ Med 2004, 4(1):189–204.
10. Wang JM, Fei Y, Shen HB, Xu B: Gender difference in knowledge of tuberculosis and associated health-care seeking behaviors: a cross-sectional study in a rural area of China. Bmc Public Health 2008, 8:354. 11. Wang Y, Long Q, Liu Q, Tolhurst R, Tang SL: Treatment seeking for
symptoms suggestive of TB: comparison between migrants and permanent urban residents in Chongqing, China. Trop Med Int Health 2008, 13(7):927–933.
12. Xu B, Jiang QW, Xiu Y, Diwan VK: Diagnostic delays in access to tuberculosis care in counties with or without the National Tuberculosis Control Programme in rural China. Int J Tuberc Lung Dis 2005, 9(7):784–790. 13. Mauch V, Woods N, Kirubi B, Kipruto H, Sitienei J, Klinkenberg E: Assessing
access barriers to tuberculosis care with the tool to Estimate Patients' Costs: pilot results from two districts in Kenya. Bmc Public Health 2011, 11:43.
14. Mesfin MM, Newell JN, Madeley RJ, Mirzoev TN, Tareke IG, Kifle YT, Gessessew A, Walley JD: Cost implications of delays to tuberculosis
diagnosis among pulmonary tuberculosis patients in Ethiopia. Bmc Public
Health 2010, 10:173.
15. Xu B, Diwan VK, Bogg L: Access to tuberculosis care: What did chronic cough patients experience in the way of healthcare-seeking? Scand J
Public Health 2007, 35(4):396–402.
16. Meintjes G, Schoeman H, Morroni C, Wilson D, Maartens G: Patient and provider delay in tuberculosis suspects from communities with a high HIV prevalence in South Africa: A cross-sectional study. BMC Infect Dis 2008, 8:72.
17. Tobgay KJ, Sarma PS, Thankappan KR: Predictors of treatment delays for tuberculosis in Sikkim. Natl Med J India 2006, 19(2):60–63.
18. Lönnroth K, Thuong LM, Linh PD, Diwan VK: Delay and discontinuity–a survey of TB patients' search of a diagnosis in a diversified health care system. Int J Tuberc Lung Dis 1999, 3(11):992–1000.
19. Ndeikoundam Ngangro N, Chauvin P, HalleydesFontaines V: Determinants of tuberculosis diagnosis delay in limited resources countries. Rev
Epidemiol Sante Publique 2012, 60(1):47–57.
20. Lonnroth K, Aung T, Maung W, Kluge H, Uplekar M: Social franchising of TB care through private GPs in Myanmar: an assessment of treatment results, access, equity and financial protection. Health Policy Plan 2007, 22 (3):156–166.
21. Barker RD, Millard FJC, Malatsi J, Mkoana L, Ngoatwana T, Agarawal S, de Valliere S: Traditional healers, treatment delay, performance status and death from TB in rural South Africa. Int J Tuberc Lung Dis 2006, 10(6):670–675. 22. Huong NT, Vree M, Duong BD, Khanh VT, Loan VT, Co NV, Borgdorff MW,
Cobelens FG: Delays in the diagnosis and treatment of tuberculosis patients in Vietnam: a cross-sectional study. Bmc Public Health 2007, 7:110. 23. Yamasaki-Nakagawa M, Ozasa K, Yamada N, Osuga K, Shimouchi A, Ishikawa
N, Bam DS, Mori T: Gender difference in delays to diagnosis and health care seeking behaviour in a rural area of Nepal. Int J Tuberc Lung Dis 2001, 5(1):24–31.
24. Kiwuwa MS, Charles K, Harriet MK: Patient and health service delay in pulmonary tuberculosis patients attending a referral hospital: a cross-sectional study. Bmc Public Health 2005, 5:122.
25. Lienhardt C, Rowley J, Manneh K, Lahai G, Needham D, Milligan P, McAdam KP: Factors affecting time delay to treatment in a tuberculosis control programme in a sub-Saharan African country: the experience of The Gambia. Int J Tuberc Lung Dis 2001, 5(3):233–239.
26. Ayuo PO, Diero LO, Owino-Ong'or WD, Mwangi AW: Causes of delay in diagnosis of pulmonary tuberculosis in patients attending a referral hospital in Western Kenya. East Afr Med J 2008, 85(6)):263–268. 27. Demissie M, Lindtjorn B, Berhane Y: Patient and health service delay in the
diagnosis of pulmonary tuberculosis in Ethiopia. Bmc Public Health 2002, 2:23. 28. Gele AA, Bjune G, Abebe F: Pastoralism and delay in diagnosis of TB in
Ethiopia. Bmc Public Health 2009, 9:5.
29. Lorent N, Mugwaneza P, Mugabekazi J, Gasana M, Van Bastelaere S, Clerinx J, Van den Ende J: Risk factors for delay in the diagnosis and treatment of tuberculosis at a referral hospital in Rwanda. Int J Tuberc Lung Dis 2008, 12(4):392–396.
30. Odusanya OO, Babafemi JO: Patterns of delays amongst pulmonary tuberculosis patients in Lagos. Nigeria. Bmc Public Health 2004, 4:18. 31. Yimer S, Bjune G, Alene G: Diagnostic and treatment delay among
pulmonary tuberculosis patients in Ethiopia: a cross sectional study. BMC
Infect Dis 2005, 5:112.
32. Harries AD, Salaniponi FM, Kwanjana JH: Directly observed treatment for tuberculosis. Lancet 1999, 353(9147):146–147.
33. Cambanis A, Ramsay A, Yassin MA, Cuevas LE: Duration and associated factors of patient delay during tuberculosis screening in rural Cameroon.
Trop Med Int Health 2007, 12(11):1309–1314.
34. Kasse Y, Jasseh M, Corrah T, Donkor S, Antonnio M, Jallow A, Adegbola R, Hill P: Health seeking behaviour, health system experience and tuberculosis case finding in Gambians with cough. BMC Public Health 2006, 6:143.
35. Mfinanga SG, Mutayoba BK, Kahwa A, Kimaro G, Mtandu R, Ngadaya E, Egwaga S, Kitua AY: The magnitude and factors associated with delays in management of smear positive tuberculosis in Dar es Salaam. Tanzania.
BMC Health Serv Res 2008, 8:158.
36. Steen TW, Mazonde GN: Pulmonary tuberculosis in Kweneng district, Botswana: delays in diagnosis in 212 smear-positive patients. Int J Tuberc
Lung Dis 1998, 2(8):627–634.
37. Salaniponi FML, Harries AD, Banda HT, Kang'ombe C, Mphasa N, Mwale A, Upindi B, Nyirenda TE, Banerjee A, Boeree MJ: Care seeking behaviour and
diagnostic processes in patients with smear-positive pulmonary tuberculosis in Malawi. Int J Tuberc Lung Dis 2000, 4(4):327.
38. Camara A, Diallo A, Camara LM, Fielding K, Sow OY, Chaperon J: Factors linked to delayed diagnosis of tuberculosis in Conakry (Guinea).
Sante Publique 2006, 18(1):63––70.
39. Cambanis A, Yassin MA, Ramsay A, Squire SB, Arbide I, Cuevas LE: Rural poverty and delayed presentation to tuberculosis services in Ethiopia.
Trop Med Int Health 2005, 10(4):330–335.
40. Kilale A, Mushi A, Lema L, Kunda J, Makasi C, Mwaseba D, Range N, Mfinanga G: Perceptions of tuberculosis and treatment seeking behaviour in Ilala and Kinondoni Municipalities in Tanzania. Tanzan J
Health Res 2008, 10(2):89–94.
41. Okeibunor JC, Onyeneho NG, Chukwu JN, Post E: Where do tuberculosis patients go for treatment before reporting to DOTS clinics in southern Nigeria? Tanzan Health Res Bul 2007, 9(2):94–101.
42. Ouédraogo M, Kouanda S, Boncoungou K, Dembélé M, Zoubga ZA, Ouédraogo SM, Coulibaly G: Treatment seeking behaviour of smear-positive tuberculosis patients diagnosed in Burkina Faso. Int J Tuberc
Lung Dis 2006, 10(2):184–187.
doi:10.1186/1471-2458-12-513
Cite this article as: Ndeikoundam Ngangro et al.: Pulmonary tuberculosis diagnostic delays in Chad: a multicenter, hospital-based survey in Ndjamena and Moundou. BMC Public Health 2012 12:513.
Submit your next manuscript to BioMed Central and take full advantage of:
• Convenient online submission • Thorough peer review
• No space constraints or color figure charges • Immediate publication on acceptance
• Inclusion in PubMed, CAS, Scopus and Google Scholar • Research which is freely available for redistribution
Submit your manuscript at www.biomedcentral.com/submit
![Table 2 Factors associated with delays exceeding their median value (univariate analysis ) Size Median PD [IQ] Percentage](https://thumb-eu.123doks.com/thumbv2/123doknet/14622521.547240/6.892.87.808.146.1090/table-factors-associated-exceeding-univariate-analysis-median-percentage.webp)
![Table 2 Factors associated with delays exceeding their median value (univariate analysis ) (Continued) Clinical aspects Hemoptysis Yes 61 19.0 [10.0 – 30.0] 60.7 0.25 54.0 [26.0-72.0] 59 0.15 75.0 [39.0 – 113.0] 60.7 0.08 No 225 15.0 [7.0- 30.0] 52 35.0 [1](https://thumb-eu.123doks.com/thumbv2/123doknet/14622521.547240/7.892.97.809.148.1011/factors-associated-exceeding-univariate-analysis-continued-clinical-hemoptysis.webp)