HAL Id: inserm-02467622
https://www.hal.inserm.fr/inserm-02467622
Submitted on 5 Feb 2020
HAL is a multi-disciplinary open access
archive for the deposit and dissemination of
sci-entific research documents, whether they are
pub-lished or not. The documents may come from
teaching and research institutions in France or
abroad, or from public or private research centers.
L’archive ouverte pluridisciplinaire HAL, est
destinée au dépôt et à la diffusion de documents
scientifiques de niveau recherche, publiés ou non,
émanant des établissements d’enseignement et de
recherche français ou étrangers, des laboratoires
publics ou privés.
room: a prospective bicentre study
Hugues de Courson, Philippe Boyer, Romain Grobost, Romain Lanchon,
Musa Sesay, Karine Nouette-Gaulain, Emmanuel Futier, Matthieu Biais
To cite this version:
Hugues de Courson, Philippe Boyer, Romain Grobost, Romain Lanchon, Musa Sesay, et al..
Changes in dynamic arterial elastance induced by volume expansion and vasopressor in the operating
room: a prospective bicentre study. Annals of Intensive Care, SpringerOpen, 2019, 9 (1), pp.117.
�10.1186/s13613-019-0588-6�. �inserm-02467622�
RESEARCH
Changes in dynamic arterial elastance
induced by volume expansion and vasopressor
in the operating room: a prospective bicentre
study
Hugues de Courson
1, Philippe Boyer
1, Romain Grobost
2, Romain Lanchon
1, Musa Sesay
1,
Karine Nouette‑Gaulain
1,3, Emmanuel Futier
2,4and Matthieu Biais
1,5*Abstract
Background: Dynamic arterial elastance (Eadyn), defined as the ratio between pulse pressure variations and stroke volume variations, has been proposed to assess functional arterial load. We evaluated the evolution of Eadyn during volume expansion and the effects of neosynephrine infusion in hypotensive and preload‑responsive patients.
Methods: In this prospective bicentre study, we included 56 mechanically ventilated patients in the operating room. Each patient had volume expansion and neosynephrine infusion. Stroke volume and stroke volume variations were obtained using esophageal Doppler, and pulse pressure variations were measured through the arterial line. Pressure response to volume expansion was defined as an increase in mean arterial pressure (MAP) ≥ 10%.
Results: Twenty‑one patients were pressure responders to volume expansion. Volume expansion induced a decrease in Eadyn (from 0.69 [0.58–0.85] to 0.59 [0.42–0.77]) related to a decrease in pulse pressure variations more pronounced than the decrease in stroke volume variations. Baseline and changes in Eadyn after volume expansion were related to age, history of arterial hypertension, net arterial compliance and effective arterial elastance. Eadyn value before vol‑ ume expansion > 0.65 predicted a MAP increase ≥ 10% with a sensitivity of 76% (95% CI 53–92%) and a specificity of 60% (95% CI 42–76%). Neosynephrine infusion induced a decrease in Eadyn (from 0.67 [0.48–0.80] to 0.54 [0.37–0.68]) related to a decrease in pulse pressure variations more pronounced than the decrease in stroke volume variations. Baseline and changes in Eadyn after neosynephrine infusion were only related to heart rate.
Conclusion: Eadyn is a potential sensitive marker of arterial tone changes following vasopressor infusion. Keywords: Arterial pressure, Cardiac output, Doppler
© The Author(s) 2019. This article is distributed under the terms of the Creative Commons Attribution 4.0 International License
(http://creat iveco mmons .org/licen ses/by/4.0/), which permits unrestricted use, distribution, and reproduction in any medium,
provided you give appropriate credit to the original author(s) and the source, provide a link to the Creative Commons license, and indicate if changes were made.
Introduction
Many recent studies have underlined the point that perioperative hypotension could lead to worse patient outcome mainly because of myocardial injury, cerebro-vascular disease and acute kidney injury [1–3]. Therefore, understanding the origins of perioperative hypotension and its prevention is essential to proposing a judicious
treatment modality. Basically, the two principal strate-gies to correct perioperative hypotension are vasopres-sor infusion and/or volume expansion. During the last decade, many studies tested different indices and their abilities to predict an increase in stroke volume follow-ing fluid administration and/or vasopressor infusion [4–6]. Additionally, the prediction of an increase in arte-rial pressure following volume expansion has been widely studied.
Several years ago, Pinsky et al. proposed a pragmatic, easy-to-use and physiologically robust approach of dynamic arterial elastance [7]. Schematically, arterial
Open Access
*Correspondence: matthieu.biais@chu‑bordeaux.fr
1 Department of Anesthesiology and Critical Care, Pellegrin Bordeaux
University Hospital, 33000 Bordeaux, France
elastance (Ea) is defined as the ratio of changes in pres-sure to changes in volume. Dynamic arterial elastance (Eadyn) could therefore be assessed using the ratio between respiratory-induced changes in arterial pulse pressure and respiratory-induced changes in stroke volume during a single respiratory cycle. Several stud-ies investigated the clinical utility of Eadyn. The most robust data concern the evolution of Eadyn as an indica-tor of decrease in arterial pressure following a reduction in norepinephrine dosage in septic shock patients [8]. A randomized control trial demonstrated that a therapeu-tic protocol based on Eadyn may be an efficient guide to decrease norepinephrine infusion in patients follow-ing cardiac surgery [9]. Other studies investigated the ability of Eadyn to predict an increase in arterial pres-sure following volume expansion with discordant results [10–15]. Results of studies including ICU septic patients with acute circulatory failure and receiving vasopres-sors are very promising [13, 16, 17]. On the another hand, studies including operating room patients with-out vasopressor support and suffering from non-septic hypovolemia showed conflicting results [11, 12, 15, 18]. We can hypothesize that volume expansion induces dif-ferent effects on arterial compliance in patients receiving vasopressors or not. Hence, it affects Eadyn in a differ-ent way. The very rare studies carried out in the operat-ing theater included very specific patients (liver failure or laparoscopy). Before proposing the use of Eadyn to guide low blood pressure treatment in the operating room, it would be necessary to perform a prospective study on patients, under general anesthesia and are not receiving vasopressors.
The objectives of this bicentre study were to (i) describe Eadyn variations induced by volume expansion and vaso-pressor infusion, (ii) describe the relationship between baseline Eadyn and the increase in arterial pressure induced by volume expansion and vasopressor infusion and (iii) test the ability of baseline Eadyn to predict an increase in arterial pressure following volume expansion in the operating room.
Materials and methods
Patients
This prospective, bicentre study was approved by the Institutional Review Board (Comité de Protection des Personnes Sud-Ouest et Outre Mer III, Bordeaux, France N°DC2016/125) and was registered at French National Commission for Data Protection and Liberties (CNIL N°1980317).
Fifty-six non-consecutive patients were included after oral informed consent. (Written informed consent was waived by the Institutional Review Board.) Inclusion cri-teria were patients scheduled for neurosurgery or elective
abdominal surgery, older than 18 years, equipped with radial arterial catheter and esophageal Doppler (CardioQ ODM+, Deltex Medical, Chichester, UK) for cardiac out-put monitoring. Non-inclusion criteria were preoperative lung disease, intracranial hypertension, left ventricular ejection fraction below 50%, arrhythmia, suspected right ventricular dysfunction, extreme body weight (BMI > 40 or < 15 kg/m2).
Perioperative management
Standard monitoring included noninvasive blood pres-sure, heart rate, peripheral oxygen saturation and con-tinuous electrocardiography. After preoxygenation, anesthesia was induced using propofol and remifentanil or sufentanil. Propofol or sevoflurane and remifentanil or sufentanil were used for maintenance of anesthesia. Following tracheal intubation, patient’s lungs were ven-tilated with a mixture of air/oxygen using volume con-trol mode. Tidal volume was set between 6 and 8 ml/kg of ideal body weight, and positive end-expiratory pres-sure was set between 6 and 10 cmH2O (Primus, Dräger, Lübeck, Germany, or Avance, General Electric Health-care, Helsinki, Finland). Peripheral oxygen saturation was maintained above 96%, and the respiratory rate was adjusted to maintain end-tidal carbon dioxide concentra-tion between 30 and 35 mmHg. The inspiratory-to-expir-atory ratio was set to 1/2.
Hemodynamic monitoring
All patients were equipped with a radial arterial catheter inserted just after the induction of anesthesia (Vygon, Ecouen, France). The catheter was connected to a bedside monitor (Spacelabs Healthcare Company Headquarters, Issaquah, WA, USA, or IntelliVue MP70, Philips Health-care, Andover, MA, USA) for mean arterial pressure (MAP) and pulse pressure variation (PPV) monitoring. After tracheal intubation, the probe was inserted into the esophagus via the nasal route and the good quality of the signal was confirmed as previously described.
PPV was derived from the bedside monitor by manual calculation of the difference between systolic and dias-tolic blood pressure. The maximal (Pulse Pressure max) and minimal (Pulse Pressure min) differences were deter-mined during three consecutive respiratory cycles. The mean values of the three measurements were used to calculate arterial pulse pressure variability: PPV = (Pulse Pressure max − Pulse Pressure min)/[(Pulse Pres-sure max + Pulse PresPres-sure min)/2] × 100, as previously described [19]. PPV was measured directly on the moni-tor using a screenshot.
Stroke volume, cardiac output, stroke volume varia-tion (SVV), corrected flow time and peak velocity of aor-tic blood flow were assessed using esophageal Doppler
(CardioQ ODM+, Deltex Medical, Gamida, Eaubonne France). SVV was calculated automatically as follows: (Stroke Volume max − Stroke Volume min)/[(Stroke Vol-ume max + Stroke VolVol-ume min)/2] over one respiratory cycle. The SVV value was averaged over five respiratory cycles [20]. SVV value was recorded immediately after the measurement of PPV in order to record two values that covered the same time period.
Eadyn was calculated as the ratio between PPV and SVV. Net arterial compliance (C) was calculated as the ratio between stroke volume and pulse pressure [21]. Arterial resistance (R) was calculated as the ratio between mean arterial pressure and cardiac output. Arte-rial elastance was calculated using these two formulas: EaSAP = (systolic arterial pressure × 0.9)/stroke volume and EaMAP = mean arterial pressure/stroke volume [22,
23].
Study design
Measurements were performed in the operating room, between the end of induction of anesthesia and the end of surgery. Volume expansions and neosynephrine infu-sions were performed according to the routine care of the patients. Each patient received volume expansion before neosynephrine infusion. If several volume expansions or neosynephrine infusions were done in one patient, only the first volume expansion or the first neosynephrine infusion was recorded.
Volume expansion was performed if MAP ≤ 65 mmHg and SVV > 10%, and neosynephrine was infused if MAP ≤ 65 mmHg regardless of the SVV value, on the dis-cretion of the physician in charge.
Volume expansion was done with 250 ml 0.9% saline over 10 min. One set of measurements was performed immediately before volume expansion, and the second set was done 2–3 min after the end of fluid administration.
Vasopressor infusion consisted of a fixed dose of 50 mcg of neosynephrine. One set of measurements was performed immediately before vasopressor infusion, and the second set was performed 2 to 3 min after the infu-sion when MAP was stabilized (MAP variation below 5% during 1 min).
Patients with hemodynamic instability requiring a decrease (or an increase) in anesthesia drug dosage, fluid infusion or administration of vasopressors other than in the protocol were excluded. Another exclusion criterion was any change in ventilatory setting by the physician in charge of the patient.
Statistical analysis
Data are expressed as median [percentile, 25–75] or mean ± SD where appropriate. Normality of the distribu-tion was tested using D’Agostino–Pearson test. Pressure
response to volume expansion was defined as an increase in MAP ≥ 10% [13, 14]. The effects of neosynephrine and volume expansion on hemodynamic parameters were analyzed using Wilcoxon rank sum test. Mann–Whitney test was used to compare hemodynamic variables before fluid challenge or neosynephrine infusion in pressure non-responder and responder patients. The relationship between Eadyn and changes in MAP induced by volume expansion was tested using Spearman rank test.
The receiver-operating characteristic (ROC) curves were generated for Eadyn and MAP to test their abilities to predict pressure response to volume expansion. Area under the receiver-operating characteristic curves were compared using De Long test [24]. The best threshold values were identified using the Youden Index (speci-ficity + sensitivity − 1). The gray zone was determined as follows: The low cutoff value was defined to exclude positive fluid challenge in 90% of patients, whereas the high cutoff value was defined to predict positive fluid challenge in 90% of cases [25]. A diagnostic test is con-sidered to have good accuracy when its area under the ROC curve is ≥ 0.75 [26]. Fifty-six patients were needed to demonstrate the ability of Eadyn to predict pressure responsiveness with good accuracy, i.e., area under the ROC curve > 0.75 (ratio of pressure responders = 1/3, null hypothesis = 0.50, type I error of 5% and type II error of 10%).
Random effects models were estimated in order to study the effect of several covariates on the temporal evo-lution of Eadyn, SVV and PPV during fluid challenge and neosynephrine infusion.
For each hemodynamic maneuver (i.e., fluid challenge and neosynephrine infusion), two different models were estimated for Eadyn, PPV and SVV. The first model included covariates related to arterial load and the sec-ond cardiac covariates. Each model was a fully adjusted model including all covariates of the study. Only baseline values (before hemodynamic maneuver) were included. To study the effect of covariates on temporal evolution of Eadyn, PPV and SVV, random effects models were esti-mated with subjects being considered as the random fac-tors. For each random effects model, because only two repeated measurements were performed, we considered time function as linear. Hence, we estimated the fixed intercept, fixed effects, random intercept and time inter-action between time and each covariate. The contribution of each covariate on temporal evolution was tested by a Wald test on the time–covariate interaction term [27].
Statistical analysis was performed using Medcalc (soft-ware 11.6; Mariakerke, Belgium) and R Development Core Team ([2008]. R: A language and environment for statistical computing; R Foundation for Statistical Com-puting, Vienna, Austria. ISBN 3-900051-07-0, URL).
Results
Patient characteristics
Fifty-six patients were included (Fig. 1). Patient charac-teristics are shown in Table 1. Hemodynamic variables are shown in Table 2. The distribution of Eadyn was not normal. Each patient received volume expansion before neosynephrine infusion.
Effects of volume expansion
Volume expansion induced a significant increase in arte-rial pressure (systolic, diastolic, mean and pulse pres-sure), stroke volume (16% [10–25%]), cardiac output (14% [10–18%]) and net arterial compliance associated with a significant decrease in heart rate, PPV, SVV, Eadyn, Ea and R (Table 2 and Fig. 2a). Forty-five patients presented an increase in stroke volume ≥ 10%. Volume expansion induced a significantly larger decrease in PPV than in SVV: (− 27% (− 48 to − 13%) versus − 15% (− 29 to 0%), respectively), p = 0.0002. Baseline and changes in Eadyn after volume expansion were related to age, arterial hypertension, compliance and effective arterial elastance (Tables 3, 4). After volume expansion, Eadyn decreased in 38 patients (68%), remained unchanged in 2 patients (4%) and increased in 16 patients (29%). Twenty-one
patients were pressure responders to volume expan-sion. Prior to volume expansion, Eadyn was higher and MAP lower in responder than in non-responder patients (Table 5). Volume expansion induced different pressure effects in responders and non-responder patient. Ea, C and R were similar after volume expansion in pressure responders, whereas Ea and R decreased and C increased in non-responder patients (Table 5).
Effects of neosynephrine infusion
Neosynephrine infusion induced a decrease in heart rate, stroke volume, PPV, SVV, Eadyn and C and an increase in arterial pressure (systolic, diastolic, mean and pulse pressure), Ea and R (Fig. 2b) and an increase in MAP (Table 2). Neosynephrine infusion induced a signifi-cantly larger decrease in PPV than in SVV: (− 31% (− 40
Included patients
(n=65)
Analyzed patients
(n=56)
Unanalyzable Doppler values / insufficient signal quality
(n=5)
Patients with hemodynamic instability requiring a decrease in
anesthesia drug dosage or administration of vasopressors other
than in the protocol (n=3)
Change in ventilatory setting (n=1)
Fig. 1 Flowchart of patients screened and included in the study
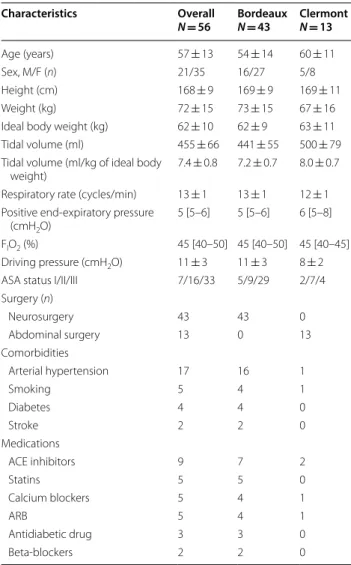
Table 1 Main characteristics of patients (n = 56)
Values are mean ± SD, or median [percentile 25–75] or number (n)
FIO2 inspired oxygen fraction, ACE angiotensin-converting enzyme, ARB
angiotensin II receptor blocker
Characteristics Overall N = 56 BordeauxN = 43 ClermontN = 13 Age (years) 57 ± 13 54 ± 14 60 ± 11 Sex, M/F (n) 21/35 16/27 5/8 Height (cm) 168 ± 9 169 ± 9 169 ± 11 Weight (kg) 72 ± 15 73 ± 15 67 ± 16
Ideal body weight (kg) 62 ± 10 62 ± 9 63 ± 11 Tidal volume (ml) 455 ± 66 441 ± 55 500 ± 79 Tidal volume (ml/kg of ideal body
weight) 7.4 ± 0.8 7.2 ± 0.7 8.0 ± 0.7 Respiratory rate (cycles/min) 13 ± 1 13 ± 1 12 ± 1 Positive end‑expiratory pressure
(cmH2O)
5 [5–6] 5 [5–6] 6 [5–8] FIO2 (%) 45 [40–50] 45 [40–50] 45 [40–45] Driving pressure (cmH2O) 11 ± 3 11 ± 3 8 ± 2
ASA status I/II/III 7/16/33 5/9/29 2/7/4 Surgery (n) Neurosurgery 43 43 0 Abdominal surgery 13 0 13 Comorbidities Arterial hypertension 17 16 1 Smoking 5 4 1 Diabetes 4 4 0 Stroke 2 2 0 Medications ACE inhibitors 9 7 2 Statins 5 5 0 Calcium blockers 5 4 1 ARB 5 4 1 Antidiabetic drug 3 3 0 Beta‑blockers 2 2 0
to − 18%)) versus − 14% (− 28 to 0%), respectively),
p < 0.0001. Baseline and changes in Eadyn after
neosyn-ephrine infusion were only related to baseline heart rate (Tables 3, 4).
Relationship between Eadyn and MAP
We observed a weak correlation between baseline Eadyn and the increase in MAP induced by volume expansion (r2 = 0.11; p = 0.01). However, there was neither any correlation between baseline Eadyn and baseline MAP values (p = 0.1) nor between changes in Eadyn and the increase in MAP associated with volume expansion.
Concerning neosynephrine infusion, there was no correlation between baseline Eadyn and baseline MAP values (p = 0.3), between baseline Eadyn and neosyn-ephrine-induced increase in MAP (p = 0.76) and between neosynephrine-induced changes in Eadyn and neosyn-ephrine-induced changes in MAP (p = 0.88).
Prediction of pressure response to volume expansion
Eadyn values before volume expansion in pressure responders and non-responders are shown in Fig. 3. Baseline Eadyn value > 0.65 before volume expansion predicted an increase ≥ 10% in MAP with a sensitivity of 76% (95% CI 53–92%) and a specificity of 60% (95% CI 42–76%) (Fig. 4). The baseline MAP value ≤ 57 mmHg predicted an increase ≥ 10% in MAP with a sensitivity of 71% (95% CI 48–89%) and a specificity of 74% (95% CI
57–88%). Gray zones ranged from 0.59 to 0.98 for Eadyn (included 52% of patients) and from 52 to 64 mmHg for MAP (including 77% of patients). The area under the ROC curve generated for baseline Eadyn (0.71, 95% CI 0.57 to 0.84) was similar to the one generated for base-line MAP (0.72, 95% CI 0.57–0.87), p = 0.89 (Fig. 4 and Table 6). Baseline Eadyn value < 0.52 was associated with a negative predictive value of 100% (positive predictive value of 48%).
Eleven patients presented an increase in stroke ume less than 10% (8% [5–9%]). When these eleven vol-ume non-responder patients were excluded, the AUC generated for Eadyn and MAP was not different from the AUC generated with all patients included (0.75, 95% CI 0.60 to 0.87 versus 0.71, 95% CI 0.57 to 0.84 (p > 0.05) and 0.75, 95% CI 0.60 to 0.86 versus 0.72, 95% CI 0.57 to 0.87, respectively (p > 0.05)). The best threshold values for Eadyn and MAP were also similar.
Discussion
This bicentre study suggests that in hypotensive and preload-responsive patients (i) both volume expansion and vasopressor infusion induced a decrease in Eadyn, (ii) very poor or no relationship was found between baseline Eadyn and changes in MAP induced by volume expan-sion or vasopressor infuexpan-sion and (iii) baseline Eadyn was moderately able to predict the increase in MAP (but not
Table 2 Hemodynamic variables before and after volume expansion/neosynephrine infusion
Values are median [percentile, 25–75]
C net arterial compliance, DAP diastolic arterial pressure, Ea arterial elastance, Eadyn dynamic arterial elastance, FTc corrected aortic flow time, MAP mean arterial
pressure, VE volume expansion, NEO neosynephrine, PP arterial pulse pressure, PPV pulse pressure variations, PV peak velocity of aortic blood flow, R arterial resistance, SAP systolic arterial pressure, SVV stroke volume variations, P1 p value of the difference obtained before and after volume expansion, P2 p value of the difference obtained before and after neosynephrine infusion
Before VE After VE P1 Before NEO After NEO P2
Heart rate (bpm) 64 [58–74] 60 [55–71] < 0.0001 60 [56–71] 57 [52–65] < 0.0001 SAP (mmHg) 80 [75–86] 83 [78–89] 0.006 80 [77–87] 102 [93–115] < 0.0001 MAP (mmHg) 59 [53–64] 63 [59–66] < 0.0001 60 [55–64] 75 [69–85] 0.0001 DAP (mmHg) 47 [43–50] 48 [43–52] 0.04 48 [43–51] 59 [54–65] < 0.0001 PP (mmHg) 32 [28–38] 35 [30–40] 0.004 34 [29–39] 44 [36–52] < 0.0001 Stroke volume (ml) 64 [54–81] 76 [63–97] < 0.0001 81 [66–96] 64 [55–82] < 0.0001 Cardiac output (l/min) 4.4 [3.5–5.3] 4.9 [3.7–6.2] < 0.0001 4.9 [4.0–6.1] 3.8 [2.9–5.0] < 0.0001
PPV (%) 12 [8–14] 8 [6–10] < 0.0001 9 [6–11] 6 [4–9] < 0.0001 SVV (%) 16 [12–22] 14 [11–17] < 0.0001 14 [10–16] 11 [8–15] 0.0005 Eadyn 0.69 [0.58–0.85] 0.59 [0.42–0.77] 0.0002 0.67 [0.48–0.80] 0.54 [0.37–0.68] < 0.0001 Ea (mmHg/ml)/SAP 1.06 [0.89–1.34] 0.91 [0.77–1.16] < 0.0001 0.90 [0.77–1.12] 1.42 [1.08–1.88] < 0.0001 Ea (mmHg/ml)/MAP 0.92 [0.69–1.11] 0.80 [0.63–0.99] < 0.0001 0.72 [0.60–0.93] 1.09 [0.89–1.53] < 0.0001 C (ml/mmHg) 2.11 [1.67–2.46] 2.33 [1.70–2.81] 0.001 2.37 [1.96–2.81] 1.57 [1.14–1.94] < 0.0001 R (mmHg/s/ml) 13.3 [10.8–16.9] 12.8 [9.6–17.3] 0.01 12.1 [9.4–14.9] 20.5 [13.7–28.1] < 0.0001 FTc (ms) 305 [269–333] 323 [291–354] < 0.0001 326 [267–351] 303 [280–333] < 0.0001 PV (cm/s) 69 [58–89] 72 [62–91] 0.0004 75 [62–94] 64 [54–77] < 0.0001
significantly different from MAP baseline values), follow-ing volume expansion.
Ea and Eadyn
The arterial load describes all the extracardiac factors opposing left ventricular ejection [28]. In clinical prac-tice, arterial load is often related to systemic vascular resistance. However, this approach does not take into account the cyclic nature of the blood pressure and flow imposed by cardiac contractions. A more accurate and precise insight of arterial load is the evaluation of aortic input impedance, but it is not feasible at the bed-side. Sunagawa proposed that a single variable called effective arterial elastance or Ea could integrate all the components of aortic impedance [29]. A dynamic and functional assessment of arterial load called dynamic arterial elastance has been proposed a few years ago. It represents the dynamic interaction between changes in
arterial pressure and stroke volume during a respiratory cycle. Several studies have evaluated this new approach, in particular the ability of Eadyn to predict an increase in arterial pressure following volume expansion. Most of these studies on patients treated with vasopressors revealed discordant results [8–13]. The originality of our study is to include mechanically ventilated patients in the operating room who are not receiving vasopressors which may alter arterial load.
Effects of volume expansion
The present study shows that in pressure responder patients, volume expansion increases stroke volume and has no effect on arterial load, leading to an increase in arterial pressure. On the other hand, in pressure non-responder patients, volume expansion increases stroke volume associated with vasodilation (shear stress) attested by an increase in arterial compliance and a decrease in resistance. Volume expansion induced a decrease in Eadyn mainly due to a larger decrease in PPV than in SVV. Changes in PPV were related to arte-rial load covariates, whereas changes in SVV were not. This may be explained by the fact that PPV was measured peripherally in a radial artery and was sensitive to arterial properties, whereas SVV was measured at the level of the descending aorta. We found that both Eadyn and PPV were related to arterial hypertension and age. This find-ing is consistent with a previous study [18] and is prob-ably related to arterial stiffness.
Eadyn and vasopressors
Using Eadyn as a physiological marker of arterial tone during vasopressor utilization seems plausible. Vasopres-sor infusion induces a systematic effect on arterial load which could be assessed by Eadyn. Some studies evalu-ated the evolution of Eadyn as an indicator of decrease in arterial pressure following a reduction in norepinephrine dosage in septic shock patients [8]. A randomized control trial demonstrated that a therapeutic protocol based on Eadyn may be an efficient guide to decrease norepineph-rine infusion in patients following cardiac surgery [9]. In the present study, we observed a significant decrease in Eadyn following neosynephrine infusion in 89% of patients. Neosynephrine infusion induces vasoconstric-tion (increase in resistance and decrease in compliance) and a decrease in both stroke volume and cardiac output. We observed that both contractility and preload param-eters were impacted. The present study was not designed to elucidate this issue. We found that arterial load and cardiac covariates have very few or no effect on the time course of Eadyn, PPV and SVV. This could be explained by the predominant effect of neosynephrine on the rest of the temporal effects.
0.0 0.2 0.4 0.6 0.8 1.0 1.2 1.4 1.6 1.8 2.0 Before
Volume Expansion Volume ExpansionAfter
Ea dy n P<0.0001 0.0 0.2 0.4 0.6 0.8 1.0 1.2 1.4 1.6 1.8 2.0 Before
NEO infusion NEO infusionAfter
Ea dy n P<0.0001
a
b
Fig. 2 a Box plot (median values, inter‑quartile range) and individual
values of dynamic arterial elastance (Eadyn) before and after volume expansion. b Box plot (median values, inter‑quartile range) and individual values of dynamic arterial elastance (Eadyn) before and after neosynephrine (NEO) infusion
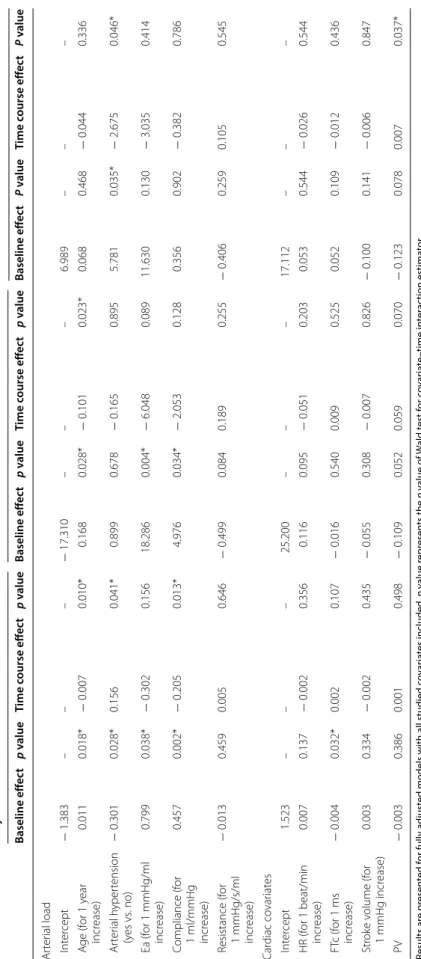
Table 3 R andom eff ec ts mo dels f or studying fac tors asso cia ted with t emp or al e volution of Eadyn, PP V and SV V during fluid challenge Results ar e pr esen ted f or fully adjust
ed models with all studied c
ov ar ia tes included . p v alue r epr esen ts the p v alue of W ald t est f or c ov ar ia te –time in ter ac tion estima tor *p v alue < 0.05 means sta tistical sig nificanc e Ea ar ter ial elastanc e, FTc c or rec ted aor tic flo w time , HR hear t r at e, PV peak v elocit y of aor
tic blood flo
w Eadyn PPV SV V Baseline eff ec t p v alue Time c ourse eff ec t p v alue Baseline eff ec t p v alue Time c ourse eff ec t p v alue Baseline eff ec t P v alue Time c ourse eff ec t P v alue Ar ter ial load Int er cept − 1.383 – – – − 17.310 – – – 6.989 – – – A ge (f or 1 y ear incr ease) 0.011 0.018* − 0.007 0.010* 0.168 0.028* − 0.101 0.023* 0.068 0.468 − 0.044 0.336 Ar ter ial h yper tension (y es vs . no) − 0.301 0.028* 0.156 0.041* 0.899 0.678 − 0.165 0.895 5.781 0.035* − 2.675 0.046* Ea (f or 1 mmHg/ml incr ease) 0.799 0.038* − 0.302 0.156 18.286 0.004* − 6.048 0.089 11.630 0.130 − 3.035 0.414 C ompliance (f or 1 ml/mmHg incr ease) 0.457 0.002* − 0.205 0.013* 4.976 0.034* − 2.053 0.128 0.356 0.902 − 0.382 0.786 R esistance (f or 1 mmHg/s/ml incr ease) − 0.013 0.459 0.005 0.646 − 0.499 0.084 0.189 0.255 − 0.406 0.259 0.105 0.545 Car diac co var iat es Int er cept 1.523 – – – 25.200 – – – 17.112 – – – HR (f or 1 beat/min incr ease) 0.007 0.137 − 0.002 0.356 0.116 0.095 − 0.051 0.203 0.053 0.544 − 0.026 0.544 FT c (f or 1 ms incr ease) − 0.004 0.032* 0.002 0.107 − 0.016 0.540 0.009 0.525 0.052 0.109 − 0.012 0.436 Str ok e v olume (f or 1 mmHg incr ease) 0.003 0.334 − 0.002 0.435 − 0.055 0.308 − 0.007 0.826 − 0.100 0.141 − 0.006 0.847 PV − 0.003 0.386 0.001 0.498 − 0.109 0.052 0.059 0.070 − 0.123 0.078 0.007 0.037*
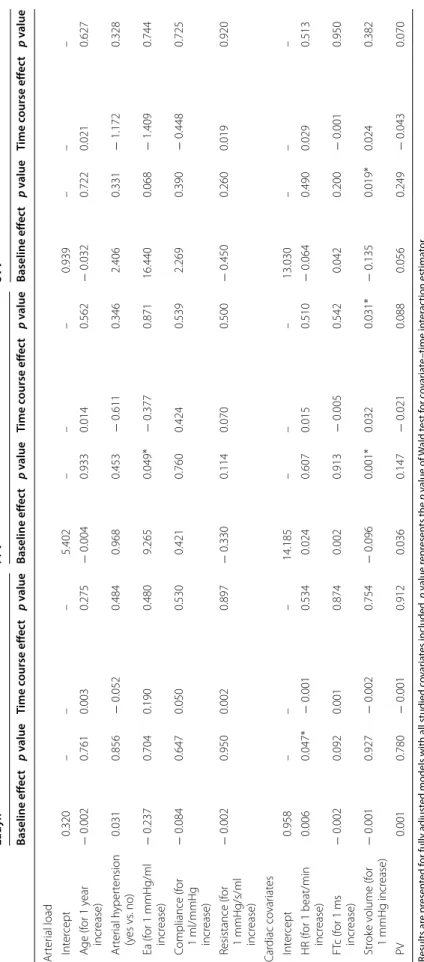
Table 4 R andom eff ec ts mo dels f or studying fac tors asso cia ted with t emp or al e volution of Eadyn, PP V and SV V during neosynephrine infusion Results ar e pr esen ted f or fully adjust
ed models with all studied c
ov ar ia tes included . p v alue r epr esen ts the p v alue of W ald t est f or c ov ar ia te –time in ter ac tion estima tor *p v alue < 0.05 means sta tistical sig nificanc e Ea ar ter ial elastanc e, FTc c or rec ted aor tic flo w time , HR hear t r at e, PV peak v elocit y of aor
tic blood flo
w Eadyn PPV SV V Baseline eff ec t p v alue Time c ourse eff ec t p v alue Baseline eff ec t p v alue Time c ourse eff ec t p v alue Baseline eff ec t p v alue Time c ourse eff ec t p v alue Ar ter ial load Int er cept 0.320 – – – 5.402 – – – 0.939 – – – A ge (f or 1 y ear incr ease) − 0.002 0.761 0.003 0.275 − 0.004 0.933 0.014 0.562 − 0.032 0.722 0.021 0.627 Ar ter ial h yper tension (y es vs . no) 0.031 0.856 − 0.052 0.484 0.968 0.453 − 0.611 0.346 2.406 0.331 − 1.172 0.328 Ea (f or 1 mmHg/ml incr ease) − 0.237 0.704 0.190 0.480 9.265 0.049* − 0.377 0.871 16.440 0.068 − 1.409 0.744 C ompliance (f or 1 ml/mmHg incr ease) − 0.084 0.647 0.050 0.530 0.421 0.760 0.424 0.539 2.269 0.390 − 0.448 0.725 R esistance (f or 1 mmHg/s/ml incr ease) − 0.002 0.950 0.002 0.897 − 0.330 0.114 0.070 0.500 − 0.450 0.260 0.019 0.920 Car diac co var iat es Int er cept 0.958 – – – 14.185 – – – 13.030 – – – HR (f or 1 beat/min incr ease) 0.006 0.047* − 0.001 0.534 0.024 0.607 0.015 0.510 − 0.064 0.490 0.029 0.513 FT c (f or 1 ms incr ease) − 0.002 0.092 0.001 0.874 0.002 0.913 − 0.005 0.542 0.042 0.200 − 0.001 0.950 Str ok e v olume (f or 1 mmHg incr ease) − 0.001 0.927 − 0.002 0.754 − 0.096 0.001* 0.032 0.031* − 0.135 0.019* 0.024 0.382 PV 0.001 0.780 − 0.001 0.912 0.036 0.147 − 0.021 0.088 0.056 0.249 − 0.043 0.070
Clinical use of Eadyn
Based on our experience, an isolated measurement of Eadyn could not inform the clinician of a possible increase in blood pressure after volume expansion. This remains true, even if we focus only on patients exhib-iting an increase in stroke volume ≥ 10% after volume expansion (n = 45). Our results are in contradiction with some previous studies [11, 12, 25]. Some of the main factors explaining these differences were the fact that our patients were neither septic nor recipients of
vasopressor treatment. This is of major importance because vasopressor infusion can alter arterial load. For example, arterial compliance does not change fol-lowing volume expansion in patients treated with
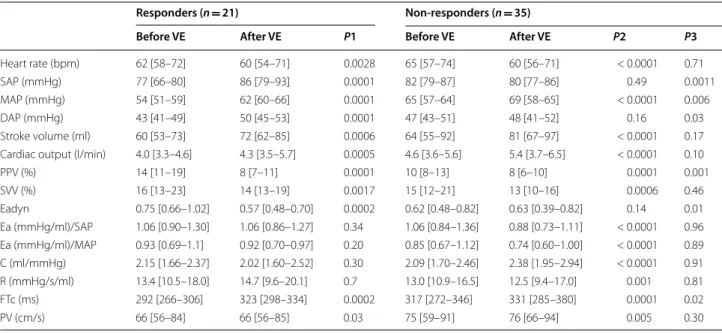
Table 5 Hemodynamic variables before and after volume expansion in responder and non-responder patients
Values are expressed as median [percentile, 25–75]
P1 difference between before and after VE in responders, P2 difference between before and after VE in responders, P3 difference between responders and
non-responders before volume expansion, non-responders MAP increase ≥ 10% after volume expansion, C net arterial compliance, DAP diastolic arterial pressure, Ea effective arterial elastance, Eadyn dynamic arterial elastance, FTc corrected aortic flow time, MAP mean arterial pressure, VE volume expansion, NEO neosynephrine, PP arterial pulse pressure, PPV pulse pressure variations, PV peak velocity of aortic blood flow, R arterial resistance, SAP systolic arterial pressure, SVV stroke volume variations
Responders (n = 21) Non-responders (n = 35)
Before VE After VE P1 Before VE After VE P2 P3
Heart rate (bpm) 62 [58–72] 60 [54–71] 0.0028 65 [57–74] 60 [56–71] < 0.0001 0.71
SAP (mmHg) 77 [66–80] 86 [79–93] 0.0001 82 [79–87] 80 [77–86] 0.49 0.0011
MAP (mmHg) 54 [51–59] 62 [60–66] 0.0001 65 [57–64] 69 [58–65] < 0.0001 0.006
DAP (mmHg) 43 [41–49] 50 [45–53] 0.0001 47 [43–51] 48 [41–52] 0.16 0.03
Stroke volume (ml) 60 [53–73] 72 [62–85] 0.0006 64 [55–92] 81 [67–97] < 0.0001 0.17 Cardiac output (l/min) 4.0 [3.3–4.6] 4.3 [3.5–5.7] 0.0005 4.6 [3.6–5.6] 5.4 [3.7–6.5] < 0.0001 0.10
PPV (%) 14 [11–19] 8 [7–11] 0.0001 10 [8–13] 8 [6–10] 0.0001 0.001 SVV (%) 16 [13–23] 14 [13–19] 0.0017 15 [12–21] 13 [10–16] 0.0006 0.46 Eadyn 0.75 [0.66–1.02] 0.57 [0.48–0.70] 0.0002 0.62 [0.48–0.82] 0.63 [0.39–0.82] 0.14 0.01 Ea (mmHg/ml)/SAP 1.06 [0.90–1.30] 1.06 [0.86–1.27] 0.34 1.06 [0.84–1.36] 0.88 [0.73–1.11] < 0.0001 0.96 Ea (mmHg/ml)/MAP 0.93 [0.69–1.1] 0.92 [0.70–0.97] 0.20 0.85 [0.67–1.12] 0.74 [0.60–1.00] < 0.0001 0.89 C (ml/mmHg) 2.15 [1.66–2.37] 2.02 [1.60–2.52] 0.30 2.09 [1.70–2.46] 2.38 [1.95–2.94] < 0.0001 0.91 R (mmHg/s/ml) 13.4 [10.5–18.0] 14.7 [9.6–20.1] 0.7 13.0 [10.9–16.5] 12.5 [9.4–17.0] 0.001 0.81 FTc (ms) 292 [266–306] 323 [298–334] 0.0002 317 [272–346] 331 [285–380] 0.0001 0.02 PV (cm/s) 66 [56–84] 66 [56–85] 0.03 75 [59–91] 76 [66–94] 0.005 0.30 0.0 0.2 0.4 0.6 0.8 1.0 1.2 1.4 1.6 1.8 2.0 Non-Responders Responders Eady n 0.65
Fig. 3 Box plot (median values, inter‑quartile range) and individual
values of dynamic arterial elastance (Eadyn) before and after volume expansion in pressure responders (volume expansion induced increase in mean arterial pressure ≥ 10%) and pressure non‑responders 0 20 40 60 80 100 0 20 40 60 80 100 100-Specificity Se ns itiv ity Eadyn MAP
Fig. 4 Receiver‑operating characteristic curves showing the ability
of baseline dynamic arterial elastance (Eadyn) and baseline mean arterial pressure (MAP) to predict an increase in MAP ≥ 10% following volume expansion
norepinephrine, whereas it improves after volume expansion in patients free of norepinephrine. Such alterations may explain in part our results. Our find-ings suggest that Eadyn was not helpful to predict an increase in arterial pressure after volume expansion in mechanically ventilated, preload-responsive and vaso-pressor-free patients in the operating room.
Limitations
Our study presents several limitations: First, we did not randomize the order of volume expansion and neosyn-ephrine infusion (all patients received volume expan-sion before vasopressor infuexpan-sion) and we only recorded the first volume expansion and the first vasopressor infusion done in each patient. Second, according to local practices, we chose neosynephrine and not nor-epinephrine despite recent data suggesting the possi-ble superiority of norepinephrine over neosynephrine in patients under general anesthesia in the operating room [30–32]. Third, the two linear mixed models show very different effects of hemodynamic covariates on the time course of Eadyn, PPV and SVV. In the two models, effects remained very low due to a foreseeable lack of power related to a low sample size.
Conclusion
To conclude, in this bicentre and prospective study, we observed that (i) neosynephrine infusion induced a decrease in Eadyn in a very large proportion of patients, whereas volume expansion induced a decrease in Eadyn in only two-thirds of patients, and (ii) Eadyn was poorly able to predict any increase in mean arterial pressure following volume expansion or neosynephrine infusion. Eadyn seems to be a sensitive marker of arterial tone changes following vasopressor infusion.
Abbreviations
Ea: arterial elastance; Eadyn: dynamic arterial elastance; MAP: mean arterial pressure; PPV: pulse pressure variations; ROC: receiver‑operating characteris‑ tics; SVV: stroke volume variations.
Acknowledgements
Authors thank Karène LEFONDRE, PhD, Biostatistician, Bordeaux University, INSERM 1219, for statistical advises.
Authors’ contributions
HdC included patients, collected the data, helped analyze the data and helped write the manuscript. PB, RG, RL helped include patients, helped analyze the data and helped write the manuscript. MS helped analyze the data and helped write the manuscript and corrected the English. KNG helped design the study and helped write the manuscript. EF and MB designed the study, collected the data, performed statistical analysis and wrote the manuscript. All authors read and approved the final manuscript.
Funding
This study was supported from institutional and departmental sources. Availability of data and materials
Data are available from the authors on reasonable request. Ethics approval and consent to participate
The present study was approved by the Institutional Review Board (Comité de Protection des Personnes Sud‑Ouest et Outre Mer III, Bordeaux, France N° DC2016/125).
Consent for publication
The manuscript has been read and its submission approved by all co‑authors. Patients were prospectively included after informed consent from the patient’s next of kin.
Competing interests
Pr Biais received honoraria from Edwards Lifesciences and Pulsion Medical Sys‑ tem for lectures. Pr Futier received honoraria from Dräger and GE Healthcare for lectures. Other authors have no competing interests.
Author details
1 Department of Anesthesiology and Critical Care, Pellegrin Bordeaux
University Hospital, 33000 Bordeaux, France. 2 Department of Anesthesiology
and Critical Care, Clermont‑Ferrand University Hospital, 63003 Clermont‑Fer‑ rand Cedex 1, France. 3 INSERM, U12‑11, Laboratoire de Maladies Rares: Géné‑
tique et Métabolisme (MRGM), Bordeaux, France. 4 Équipe R2D2 EA‑7281/
Faculté de Médecine/Université d’Auvergne, University of Clermont‑Ferrand, 63000 Clermont‑Ferrand, France. 5 INSERM, U1034, Biology of Cardiovascular
Diseases, 33600 Pessac, France.
Received: 29 November 2018 Accepted: 26 September 2019
References
1. Hsieh JK, Dalton JE, Yang D, Farag ES, Sessler DI, Kurz AM. The association between mild intraoperative hypotension and stroke in general surgery patients. Anesth Analg. 2016;123(4):933–9.
2. Maheshwari A, McCormick PJ, Sessler DI, Reich DL, You J, Mascha EJ, et al. Prolonged concurrent hypotension and low bispectral index (‘double
Table 6 Ability to predict the increase in mean arterial pressure ≥ 10% after infusion of 250 ml saline over 10 min
The best threshold value was determined using Youden Index Youden Index J = Sensitivity + Specificity − 1
AUROC area under receiver-operating characteristic curves, 95% CI 95% confidence interval, Eadyn dynamic arterial elastance, MAP mean arterial pressure, +LR
positive likelihood ratio, −LR negative likelihood ratio
Variable Best threshold AUROC (95% CI) Sensitivity (95% CI) Specificity (95% CI) Youden Index J +LR −LR
Eadyn > 0.65 0.71 (0.57–0.82) 76 (53–92) 60 (42–76) 0.36 1.9 (1.2–3.1) 0.4 (0.2–0.9) MAP (mmHg) ≤ 57 0.72 (0.58–0.83) 71 (48–89) 74 (57–88) 0.46 2.8 (1.5–5.2) 0.4 (0.2–0.8)
low’) are associated with mortality, serious complications, and prolonged hospitalization after cardiac surgery. Br J Anaesth. 2017;119(1):40–9. 3. Salmasi V, Maheshwari K, Yang D, Mascha EJ, Singh A, Sessler DI, et al.
Relationship between intraoperative hypotension, defined by either reduction from baseline or absolute thresholds, and acute kidney and myocardial injury after noncardiac surgery: a retrospective cohort analy‑ sis. Anesthesiology. 2017;126(1):47–65.
4. Yang X, Du B. Does pulse pressure variation predict fluid responsiveness in critically ill patients? A systematic review and meta‑analysis. Crit Care Lond Engl. 2014;18(6):650.
5. Marik PE, Cavallazzi R, Vasu T, Hirani A. Dynamic changes in arterial waveform derived variables and fluid responsiveness in mechanically ventilated patients: a systematic review of the literature. Crit Care Med. 2009;37(9):2642–7.
6. Biais M, Ouattara A, Janvier G, Sztark F. Case scenario: respiratory varia‑ tions in arterial pressure for guiding fluid management in mechanically ventilated patients. Anesthesiology. 2012;116(6):1354–61.
7. Pinsky MR. Heart lung interactions during mechanical ventilation. Curr Opin Crit Care. 2012;18(3):256–60.
8. Guinot P‑G, Bernard E, Levrard M, Dupont H, Lorne E. Dynamic arterial elastance predicts mean arterial pressure decrease associated with decreasing norepinephrine dosage in septic shock. Crit Care Lond Engl. 2015;19:14.
9. Guinot P‑G, Abou‑Arab O, Guilbart M, Bar S, Zogheib E, Daher M, et al. Monitoring dynamic arterial elastance as a means of decreasing the duration of norepinephrine treatment in vasoplegic syndrome follow‑ ing cardiac surgery: a prospective, randomized trial. Intensiv Care Med. 2017;43(5):643–51.
10. Wu C, Cheng Y, Liu Y, Wu T, Chien C, Chan K, et al. Predicting stroke vol‑ ume and arterial pressure fluid responsiveness in liver cirrhosis patients using dynamic preload variables: a prospective study of diagnostic accuracy. Eur J Anaesthesiol. 2016;33(9):645–52.
11. Vos JJ, Kalmar AF, Struys MMRF, Wietasch JKG, Hendriks HGD, Scheeren TWL. Comparison of arterial pressure and plethysmographic waveform‑ based dynamic preload variables in assessing fluid responsiveness and dynamic arterial tone in patients undergoing major hepatic resection. Br J Anaesth. 2013;110(6):940–6.
12. Lanchon R, Nouette‑Gaulain K, Stecken L, Sesay M, Lefrant J‑Y, Biais M. Dynamic arterial elastance obtained using arterial signal does not predict an increase in arterial pressure after a volume expansion in the operating room. Anaesth Crit Care Pain Med. 2017;36(6):377–82.
13. Monge García MI, Romero MG, Cano AG, Aya HD, Rhodes A, Grounds RM, et al. Dynamic arterial elastance as a predictor of arterial pressure response to fluid administration: a validation study. Crit Care Lond Engl. 2014;18(6):626.
14. Cecconi M, Monge García MI, Gracia Romero M, Mellinghoff J, Caliandro F, Grounds RM, et al. The use of pulse pressure variation and stroke volume variation in spontaneously breathing patients to assess dynamic arterial elastance and to predict arterial pressure response to fluid administration. Anesth Analg. 2015;120(1):76–84.
15. Seo H, Kong Y‑G, Jin S‑J, Chin J‑H, Kim H‑Y, Lee Y‑K, et al. Dynamic arte‑ rial elastance in predicting arterial pressure increase after fluid chal‑ lenge during robot‑assisted laparoscopic prostatectomy: a prospective observational study. Medicine. 2015;94(41):e1794.
16. Monge García MI, Gil Cano A, Gracia Romero M. Dynamic arterial elastance to predict arterial pressure response to volume loading in preload‑dependent patients. Crit Care Lond Engl. 2011;15(1):R15.
17. Guarracino F, Bertini P, Pinsky MR. Cardiovascular determinants of resuscitation from sepsis and septic shock. Crit Care. 2019;23(1):118. 18. Stens J, Oeben J, Van Dusseldorp AA, Boer C. Non‑invasive measure‑
ments of pulse pressure variation and stroke volume variation in anesthetized patients using the Nexfin blood pressure monitor. J Clin Monit Comput. 2016;30(5):587–94.
19. Michard F, Boussat S, Chemla D, Anguel N, Mercat A, Lecarpentier Y, et al. Relation between respiratory changes in arterial pulse pressure and fluid responsiveness in septic patients with acute circulatory failure. Am J Respir Crit Care Med. 2000;162(1):134–8.
20. Guinot P‑G, de Broca B, Bernard E, Abou Arab O, Lorne E, Dupont H. Respiratory stroke volume variation assessed by oesophageal Doppler monitoring predicts fluid responsiveness during laparoscopy. Br J Anaesth. 2014;112(4):660–4.
21. Chemla D, Hébert JL, Coirault C, Zamani K, Suard I, Colin P, et al. Total arterial compliance estimated by stroke volume‑to‑aortic pulse pres‑ sure ratio in humans. Am J Physiol. 1998;274:H500–5.
22. Jozwiak M, Millasseau S, Richard C, Monnet X, Mercado P, Dépret F, et al. Validation and critical evaluation of the effective arterial elastance in critically ill patients. Crit Care Med. 2019;47(4):e317–24.
23. Monge Garcia MI, Jian Z, Settels JJ, Hatib F, Cecconi M, Pinsky MR. Reli‑ ability of effective arterial elastance using peripheral arterial pressure as surrogate for left ventricular end‑systolic pressure. J Clin Monit Comput. 2018. https ://doi.org/10.1007/s1087 7‑018‑0236‑y. 24. DeLong ER, DeLong DM, Clarke‑Pearson DL. Comparing the areas
under two or more correlated receiver operating characteristic curves: a nonparametric approach. Biometrics. 1988;44(3):837–45.
25. Biais M, Ehrmann S, Mari A, Conte B, Mahjoub Y, Desebbe O, et al. Clinical relevance of pulse pressure variations for predicting fluid responsiveness in mechanically ventilated intensive care unit patients: the grey zone approach. Crit Care Lond Engl. 2014;18(6):587. 26. Ray P, Le Manach Y, Riou B, Houle TT. Statistical evaluation of a bio‑
marker. Anesthesiology. 2010;112(4):1023–40.
27. Molenberghs G, Verbeke G. Linear mixed models for longitudinal data. Berlin: Springer; 2000.
28. Monge García MI, Saludes Orduña P, Cecconi M. Understanding arterial load. Intensiv Care Med. 2016;42(10):1625–7.
29. Sunagawa K, Maughan WL, Burkhoff D, Sagawa K. Left ventricular interaction with arterial load studied in isolated canine ventricle. Am J Physiol. 1983;245:H773–80.
30. Rebet O, Andremont O, Gérard J‑L, Fellahi J‑L, Hanouz J‑L, Fischer M‑O. Preload dependency determines the effects of phenylephrine on cardiac output in anaesthetised patients: a prospective observational study. Eur J Anaesthesiol. 2016;33(9):638–44.
31. Cannesson M, Jian Z, Chen G, Vu TQ, Hatib F. Effects of phenylephrine on cardiac output and venous return depend on the position of the heart on the Frank‑Starling relationship. J Appl Physiol. 2012;113(2):281–9. 32. Goertz AW, Schmidt M, Seefelder C, Lindner KH, Georgieff M. The effect
of phenylephrine bolus administration on left ventricular function during isoflurane‑induced hypotension. Anesth Analg. 1993;77(2):227–31.
Publisher’s Note
Springer Nature remains neutral with regard to jurisdictional claims in pub‑ lished maps and institutional affiliations.