HAL Id: hal-02434348
https://hal.archives-ouvertes.fr/hal-02434348
Submitted on 9 Jan 2020
HAL is a multi-disciplinary open access
archive for the deposit and dissemination of sci-entific research documents, whether they are pub-lished or not. The documents may come from teaching and research institutions in France or abroad, or from public or private research centers.
L’archive ouverte pluridisciplinaire HAL, est destinée au dépôt et à la diffusion de documents scientifiques de niveau recherche, publiés ou non, émanant des établissements d’enseignement et de recherche français ou étrangers, des laboratoires publics ou privés.
Corporate social responsibility and bank efficiency
Sanaa Belasri, Mathieu Gomes, Guillaume Pijourlet
To cite this version:
Sanaa Belasri, Mathieu Gomes, Guillaume Pijourlet. Corporate social responsibility and bank efficiency. Journal of Multinational Financial Management, Elsevier, In press, �10.1016/j.mulfin.2020.100612�. �hal-02434348�
Corporate social responsibility and bank efficiency
Sanaa Belasri
Universit´e Clermont Auvergne, CleRMa, 11 bd Charles de Gaulle, 63000 Clermont-Ferrand, France. Mathieu Gomes∗
Universit´e Clermont Auvergne, CleRMa, 11 bd Charles de Gaulle, 63000 Clermont-Ferrand, France. Guillaume Pijourlet
Universit´e Clermont Auvergne, CleRMa, 11 bd Charles de Gaulle, 63000 Clermont-Ferrand, France.
Abstract
Banks play a predominant role in the economy and are subject to growing expectations from stakeholders. It is therefore important to understand the financial impact of CSR on banks’ activities. This article examines the impact of CSR on bank efficiency by using a DEA Dynamic Network Model. Based on an international sample of 184 banks in 41 countries over the 2009-2015 period, our empirical investigation reveals a positive impact of CSR on bank efficiency. We further show that this relationship is contingent upon the institutional context. Specifically, we find that CSR has a positive impact on bank efficiency only in developed countries, in countries where investor protection is high and in countries featuring a high degree of stakeholder orientation. We thus assert that some institutional characteristics must be present for the positive impact of CSR on bank efficiency to materialize.
Keywords: Corporate social responsibility (CSR), Banking efficiency, Data envelopment analysis (DEA)
An ulterior version of this paper has been published in Journal of Multinational Financial Management. DOI: https://doi.org/10.1016/j.mulfin.2020.100612
∗Corresponding author
Email addresses: [email protected] (Sanaa Belasri), [email protected] (Mathieu Gomes), [email protected] (Guillaume Pijourlet)
1. Introduction
The question of whether adopting corporate social responsibility (CSR, henceforth) can improve a firm’s financial standing has been the subject of various academic investigations. Existing studies show that CSR impacts the financial performance of firms (Lins et al., 2017), their market value (Ding et al., 2016; Ferrell et al., 2016), and their financial risk (Kim et al., 2014). In spite of an important body of research, whether shareholders’ interests are consistent with those of other stakeholders is still up for debate. Conflicting results could be attributed to the fact that the motives underlying firms’ engagement in CSR could influence the way CSR impacts performance (Wu and Shen, 2013). Ambiguous results may also come from the fact that the financial consequences of CSR could be sector-specific (Esteban-Sanchez et al., 2017).
In the wake of the 2008-2009 financial crisis, in which the behavior of financial institutions has been questionned, various scholars have attempted to specifically study CSR in the banking sector. This focus is interesting for various reasons. First, banks are key elements in an economy. They play an important role in economic development and may create several external benefits to society (Shen and Lee, 2006). By facilitating the transfer of resources between lenders and borrowers, they contribute to sustained prosperity (King and Levine, 1993). Second, compared to other sectors, banks are subject to particularly stringent expectations in terms of providing feedback to stakeholders such as governments, media, or communities (Wu and Shen, 2013). Because banks benefit substantially from society (e.g., through government garanties or even bailouts (Iannotta et al., 2013)), public opinion often stresses the need for them to engage in CSR (Shen et al., 2016). That being said, the impact of CSR on banks’ profitability remains controversial. On the one hand, banks may be reluctant to engage in CSR because of the costs associated with the implementation of CSR policies. On the other hand, CSR could also have a positive impact on financial performance through its positive impact on reputation. Third, understanding the impact of CSR in the banking sector is especially important given the fact that banks are often excluded from samples in empirical work due to their special characteristics (e.g., reporting and accounting requirements, specific regulatory framework). As a result, studies linking CSR to finance generally do not assess the banking sector (Finger et al., 2018).
Some authors have tried to empirically assess the relationship between CSR and banks’ profitability. They tend to show a positive link between CSR and some bank profitability indicators such as return on assets or return on equity (Nizam et al., 2019; Wu and Shen, 2013; Shen et al., 2016; Wu et al., 2017). However, using ratios to assess the performance of banks has some limitations. Indeed, the univariate nature of ratio analysis may be problem-atic when analyzing complex multidimensional organizations, such as banks, which produce multiple outputs using multiple inputs. To circumvent the shortcomings of ratio analysis, most studies focusing on bank performance make use of efficiency frontier techniques (Berger and Humphrey, 1997). Among the available modeling techniques in the banking sector, Data Envelopment Analysis (DEA, henceforth) is probably the most successfully used operational research technique in assessing bank performance (Fethi and Pasiouras, 2010).
In this paper, we use the DEA Dynamic Network Model to evaluate bank efficiency and study how it is impacted by CSR. Using an international sample of 184 banks in 41 countries over the 2009-2015 period, we find that the CSR of banks is positively related to their efficiency. Specifically, we show that a unit-increase in a bank’s CSR score is associated with a 0.13 percentage point increase in its efficiency. We further show that the positive impact of CSR on bank efficiency is contingent upon various economic and institutional factors. Specifically, it appears that CSR only increases bank efficiency in developed countries while it has no impact on efficiency for banks located in developing countries. It also appears that the CSR-efficiency relationship only holds in countries featuring a high level of investor protection. Finally, we find that a high degree of country stakeholder orientation is necessary for the CSR-efficiency link to materialize.
Our contribution to the literature is manifold. First, we explore a microeconomic measure of bank performance: technical efficiency. The existing literature examines the link between CSR and financial performance through an analysis of performance ratios. However, the analysis of ratios is limited and incomplete as it focuses on a part of business activity using very few variables. Technical efficiency, unlike ratios, enables a large number of variables to interact and provides a multidimensional analysis of the company’s performance. It analyzes the performance at all stages in the bank’s production process. In our study, we measure efficiency using the DEA method to identify benchmark banks that have the best practices
as well as banks that need to improve the management of their inputs and outputs. Second, we apply the DEA Dynamic Network (DEA-DN, henceforth) model to estimate efficiency scores. Most previous studies estimate efficiency using a basic DEA model that focuses on a single period. This can be a significant limitation, especially for the banking industry. Indeed, the basic DEA model does not enable the dynamic effect of performance over time to be traced (Tsionas et al., 2015). When the network and dynamic models are combined, a more comprehensive analysis is obtained since the model takes into account the dynamic change in efficiency between two periods and estimates the efficiency of each sub-process in the production process. This method is the most appropriate when it comes to assessing the performance of banks that implement CSR policies since the performance of these activities are seen over the long term and DEA-DN provides just this long-term assessment. Third, we study an international sample of banks. This allows us to differentiate between developed and developing countries. In doing so, our study follows the work of Finger et al. (2018). However, our study differs from theirs in various respects. First, we use technical efficiency as a performance measure instead of univariate measures (e.g., ROE, ROA, NII). Second, we measure the impact of actual CSR performance while they study the impact of adopting the Equator Principles (EP). These are very different indicators especially given the fact that adopting EP can be a form of greenwashing (Finger et al., 2018). Finally, the international nature of our study also enables us to assess the extent to which countries’ institutional environment and stakeholder orientation shape the CSR-efficiency relationship.
Our paper proceeds as follows. Section 2 presents an overview of CSR in the banking sector and develops the hypotheses. Section 3 provides a description of the data, control variables and methodology. Section 4 discusses the results. Section 5 concludes.
2. CSR and bank efficiency: theory and hypotheses
CSR has been discussed in academic studies for decades. The debate focuses on why firms would invest significant resources on CSR activities and features two conflicting views. The shareholder view stems from neoclassical economic theory according to which the only responsibility of corporate managers should be to maximize profit (Friedman, 1970) within the boundaries of what is permitted by the law. Similarly, Levitt (1958) criticizes
beyond-compliance actions by firms, considering their sole responsibilities to be “to obey the ele-mentary canons of everyday face-to-face civility and to seek material gain”. According to this view, resources used for CSR purposes are wasted and should therefore be reallocated toward firm value-maximizing projects. On the other hand, the stakeholder view (Freeman, 1984; Porter and Kramer, 2006) suggests that ethical behavior and profit are not mutually exclusive and that acting in all stakeholders’ interests ultimately increases performance.
In light of this theoretical debate, numerous studies have tried to empirically assess the link between CSR performance and financial performance. Overall, although a majority of studies suggest a positive relationship between CSR and financial performance1, results remain ambiguous. This ambiguity may come from the fact that the impact of CSR on financial performance may be sector-specific (Esteban-Sanchez et al., 2017). Recently, some scholars have started to specifically study the consequences of CSR in the banking sector. Simpson and Kohers (2002) investigate a sample of US national banks and conclude to a positive relationship between social and financial performance. Using international samples, Wu and Shen (2013), Shen et al. (2016), Esteban-Sanchez et al. (2017), Wu et al. (2017), and Nizam et al. (2019) confirm these findings and show that the CSR of banks is positively associated with their financial performance as proxied by traditional metrics (i.e., ROA, ROE, NII).
However, using univariate measures to assess the performance of banks has some limi-tations as it may be problematic when analyzing complex multidimensional organizations which produce multiple outputs using multiple inputs. This is why, when analyzing bank performance, most studies use the concept of efficiency. Efficiency is a measure of the extent to which inputs are well used for an intended output.
There are various reasons suggesting CSR activities could have an impact a bank’s inputs and outputs, and as a result on bank efficiency. Indeed, CSR activities can help firms build a strong reputation (Branco and Rodrigues, 2006; Hillman and Keim, 2001) which can in turn provide many benefits such as an increased ability to attract and retain valuable employees (Branco and Rodrigues, 2006; Fombrun et al., 2000; Turban and Greening, 1997). Increased
employee productivity and loyalty are associated with a better management of human capital resources or, from an efficiency perspective, a better use (processing) of inputs. In addition, customers may be willing to accept a lower rate on their deposits if it comes from a bank with strong CSR features (Wu and Shen, 2013). The lower cost of deposits, from the bank’s perspective, is akin to a reduction in the cost of inputs.
A strong CSR performance –and the enhanced reputation that comes with it– also has the potential to increase customer loyalty (Fombrun et al., 2000) and draw customers away from competitors. In addition, increased reputation resulting from CSR activities can provide firms with the ability to price products less agressively (Fombrun et al., 2000). In the case of banks, a good reputation could therefore increase profit by enabling banks to attract new customers and charge higher interests on their loans. Indeed, Kim et al. (2005) state that firms favor borrowing from banks with a good reputation even if they have to pay higher loan rates. In addition, a strong CSR-induced reputation can also provide banks with the ability to charge higher fees and commissions on other services (Wu and Shen, 2013). This expected positive impact of CSR on both interest and non-interest income indicates that CSR could increase a bank’s outputs. Consequently, we formulate the following hypothesis:
H1 The CSR of banks positively impacts their efficiency.
The degree of economic development may also influence how CSR affects a firm’s revenue (Wang et al., 2016). In developed countries, non-financial stakeholders such as customers, employees or NGOs are more sensitive to the CSR commitment of banks because of their increased awareness of social and environmental concerns. Inglehart (1990) explains that a culture shift has occurred in developed countries “leading to a de-emphasis of economic growth as a dominant goal of society, and the decline of economic criteria as the implicit standard of rational behavior”. He further argues that the satisfaction of basic materials needs fosters the emergence of post-materialist values potentially linked with environmen-tal protection, workplace well-being, etc. For instance, it is argued that a minimum level of wealth is necessary for individuals to express a preference for environment preservation (Berthe and Elie, 2015; Scruggs, 1998).We thus assert that CSR policies in developed coun-tries are more likely to help banks build a good reputation which in turn can increase their
efficiency through better human capital management and improved pricing power. Therefore, we formulate the following hypothesis:
H2 The CSR-bank efficiency link is stronger in developed countries.
Countries that are similar in terms of economic development can nonetheless feature different institutional contexts. Hence, we also want to evaluate whether the quality of institutions shapes the impact of CSR on bank efficiency. According to the shareholder view of CSR, CSR activities may represent a waste of financial resources, potentially leading to a decrease in efficiency. For some authors, CSR policies could be used by managers as a means to extracting private benefits such as personal reputation (Barnea and Rubin, 2010; Brown et al., 2006; Chahine et al., 2019) and increased power within the firm (Cespa and Cestone, 2007; Surroca and Trib´o, 2008). Hence, it appears that managers could possibly conduct CSR policies to benefit their own interests rather than to increase shareholder value. However, it has been shown that legal institutions shape the potential impact of CSR policies on firm value (Arouri and Pijourlet, 2017). If legal institutions are strong, shareholders have less difficulty to enforce their rights and they can more easily make sure CSR policies are not used by managers to maximize their own utility. We thus expect the positive effect of CSR on bank efficiency to be stronger in countries where investor protection is high since banks’ managers are more likely to implement CSR policies to increase efficiency and not to extract private benefits. Consequently, we formulate the following hypothesis:
H3 The CSR-efficiency link is stronger in countries where investor protection is high.
Finally, a country’s stakeholder orientation may also influence the CSR-efficiency rela-tionship. Differences between countries in terms of institutional and social values may ex-plain differences concerning the relationship between firms and their stakeholders (Van der Laan Smith et al., 2005). National legal environments related to stakeholders’ protection or labor unions exert an influence on the extent to which CSR-related rules are enforced (Dhali-wal et al., 2014). CSR-related institutions thus encourage managers to take into account the expectations of stakeholders by reinforcing the legitimacy of non-financial stakehold-ers’ claims and enhancing stakeholdstakehold-ers’ power (Dhaliwal et al., 2014; Van der Laan Smith
et al., 2005). Consequently, we can expect the consideration of stakeholders’ interests to be more important for banks in countries where stakeholder orientation is high. Therefore, we formulate the following hypothesis:
H4 The CSR-efficiency link is stronger in countries where stakeholder orientation is high.
3. Data and methodology
3.1. Sample selection
To create our international sample, we rely on the Sustainalytics database. Specifically, we include in our sample all banks covered by Sustainalytics for which the necessary financial variables are available in the Datastream database. This requirement reduces the number of banks to 184. Overall, our final sample comprises 184 banks from 41 countries from 2009 to 2015, yielding an unbalanced panel of 937 firm-year observations. Table 1 reports our sample distribution across country.
3.2. Bank efficiency
Following previous literature (Avkiran, 2009; Tone and Tsutsui, 2009), we use the DEA Solver Pro software to obtain efficiency scores. Efficiency values range from 0 to 100%. A score of 100% implies that the bank is efficient and is located on the efficient frontier. A score lower than 100% denotes inefficiency, i.e., that the bank must decrease its inputs and/or increase its outputs.
Specifically, efficiency is a microeconomic measure of productivity that evaluates the production process taking into account the volume of inputs and outputs. The concept of Pareto-Koopmans efficiency states ”a production is fully efficient, if and only if, it is impossible to improve any input and output without reducing any other inputs or outputs” (Cooper et al., 2006). A firm is considered efficient when it lies on the production frontier where it is unable to increase the output level produced for a given input level, or to reduce the level of resources consumed to produce a given quantity of output.
There are parametric and nonparametric methods for estimating frontier efficiency. The non-parametric method is recognized as being a better and more robust efficiency analysis tool since it uses actual data from assessed units to construct the efficiency frontier without
Table 1: Distribution across countries
Country Number of banks
Australia 5 Austria 5 Belgium 1 Brazil 6 Chile 4 China 10 Denmark 3 Egypt 2 France 4 Germany 1 Hong Kong 5 Hungary 1 India 12 Indonesia 5 Israel 4 Italy 7 Kenya 1 Malaysia 7 Mexico 1 Netherlands 1 Nigeria 2 Norway 4 Oman 1 Pakistan 2 Peru 2 Philippines 3 Poland 5 Portugal 1 Qatar 5 Russia 1 Saudi Arabia 1 Singapore 3 South Africa 2 Spain 5 Sweden 3 Switzerland 2 Thailand 6 Turkey 6
United Arab Emirates 7
United Kingdom 5
United States 33
setting up a specific functional form. The main advantage of this method is that it allows for the accounting of multiple inputs and outputs. Among the non-parametric approaches, the method which is most often used is Data Envelopment Analysis (DEA). DEA makes use of linear programming for the development of production frontiers and the measurement of efficiency relative to the developed frontiers (Charnes et al., 1978). The efficiency production frontier for a sample of decision-making units (DMUs), i.e., banks in our case, is constructed through a piecewise linear combination of an actual input–output correspondence set that envelops the input–output correspondence of all DMUs in the sample (Thanassoulis, 2001). Each DMU is assigned an efficiency score that ranges between 0 and 100%, with 100% indicating an efficient DMU with respect to the other DMUs in the sample.
The two main drawbacks of traditional DEA is that 1) the model does not take into account the internal structure of DMUs and that 2) it does not evaluate the performance of DMUs over the long term (i.e., it neglects the impact of carry-over). Non-performing loans represent the main example of carry-overs for banks. To address these shortcomings, authors (Tone and Tsutui, 2014) have developed the DEA Dynamic Network (DEA-DN). Because the returns from CSR activities appear over the long term, we use the DEA-DN model in this study to help assess the operational performance of CSR banks from a multi-period perspective.
3.3. Inputs and outputs
There are contradicting views in the literature as to the role deposits play in bank ef-ficiency. Some studies report that banks adopt a production approach and deposits are treated as outputs (producing deposits using capital and labor), while other studies consider deposits as inputs with banks playing an intermediation role, i.e., converting deposits re-ceived into loans and securities (Paradi and Zhu, 2013). Neither the production approach nor intermediation approach alone can fully capture financial activities as a whole (Berger and Humphrey, 1997). The DEA-DN model integrates both production and intermediation approaches. This model considers deposits to be intermediate products, they are outputs from the first production stage and inputs into the second stage. We follow Fukuyama and Weber (2010) to select inputs, outputs, intermediate products (link) and carry-over variables
for our study. In the first stage, we select staff costs, fixed assets and equity as inputs. These inputs are used to produce deposits. In the second stage, deposits are used to generate loans and securities. Among these outputs are non-performing loans (NPL). These are undesirable inputs (carry-over) for the following year. These loans cannot be fully or partially repaid by the borrowers and large amounts of these loans require larger amounts of other inputs (equity) to offset their negative effect (Fukuyama and Weber, 2015).
Depending on their management strategy, managers may choose to adopt an input bias (decreasing the amount of input while maintaining the same quantity of output) or an output bias (increasing output while maintaining the amount of input). Following Kao and Hwang (2011), we apply an input bias to decrease NPL. In the second stage, we apply an output bias to increase outputs. Those biases will treat the link variable in a coordinated way. We note that our model assumes variable returns to scale (VRS) for production. The VRS assumption is more appropriate in banking efficiency assessment than the assumption of constant returns to scale as the banking industry comprises banks of varying sizes operating in different markets (Avkiran, 2015; Wang et al., 2014).
3.4. Corporate social responsibility
CSR data come from the Sustainalytics2 database. Sustainalytics is a provider of
envi-ronmental, social and governance assesment for responsible investment all over the globe. For each firm analyzed, Sustainalytics generates a profile of the organization’s CSR and compiles these profiles in a stepwise approach. First, it scrutinizes relevant organizational information from multiple sources such as financial accounts, organizational documentation, media reports and interviews with stakeholders. This results in a preliminary report on a firm’s degree of sustainability, which is then sent to the firm for verification and correction. The changes made by the firm are then checked and verified again by Sustainalytics.
2Various studies linking CSR to performance have used Sustainalytics data. See, for example, Surroca
3.5. Control variables
To make sure our CSR indicator does not proxy for other variables known to impact effi-ciency, we include a set of control variables previously identified in the literature (Pasiouras et al., 2009; Shen et al., 2016; Wu et al., 2017). These control variables can be divided into two categories:
The first category relates to financial characteristics. Size is the natural logarithm of total assets. Leverage represents the ratio of equity to total assets (as in Shen et al. (2016) and Wu et al. (2017)). LoanDep denotes the loans to deposit ratio which measures the bank’s ability to finance its loans through deposits.
The second category comprises macroeconomic variables. GDPgrow and GDPper denote the GDP growth rate and GDP per capita respectively. They capture the economic hetero-geneity of a country and may also affect the revenue, cost functions and CSR decisions (Wu and Shen, 2013; Shen et al., 2016). CreditGDP refers to the ratio of credit to private sector over gross domestic product GDP (Wu et al., 2017) and is included to consider the influence of the country’s financial sector development on bank performance. Infl represents the rate of inflation (Pasiouras et al., 2009). Table 2 provides the full description, calculation method and predicted sign of the relationship with bank efficiency for the control variables.
Table 3 reports summary statistics related to our set of variables. The mean and median efficiency scores are 36.41% and 31.22% respectively, with a standard deviation of 15.91%. The average bank in our sample has a CSR score of 53.60% and an equity-to-total assets ratio of 52.23% .
4. Results
Table 4 presents the results from the fixed-effect panel regression analysis. Model 1 only includes CSR as an explanatory variable. Model 2 controls for bank-specific indica-tors. Model 3 includes macroeconomic controls. Model 4 includes both bank-specific and macroeconomic control variables. Regardless of model specification, results show that CSR positively impacts bank efficiency and that this link is statistically significant. Regarding control variables, it appears that bank size and the loan to deposit ratio positively impact
Table 2: Description of variables
Variable Description Source Expected sign
Dependent variable
Efficiency Technical efficiency score. DEA Solver Pro
Independent variable
CSR Corporate social responsibility score Sustainalytics +
Financial characteristics
Size Natural logarithm of total assets Datastream +
Leverage Equity / Total assets Datastream +
LoanDep Total loans / Total deposits Datastream +
Macroeconomic variables
GDPgrow Annual GDP growth rate WDI
+/-GDPper GDP per capita WDI
+/-CreditGDP Domestic credit to private sector / GDP WDI +
Infl Annual inflation rate WDI +
WDI: World Development Indicator
Table 3: Descriptive statistics
Variable Obs Mean Standard deviation Min Median Max
Efficiency 937 36.41 15.91 14.43 31.22 100.00 CSR 937 53.60 9.75 34.00 51.00 88.00 Size 937 18.38 1.46 15.58 18.02 21.66 Leverage 937 52.23 22.96 7.96 52.06 99.74 LoanDep 937 112.38 47.66 50.19 98.10 346.74 GDPgrow 937 2.79 2.95 -5.48 2.53 11.96 GDPper 937 9.98 1.11 6.99 10.50 11.39 CreditGDP 937 122.55 54.02 15.66 125.61 207.90 Infl 937 2.74 2.47 -1.14 2.08 11.99
bank efficiency. Taking model 4 as our baseline regression, our results show that a unit-increase in a bank’s CSR score is associated with a 0.13 percentage point unit-increase in its efficiency. These findings confirm H1.
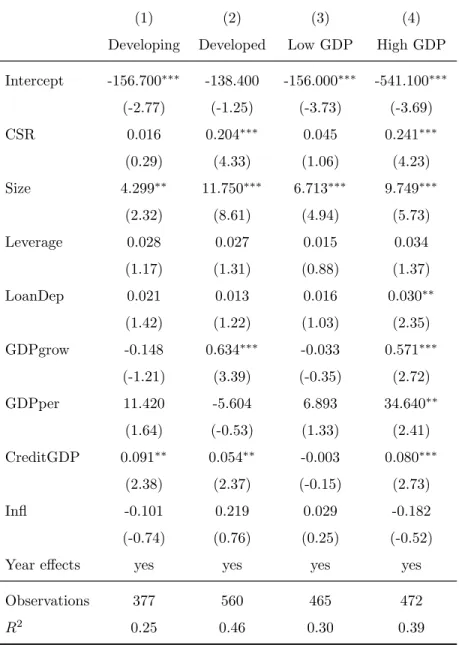
We also explore whether the level of economic development has an impact on the rela-tionship between CSR and bank efficiency. In Table 5, we estimate our baseline model by splitting our overall sample according to the level of economic development. We re-run our model using a sample made up only of developing countries (Column 1), and a sample of developed countries (Column 2), based on the United Nations’ classification. We show that CSR only improves bank efficiency in developed countries, since CSR only seems to have a positive and significant impact on efficiency for firms located in these countries. We thus demonstrate that a country’s level of economic development plays a role in the CSR-efficiency relationship, confirming H2. It therefore appears that CSR activities help banks build good
reputation, but only if a minimum level of economic development is reached. This is in line with the argument positing that a minium level of wealth is necessary for post-materialist values promoting awareness of CSR among stakeholders to emerge (Berthe and Elie, 2015; Scruggs, 1998). As a robustness test, we also split our sample according to the sample me-dian value of countries’ level of GDP per capita (Columns 3 and 4). Our conclusions remain the same.
In addition, because a strong investor protection reduces potential shareholders’ expro-priation by managers, we assess whether the CSR-efficiency relationship is stronger when investor protection is high. In Table 6, we thus test whether the quality of institutions exerts an influence on the impact of CSR on bank efficiency. Specifically, we use the rule of law index and the control of corruption index constructed by the World Bank’s Worldwide Gov-ernance Indicators. These variables have already been used to measure the extent to which institutions enforce investors’ rights (Arouri and Pijourlet, 2017; Drobetz et al., 2010). We split our sample according to the sample median value of the rule of law index (Columns 1 and 2) and control of corruption index (Columns 3 and 4). We highlight that CSR only have a significant impact on efficiency for banks located in countries where investors can best enforce their rights, since a high level of investor protection leads to a decrease in agency costs potentially linked with CSR policies. These findings confirm H3.
Table 4: CSR and bank efficiency (1) (2) (3) (4) Intercept 31.690∗∗∗ -167.100∗∗∗ -119.100∗∗∗ -142.900∗∗∗ (17.89) (-9.52) (-2.61) (-3.28) CSR 0.106∗∗∗ 0.136∗∗∗ 0.119∗∗∗ 0.130∗∗∗ (2.69) (3.77) (3.09) (3.55) Size 10.570∗∗∗ 9.648∗∗∗ (11.14) (8.85) Leverage 0.020 0.022 (1.29) (1.41) LoanDep 0.025∗∗∗ 0.021∗∗ (3.00) (2.51) GDPgrow 0.254∗∗ 0.255∗∗ (2.43) (2.57) GDPper 13.990∗∗∗ -1.352 (3.00) (-0.28) CreditGDP 0.092∗∗∗ 0.056∗∗∗ (5.17) (3.24) Infl -0.072 0.095 (-0.51) (0.71) Year effects yes yes yes yes
Observations 937 937 937 937 R2 0.05 0.48 0.02 0.51
t statistics are in parentheses. ∗, ∗∗ and∗∗∗ denote statistical
Table 5: CSR and bank efficiency
(1) (2) (3) (4) Developing Developed Low GDP High GDP
Intercept -156.700∗∗∗ -138.400 -156.000∗∗∗ -541.100∗∗∗ (-2.77) (-1.25) (-3.73) (-3.69) CSR 0.016 0.204∗∗∗ 0.045 0.241∗∗∗ (0.29) (4.33) (1.06) (4.23) Size 4.299∗∗ 11.750∗∗∗ 6.713∗∗∗ 9.749∗∗∗ (2.32) (8.61) (4.94) (5.73) Leverage 0.028 0.027 0.015 0.034 (1.17) (1.31) (0.88) (1.37) LoanDep 0.021 0.013 0.016 0.030∗∗ (1.42) (1.22) (1.03) (2.35) GDPgrow -0.148 0.634∗∗∗ -0.033 0.571∗∗∗ (-1.21) (3.39) (-0.35) (2.72) GDPper 11.420 -5.604 6.893 34.640∗∗ (1.64) (-0.53) (1.33) (2.41) CreditGDP 0.091∗∗ 0.054∗∗ -0.003 0.080∗∗∗ (2.38) (2.37) (-0.15) (2.73) Infl -0.101 0.219 0.029 -0.182 (-0.74) (0.76) (0.25) (-0.52) Year effects yes yes yes yes
Observations 377 560 465 472 R2 0.25 0.46 0.30 0.39
t statistics are in parentheses. ∗, ∗∗ and ∗∗∗ denote statistical sig-nificance at the 10%, 5% and 1% level, respectively.
Table 6: CSR and bank efficiency
(1) (2) (3) (4)
Low rule of law High rule of law Low control of corruption High control of corruption
Intercept -147.300∗∗∗ -471.800∗∗∗ -154.4∗∗∗ -478.6∗∗∗ (-3.48) (-3.29) (-3.59) (-3.38) CSR 0.035 0.241∗∗∗ 0.0289 0.224∗∗∗ (0.82) (4.21) (0.65) (3.96) Size 6.533∗∗∗ 9.717∗∗∗ 6.555∗∗∗ 10.21∗∗∗ (4.78) (5.67) (4.67) (5.95) Leverage 0.010 0.035 0.0130 0.0314 (0.55) (1.41) (0.73) (1.21) LoanDep 0.011 0.030∗∗ 0.0127 0.0289∗∗ (0.94) (2.36) (1.11) (2.27) GDPgrow -0.052 0.559∗∗∗ -0.0435 0.526∗∗∗ (-0.51) (2.85) (-0.42) (2.69) GDPper 6.423 28.550∗∗ 7.037 28.58∗∗ (1.22) (2.02) (1.32) (2.03) CreditGDP -0.009 0.066∗∗ -0.00871 0.0612∗∗ (-0.38) (2.44) (-0.36) (2.16) Infl 0.005 -0.229 0.0470 -0.143 (0.04) (-0.65) (0.39) (-0.44)
Year effects yes yes yes yes
Observations 468 469 475 462
R2 0.29 0.37 0.23 0.37
t statistics are in parentheses. ∗, ∗∗ and ∗∗∗ denote statistical significance at the 10%, 5% and 1% level, respectively.
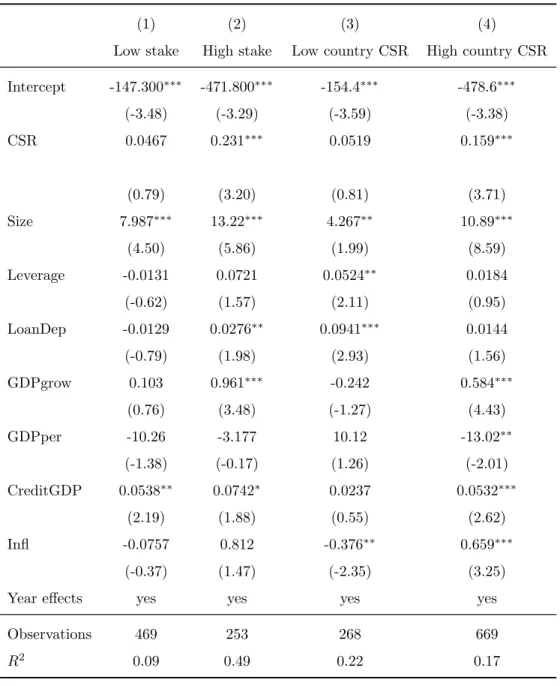
Finally, in Table 7 we test whether a country’s stakeholder orientation has an impact on the CSR-efficiency relationship. In order to measure a country’s stakeholder orientation, we use the proxy developed by Dhaliwal et al. (2012). This variable takes into account both the legal context and social norms toward CSR, and especially countries’ laws concerning labor rights, regulations on CSR disclosure, public awareness of CSR issue and attitudes of managers and investors toward social issues. Hence, we re-estimate our baseline model on subsamples based on the median value of stakeholders’ orientation (Columns 1 and 2). We show that the presence of strong CSR-related institutions is necessary for CSR to enable banks to improve their efficiency. These institutions increase legitimacy and salience of stakeholders’ claims so that their consideration becomes crucial for the economic activity of banks. Indeed, we observe that CSR has a significant impact on efficiency only for firms located in countries where stakeholders’ orientation is high. For robustness purposes, we also use an alternative proxy of stakeholder orientation. Specifically, we split our sample according to the median value of country-mean CSR scores (Columns 3 and 4). Our results are once again confirmed and validate H4.
Overall, our results suggest that CSR can have a positive impact on bank efficiency. In accordance with the stakeholder view of CSR (Freeman, 1984; Porter and Kramer, 2006), one could explain this fact by arguing that maintaining good relationships with all stakeholders utimately benefits firms by providing them with a competitive advantage. This CSR-induced competitive advantage can result from increased reputation (Branco and Rodrigues, 2006; Hillman and Keim, 2001), increased employee loyalty and productivity (Branco and Ro-drigues, 2006; Fombrun et al., 2000; Turban and Greening, 1997), and the ability to price products less agressively (Fombrun et al., 2000). In the case of banks, it means strong CSR capabilities should positively impact efficiency through a reduction in the cost of inputs, e.g., lower deposit rates (Wu and Shen, 2013), a better use of inputs, e.g., better human capital management, and an increase in output through higher fees charged to clients (Wu and Shen, 2013) as well as higher interests charged on clients’ loans (Kim et al., 2005). However, it appears that a certain level of economic development, institutional quality and stakeholder orientation at the country level are necessary for this positive impact to materialize.
Table 7: CSR and bank efficiency
(1) (2) (3) (4)
Low stake High stake Low country CSR High country CSR
Intercept -147.300∗∗∗ -471.800∗∗∗ -154.4∗∗∗ -478.6∗∗∗ (-3.48) (-3.29) (-3.59) (-3.38) CSR 0.0467 0.231∗∗∗ 0.0519 0.159∗∗∗ (0.79) (3.20) (0.81) (3.71) Size 7.987∗∗∗ 13.22∗∗∗ 4.267∗∗ 10.89∗∗∗ (4.50) (5.86) (1.99) (8.59) Leverage -0.0131 0.0721 0.0524∗∗ 0.0184 (-0.62) (1.57) (2.11) (0.95) LoanDep -0.0129 0.0276∗∗ 0.0941∗∗∗ 0.0144 (-0.79) (1.98) (2.93) (1.56) GDPgrow 0.103 0.961∗∗∗ -0.242 0.584∗∗∗ (0.76) (3.48) (-1.27) (4.43) GDPper -10.26 -3.177 10.12 -13.02∗∗ (-1.38) (-0.17) (1.26) (-2.01) CreditGDP 0.0538∗∗ 0.0742∗ 0.0237 0.0532∗∗∗ (2.19) (1.88) (0.55) (2.62) Infl -0.0757 0.812 -0.376∗∗ 0.659∗∗∗ (-0.37) (1.47) (-2.35) (3.25) Year effects yes yes yes yes
Observations 469 253 268 669
R2 0.09 0.49 0.22 0.17
t statistics are in parentheses. ∗, ∗∗ and ∗∗∗ denote statistical significance at the 10%, 5% and 1% level, respectively.
5. Conclusion
Research on corporate social responsibility (CSR) and its financial consequences has grown significantly over the past two decades. In this paper, we assess the impact of CSR on bank efficiency through a DEA Dynamic Network Model. Using an international sample of 184 banks in 41 countries over the 2009-2015 period, we find that the CSR of banks is positively related to their efficiency. We further show that the positive impact of CSR on bank efficiency is contingent upon various economic and institutional factors. First, it appears that CSR only impacts positively bank efficiency in developed countries while it has no impact on efficiency for banks located in developing countries. Second, it appears that the CSR-efficiency relationship only holds in countries in which investor protection is high. Finally, we find that a high degree of country stakeholder orientation is necessary for the CSR-efficiency link to materialize. Overall, our findings contribute to the banking and CSR literatures by showing that banks may benefit from implementing CSR policies insofar as such policies have in certain cases the potential enhance efficiency.
Our results have practical implications for bank managers in that they show that de-veloping CSR capabilities can yield financial benefits and enhance bank efficiency. Indeed, our conclusions tend to show that CSR spending by banks does not represent a waste of resources but rather may lead to a better use of resources. This study is also of interest to policy makers insofar as it shows that the institutional framework is a key element that shapes the impact of CSR activities on financial and economic outcomes. Finally, our study also has implications for investors in that it shows the CSR credentials of a bank can impact the way it operates and how efficient its business is.
Obviously, our study is not exempt from some limitations that provide avenues for further research. First, our study focuses on a relatively short period (2009-2015) due to data constraints. Future studies could therefore study the CSR-efficiency relationship over an extended period, ideally covering the pre-crisis period (before 2008) in order to determine whether the occurrence of the crisis has impacted the link between CSR activities and bank efficiency. Extending the study period would also be interesting because implementing CSR policies may take many years to produce value-enhancing outcomes. Second, our study focuses on overall CSR. As a result, future investigations could focus on specific CSR actions
in order to determine more precisely what initiatives and policies most directly impact bank efficiency.
References
Arouri, M., Pijourlet, G., 2017. CSR performance and the value of cash holdings: Interna-tional evidence. Journal of Business Ethics 140, 263–284.
Avkiran, N.K., 2009. Opening the black box of efficiency analysis: an illustration with UAE banks. Omega 37, 930–941.
Avkiran, N.K., 2015. An illustration of dynamic network dea in commercial banking includ-ing robustness tests. Omega 55, 141–150.
Barnea, A., Rubin, A., 2010. Corporate social responsibility as a conflict between sharehold-ers. Journal of business ethics 97, 71–86.
Berger, A.N., Humphrey, D.B., 1997. Efficiency of financial institutions: International survey and directions for future research. European Journal of Operational Research 98, 175–212.
Berthe, A., Elie, L., 2015. Mechanisms explaining the impact of economic inequality on environmental deterioration. Ecological Economics 116, 191–200.
Branco, M.C., Rodrigues, L.L., 2006. Corporate social responsibility and resource-based perspectives. Journal of Business Ethics 69, 111–132.
Brown, W.O., Helland, E., Smith, J.K., 2006. Corporate philanthropic practices. Journal of Corporate Finance 12, 855–877.
Cespa, G., Cestone, G., 2007. Corporate social responsibility and managerial entrenchment. Journal of Economics and Management Strategy 16, 741–771.
Chahine, S., Fang, Y., Hasan, I., Mazboudi, M., 2019. Entrenchment through corporate so-cial responsibility: Evidence from ceo network centrality. International Review of Finanso-cial Analysis .
Charnes, A., Cooper, W.W., Rhodes, E., 1978. Measuring the efficiency of decision making units. European Journal of Operational Research 2, 429–444.
Cooper, W.W., Seiford, L.M., Tone, K., 2006. Introduction to data envelopment analysis and its uses: with DEA-solver software and references. Springer Science & Business Media.
Dhaliwal, D., Li, O.Z., Tsang, A., Yang, Y.G., 2014. Corporate social responsibility dis-closure and the cost of equity capital: The roles of stakeholder orientation and financial transparency. Journal of Accounting and Public Policy 33, 328–355.
Dhaliwal, D.S., Radhakrishnan, S., Tsang, A., Yang, Y.G., 2012. Nonfinancial disclosure and analyst forecast accuracy: International evidence on corporate social responsibility disclosure. The Accounting Review 87, 723–759.
Ding, D.K., Ferreira, C., Wongchoti, U., 2016. Does it pay to be different? Relative CSR and its impact on firm value. International Review of Financial Analysis 47, 86–98.
Drobetz, W., Gr¨uninger, M.C., Hirschvogl, S., 2010. Information asymmetry and the value of cash. Journal of Banking and Finance 34, 2168–2184.
Endrikat, J., Guenther, E., Hoppe, H., 2014. Making sense of conflicting empirical findings: A meta-analytic review of the relationship between corporate environmental and financial performance. European Management Journal 32, 735–751.
Esteban-Sanchez, P., de la Cuesta-Gonzalez, M., Paredes-Gazquez, J.D., 2017. Corporate social performance and its relation with corporate financial performance: International evidence in the banking industry. Journal of Cleaner Production 162, 1102–1110.
Ferrell, A., Liang, H., Renneboog, L., 2016. Socially responsible firms. Journal of Financial Economics 122, 585–606.
Fethi, M.D., Pasiouras, F., 2010. Assessing bank efficiency and performance with operational research and artificial intelligence techniques: A survey. European Journal of Operational Research 204, 189–198.
Finger, M., Gavious, I., Manos, R., 2018. Environmental risk management and financial performance in the banking industry: A cross-country comparison. Journal of International Financial Markets, Institutions and Money 52, 240–261.
Fombrun, C.J., Gardberg, N.A., Barnett, M.L., 2000. Opportunity platforms and safety nets: Corporate citizenship and reputational risk. Business & Society Review 105, 85–106.
Freeman, R.E., 1984. Strategic management: A stakeholder approach. Pitman, Marshfield.
Friedman, M., 1970. The social responsibility of business is to increase its profits. The New York Times Magazine , 32–33.
Fukuyama, H., Weber, W.L., 2010. A slacks-based inefficiency measure for a two-stage system with bad outputs. Omega 38, 398–409.
Fukuyama, H., Weber, W.L., 2015. Measuring japanese bank performance: a dynamic network dea approach. Journal of Productivity Analysis 44, 249–264.
Hillman, A.J., Keim, G.D., 2001. Shareholder value, stakeholder management, and social issues: what’s the bottom line? Strategic Management Journal 22, 125–139.
Iannotta, G., Nocera, G., Sironi, A., 2013. The impact of government ownership on bank risk. Journal of Financial Intermediation 22, 152–176.
Inglehart, R., 1990. Culture Shift in Advanced Industrial Society. Princeton University Press.
Kao, C., Hwang, S.N., 2011. Decomposition of technical and scale efficiencies in two-stage production systems. European Journal of Operational Research 211, 515–519.
Kim, M., Kristiansen, E.G., Vale, B., 2005. Endogenous product differentiation in credit markets: What do borrowers pay for? Journal of Banking & Finance 29, 681–699.
Kim, Y., Li, H., Li, S., 2014. Corporate social responsibility and stock price crash risk. Journal of Banking & Finance 43, 1–13.
King, R.G., Levine, R., 1993. Finance and growth: Schumpeter might be right. The Quar-terly Journal of Economics 108, 717–737.
Van der Laan Smith, J., Adhikari, A., Tondkar, R.H., 2005. Exploring differences in social disclosures internationally: A stakeholder perspective. Journal of Accounting and Public Policy 24, 123–151.
Levitt, T., 1958. The dangers of social responsibility. Harvard Business Review 36, 41–50.
Lins, K.V., Servaes, H., Tamayo, A., 2017. Social capital, trust, and firm performance: The value of corporate social responsibility during the financial crisis. The Journal of Finance 72, 1785–1824.
Margolis, J.D., Elfenbein, H.A., Walsh, J.P., 2009. Does it pay to be good... and does it matter? A meta-analysis of the relationship between corporate social and financial per-formance. URL: https://papers.ssrn.com/sol3/Papers.cfm?abstract_id=1866371.
Nizam, E., Ng, A., Dewandaru, G., Nagayev, R., Nkoba, M.A., 2019. The impact of so-cial and environmental sustainability on finanso-cial performance: A global analysis of the banking sector. Journal of Multinational Financial Management 49, 35–53.
Paradi, J.C., Zhu, H., 2013. A survey on bank branch efficiency and performance research with data envelopment analysis. Omega 41, 61–79.
Pasiouras, F., Tanna, S., Zopounidis, C., 2009. The impact of banking regulations on banks’ cost and profit efficiency: Cross-country evidence. International Review of Financial Anal-ysis 18, 294–302.
Porter, M.E., Kramer, M.R., 2006. The link between competitive advantage and corporate social responsibility. Harvard Business Review 84, 78–92.
Scruggs, L.A., 1998. Political and economic inequality and the environment. Ecological Economics 26, 259–275.
Shen, C.H., Lee, C.C., 2006. Same financial development yet different economic growth– Why? Journal of Money, Credit, and Banking 38, 1907–1944.
Shen, C.H., Wu, M.W., Chen, T.H., Fang, H., 2016. To engage or not to engage in corporate social responsibility: Empirical evidence from global banking sector. Economic Modelling 55, 207–225.
Simpson, W.G., Kohers, T., 2002. The link between corporate social and financial perfor-mance: Evidence from the banking industry. Journal of Business Ethics 35, 97–109.
Surroca, J., Trib´o, J.A., 2008. Managerial entrenchment and corporate social performance. Journal of Business Finance and Accounting 35, 748–789.
Surroca, J., Trib´o, J.A., Waddock, S., 2010. Corporate responsibility and financial perfor-mance: The role of intangible resources. Strategic Management Journal 31, 463–490.
Thanassoulis, E., 2001. Introduction to the theory and application of data envelopment analysis. Springer.
Tone, K., Tsutsui, M., 2009. Network DEA: A slacks-based measure approach. European Journal of Operational Research 197, 243–252.
Tsionas, E.G., Assaf, A.G., Matousek, R., 2015. Dynamic technical and allocative efficiencies in European banking. Journal of Banking & Finance 52, 130–139.
Turban, D.B., Greening, D.W., 1997. Corporate social performance and organizational attractiveness to prospective employees. Academy of Management Journal 40, 658–672.
Wang, K., Huang, W., Wu, J., Liu, Y.N., 2014. Efficiency measures of the chinese commercial banking system using an additive two-stage dea. Omega 44, 5–20.
Wang, Q., Dou, J., Jia, S., 2016. A meta-analytic review of corporate social responsibility and corporate financial performance: The moderating effect of contextual factors. Business and Society 55, 1083–1121.
Wolf, J., 2014. The relationship between sustainable supply chain management, stakeholder pressure and corporate sustainability performance. Journal of Business Ethics 119, 317– 328.
Wu, M.W., Shen, C.H., 2013. Corporate social responsibility in the banking industry: Mo-tives and financial performance. Journal of Banking & Finance 37, 3529–3547.
Wu, M.W., Shen, C.H., Chen, T.H., 2017. Application of multi-level matching between financial performance and corporate social responsibility in the banking industry. Review of Quantitative Finance and Accounting 49, 29–63.