Make a drawing. Effects of strategic
knowledge, drawing accuracy, and type
of drawing on students’ mathematical
modelling performance
Educational Studies in Mathematics
May 2017, Volume 95, Issue 1, pp 53–78 | Cite as
Johanna Rellensmann (1) Email author ([email protected])
Stanislaw Schukajlow (1) Claudia Leopold (2)
1. Department of Mathematics, University of Münster, , Münster, Germany 2. University of Fribourg, , Fribourg, Switzerland
Article
First Online: 14 November 2016 3 Shares
1.6k Downloads 4 Citations
Abstract
Drawing strategies are widely used as a powerful tool for promoting students’ learning and problem solving. In this article, we report the results of an inferential mediation analysis that was applied to investigate the roles that strategic knowledge about drawing and the accuracy of different types of drawings play in mathematical modelling performance. Sixty-one students were asked to create a drawing of the situation described in a task (situational drawing) and a drawing of the mathematical model described in the task (mathematical drawing) before solving modelling problems. A path analysis showed that strategic knowledge about drawing was positively related to students’ modelling performance. This relation was mediated by the type and accuracy of the drawings that were generated. The accuracy of situational drawing was related only indirectly to performance. The accuracy of mathematical drawings, however, was strongly related to students’ performance. We complemented the quantitative approach with a qualitative in-depth analysis of students’ drawings in order to explain the relations found in our study. Implications for teaching practices and future research are discussed.
Keywords
Visualization Drawing Strategy Representation Mathematical modelling Real-world problems
Electronic supplementary material
The online version of this article (doi: 10.1007/s10649-016-9736-1 (https://doi.org /10.1007/s10649-016-9736-1)) contains supplementary material, which is available to authorized users.
Mathematical modelling is an important topic in mathematics education as it is highly relevant to students’ participation in social and professional life. Modelling or the ability to solve real-world problems demands the application of challenging transfer processes between reality and mathematics (Niss, Blum, & Galbraith, 2007). Previous research has shown that students encounter various difficulties while solving
modelling tasks and that their modelling competency is generally poor (Blum, 2011). Researchers have stressed the importance of strategies that can be used to help students overcome their difficulties in solving modelling problems (Galbraith & Stillman, 2006; Schukajlow, 2011; Stillman & Galbraith, 1998). Van Meter and Garner (2005) attribute a large potential benefit to learner-generated drawing as one of the strategies that can produce effective learning in various domains. In line with this idea, studies in which students spontaneously applied drawing strategies found positive effects of student-generated drawings on problem solving performance (Hembree, 1992; Uesaka, Manalo, & Ichikawa, 2007). However, the beneficial effect of drawing was not automatically replicated for instructed drawing (De Bock, Verschaffel, & Janssens, 1998; De Bock, Verschaffel, Janssens, Van Dooren, & Claes, 2003). To exploit the potential that spontaneous drawing suggests for instructed drawing, further research on the use of drawing instructions is needed.
The purpose of the current study was to investigate the conditions under which instructions to create drawings representing mathematical problems can promote mathematical modelling. Therefore, we examined the interaction between students’ strategic knowledge about drawing, the actual accuracy of the drawings they created, and their performance in mathematical modelling. In particular, we focused on the relations of two types of drawings – namely, situational drawings and mathematical drawings – with students’ performance.
1 Theoretical and empirical background
learner-generated drawing describes the process and the product of generating an
illustration that corresponds to the objects and relations described in a task. Similar definitions exist in mathematics and other domains (Arcavi, 2003; Van Meter, Aleksic, Schwartz, & Garner, 2006).
Various benefits are attributed to learner-generated drawing (Renkl & Nückles, 2006; Van Meter & Garner, 2005). First, drawing supports the organization of the given task information. When students generate a drawing for a given problem, they have to understand which objects are involved in the task and how these objects are related to each other. Second, students have to reduce the amount of given information by focusing on the relevant pieces of information that are to be represented in the drawing. The process of selecting and organizing information promotes deep information processing and should thereby enhance students’ task understanding (Van Meter & Garner, 2005). In addition, a drawing can help students draw inferences that are essential for problem solving (Cox, 1999). Information that is implicit in the description of the problem becomes apparent in the drawing and can be read off without additional processing (Larkin & Simon, 1987). In this way, a drawing can help students “better ‘see’ mathematical concepts and ideas” (Arcavi, 2003, p. 216). For example, when students recognize a particular geometrical figure in their drawings, they can choose corresponding mathematical operations to compute a solution. However, the use of drawing strategies does not foster understanding and problem solving automatically because learner-generated drawing may increase cognitive load, resulting in a reduced performance outcome (Leutner, Leopold, & Sumfleth, 2009). If the activity of drawing is too demanding for a student, the cognitive capacities that are required for constructing the drawing are no longer available for information
processing.
Empirical studies on the benefits of learner-generated drawing in mathematics have shown mixed results. As learner-generated drawing for mathematical modelling has rarely been investigated to date, results from problem solving research guided the present study. In a meta-analysis of 487 studies, Hembree (1992) compared post-treatment effects of methods for training students in subskills of problem solving such as learner-generated drawing, the guess-and-test-strategy, or verbalizing. The author identified learner-generated drawing as the most effective strategy for solving mathematical problems. However, the meta-analysis did not distinguish between the spontaneous and instructed use of learner-generated drawing. This differentiation is important as empirical evidence indicates that instructions to generate drawings do not foster mathematical problem solving automatically (De Bock et al., 1998, 2003). Previous research has pointed to particular factors that influence the efficacy of instructions to generate drawings.
As one example, De Bock et al. (1998, 2003) investigated students’ solutions to word problems involving lengths and areas of plane figures (e.g., students computed increases in the circumference and area of a square when one side was made longer). The authors found that students who were instructed to create a drawing did not perform better or even performed worse than those who were not instructed to create a drawing. The authors provided an explanation that pointed to the idea that, for specific tasks, drawing may result in a bias toward false mathematical concepts. This bias seems to depend on the accuracy of learner-generated drawings. De Bock et al. (1998) reported a positive correlation between the accuracy of students’ drawings and
their performance. These results suggest that research on learner-generated drawing should pay attention to the type of problem investigated and to the type and accuracy of the student-generated drawing.
In intervention studies that provided drawing practice, results have shown positive effects of drawing instructions. For example, Csíkos et al. (2012) analyzed a 6-week intervention with 9- and 10-year-old Hungarian students using an experimental-control-group design. In the “drawing” group, students were asked to generate drawings for each problem and to discuss the role of visual representation in group work and teacher-led discussions. Both the experimental and control groups improved their results from pre- to post-test, but the gain in achievement was notably higher for the “drawing” group. Van Essen and Hamaker (1990) found that fifth graders who practiced constructing drawings for arithmetic word problems improved their problem solving performance in comparison with a control group. The reported studies indicate that strategic knowledge about drawing that students acquired during the drawing interventions influenced the efficacy of learner-generated drawing for problem solving. Consequently, we took into account students’ strategic knowledge about drawing in the present study.
1.2 Strategic knowledge about drawing
Students’ strategic knowledge about drawing includes students’ views on the characteristics of a drawing that fit a given problem and can help them solve it. A helpful drawing, for example, correctly represents the mathematical problem structure and contains all relevant numbers (Larkin & Simon, 1987). To our knowledge, studies have not yet investigated students’ strategic knowledge about learner-generated drawing.
Metacognitive and learning strategy approaches have pointed out that knowledge about cognitive and metacognitive strategies is a necessary precondition for efficient strategy use (Flavell, 1979; Pressley, Borkowski, & Schneider, 1989; Schneider & Artelt, 2010; Verschaffel et al., 1999). Although only a few studies in the field of mathematics have addressed this issue so far, results indicate that strategy knowledge is an important predictor of mathematical performance (Lingel, Neuenhaus, Artelt, & Schneider, 2014; Lucangeli & Cornoldi, 1997; Schneider & Artelt, 2010). However, these studies used aggregated measures of students’ strategy knowledge that focused on various cognitive strategies. We therefore assert that a specific focus on students’ knowledge about learner-generated drawing may provide deeper insights into the relation of students’ strategic knowledge about drawing and the accuracy of the drawings they construct during mathematical modelling.
1.3 Accuracy of drawings
Van Essen and Hamaker (1990) analyzed the accuracy of drawings generated by 50 students while they solved arithmetic word problems. The authors observed that incorrect answers came along with inaccurate drawings and accurate answers were accompanied by accurate drawings. Moreover, Van Meter (2001) showed that experimental manipulations which facilitated drawing accuracy led to better text understanding. These findings indicate that drawing accuracy is an important factor to enhance the benefits of drawing strategies when solving modelling problems.
Besides a drawing’s accuracy, the way in which the drawing represents the objects involved in the modelling problem may influence its benefit for solving the problem.
1.4 Types of drawings
Empirical evidence indicates that the benefit of drawing depends on the type of drawing generated by the learner. This refers in particular to the drawing’s level of abstraction (Booth & Thomas, 1999; Van Garderen, 2006; Van Garderen & Montague, 2003). A situational drawing that pictorially depicts the problem’s surface structure has a low level of abstraction, whereas a mathematical drawing that focuses on the problem’s mathematical structure has a high level of abstraction. Definitions and more detailed examples of both types of drawings are provided in the section 1.5.
Learner-generated drawings with varying levels of abstraction are differently related to problem solving performance. For example, Hegarty and Kozhevnikov (1999) found that the use of pictorial representations was negatively correlated with the problem solving performance of 6th grade students, whereas abstract representations were associated with successful problem solving. In line with Hegarty and Kozhevnikov (1999), Van Garderen and Montague (2003) reported a positive correlation between abstract drawings and the problem solving performance of 6th graders with varying abilities. One explanation can be that irrelevant details that are a characteristic feature of situational drawings tie up students’ processing and impede successful problem solving this way (Presmeg, 1986b). These findings are relevant because the students, especially those with lower mathematical abilities, constructed more pictorial than abstract drawings (Hegarty & Kozhevnikov, 1999; Van Garderen & Montague, 2003). Drawings of varying levels of abstraction can be constructed while solving
mathematical modelling tasks. Consequently, research on learner-generated drawing has to pay attention to the types of drawings that are constructed, in particular to their level of abstraction.
1.5 Drawings while solving modelling problems
Transfer processes between reality and mathematics are at the core of mathematical modelling activities (Niss et al., 2007). Several approaches have analyzed the cognitive processes underlying modelling (Blum & Leiss, 2007; Galbraith & Stillman, 2006; Schukajlow, 2011; Verschaffel, Greer, & De Corte, 2000). The most approaches agree that as a first step, the learner has to construct a model of the situation described in the mathematical problem in order to understand the problem situation. In a second
step, the model of the situation has to be translated into a mathematical model through idealization and mathematization. The mathematical model represents the problem on a more abstract level that allows students to apply mathematical methods and to compute a mathematical result. In a third step, the mathematical result has to be interpreted and validated with regard to reality.
In the process of mathematical modelling, different types of learner-generated
drawings can be created. We call a situational drawing an externalized representation of the model of situation that pictorially depicts the objects described in the problem situation according to their visual appearance. Therefore, a situational drawing is a drawing with a low level of abstraction. By contrast, a mathematical drawing is an abstract drawing because it provides an externalized representation of the
mathematical model. A mathematical drawing depicts only solution-relevant objects from the problem situation, and these are reduced to their relevant mathematical features. Figure 5 illustrates both types of drawings for an exemplary modelling task. The situational drawing depicts the task’s relevant objects pictorially: a fire engine with wheels, an extended ladder with clearly visible rungs, and a house with a pitched roof. In the mathematical drawing, all objects are reduced to their relevant
mathematical features: The fire engine, the house, and the ladder are reduced to line segments, and their heights or length are noted in the drawing.
It should be mentioned that students do not always create pure situational or mathematical drawings (Hegarty & Kozhevnikov, 1999; Schukajlow, 2011). For example, a student might draw the fire engine and the ladder pictorially, but represent the building mathematically using a line. A drawing can be categorized as primarily situational (c.f., Hegarty & Kozhevnikov, 1999) if the number of situationally depicted objects is higher than the number of mathematically depicted objects. Otherwise, it is assigned to the primarily mathematical type of drawing.
Both types of drawings can support modelling activity at specific but different points. For example, a situational drawing can help the students understand the problem better by providing a way to select and organize the information given in the task. Because understanding the situation described in the task, in particular constructing an adequate model of the situation, is important for modelling (Leiss, Schukajlow, Messner, & Pekrun, 2010), situational drawings have the potential to improve students’ performance. However, a situational drawing may also hinder successful modelling because irrelevant details may tie up working memory capacity that can no longer be used (Presmeg, 1986b). By contrast, a mathematical drawing represents the information that is relevant to the task and therefore facilitates the detection of appropriate mathematical methods. However, its construction requires sophisticated processing.
1.6 Research question
(situational and mathematical drawings) relate to students’ modelling performance? To answer this research question, we hypothesized a mediation model. First, we tested the mediation model with quantitative research methods. Second, we analyzed
students’ drawings and solutions in order to elaborate on and qualify the quantitative results.
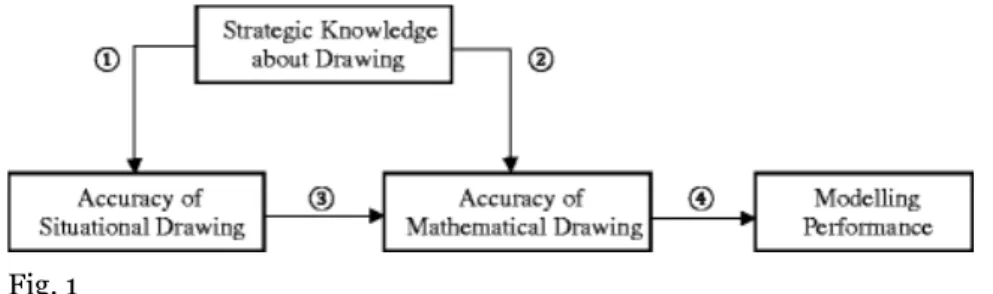
1.7 Hypothesized mediation model
The mediation model proposed in this article was based on the idea that the effect of strategic knowledge on mathematical performance is mediated by the quality of strategy use. Therefore, we positioned the accuracy of learner-generated drawings between students’ strategic knowledge about drawing and their modelling
performance. Further, we distinguished between the types of drawings, namely, the accuracy of the situational drawing and the accuracy of the mathematical drawing. Figure 1 illustrates the proposed relations between the investigated variables.
Fig. 1
Hypothesized mediation model
To our knowledge, the proposed mediation model has not been tested previously. A validation of the hypothesized mediation model can be interpreted as an indication for a causal chain as the variables are arranged in temporal order, and the postulated directions of the effects are supported by theoretical and empirical evidence. Yet it is possible that an underlying variable that is not specified in the model affects the investigated relationships. This possibility will be discussed in a more elaborate way in the limitation section of this study.
① and ② From strategic knowledge about drawing to the accuracy of drawings. The rationale for paths 1 and 2 from strategic knowledge about
drawing to the accuracy of situational drawing and the accuracy of
mathematical drawing, respectively, relies on results from empirical studies
that showed effects from strategic drawing knowledge on drawing quality (Uesaka et al., 2010; Van Essen & Hamaker, 1990). In an experimental-control-group design with 8th graders, Uesaka et al. (2010) allowed a “drawing” experimental-control-group to practice drawing. As the experimenter explicitly gave feedback on the drawings and corrected errors in the drawings, this intervention promoted the acquisition of strategic knowledge about drawing. When asked to create
drawings on a word problem post-test, the “drawing” group produced drawings of higher accuracy than the control group, which did not receive the training. ③ From the accuracy of situational drawing to the accuracy of
mathematical drawing. The rationale for path 3 from the accuracy of
situational drawing to the accuracy of mathematical drawing was deduced
from mathematical modelling approaches and the cognitive processes
underlying drawing. All descriptions of idealized modelling processes agree that understanding the task and the mathematization of the problem are essential modelling activities (Blum & Leiss, 2007; Galbraith & Stillman, 2006;
Schukajlow, 2011; Verschaffel et al., 2000) and that the former is necessary for the latter (Leiss et al., 2010). Constructing a situational drawing can deepen the problem solver’s understanding of the problem situation and help the person see inherent mathematical concepts and ideas (Van Meter & Garner, 2005). Moreover, the situational drawing can help the user avoid overloading his/her working memory while translating a situational model into a mathematical model. In these ways, the construction of a situational drawing can promote the generation of a mathematical drawing.
④ From the accuracy of the mathematical drawing to performance.
Empirical support for path 4 comes from numerous studies that have reported a positive correlation between the accuracy of drawings and problem solving performance (De Bock et al., 1998; Uesaka et al., 2010; Van Essen & Hamaker, 1990). Moreover, findings from the domain of text comprehension point to the hypothesized direction of the effect (Van Meter, 2001). With regard to idealized modelling activities that assign a key role to the mathematical model (Blum & Leiss, 2007; Galbraith & Stillman, 2006; Verschaffel et al., 2000), we predicted a direct effect from the accuracy of mathematical drawing to modelling
performance.
Indirect effects
Mediation exists when a predictor affects a dependent variable through its influence on an intervening variable (mediator). To establish a mediation effect, we would need to show (a) that there is a total indirect effect from the predictor to the dependent variable (e.g., an overall effect from strategic drawing knowledge to performance) and (b) that there are direct effects from the predictor to the mediator (e.g. an effect from strategic drawing knowledge to the accuracy of the mathematical drawing) and from the mediator to the dependent variable (e.g., an effect from the accuracy of the mathematical drawing to performance) (Preacher & Hayes, 2008).
Two indirect effects can be deduced from the hypothesized mediation model. First, we predicted that strategic knowledge about drawing would affect students’ modelling
performance indirectly as empirical results indicate that strategic knowledge affects
mathematical performance (Lucangeli & Cornoldi, 1997). We expected that the accuracy of a student’s drawing would mediate this effect. This means that a student who knows that a correct drawing that visibly represents the problem’s mathematical structure is most helpful should produce a better drawing than a peer with less elaborated strategic knowledge, and this should subsequently lead to a better
Second, we expected an indirect effect of the accuracy of situational drawing on
modelling performance as the creation of a situational drawing may promote problem
understanding, which is a precondition for successful problem solving (Leiss et al., 2010).
Alternative model
As previous research has not differentiated between types of drawings, it is also possible that the accuracy of a situational drawing affects performance directly. According to this hypothesis, students who construct a situational drawing of high accuracy will not only make a better mathematical drawing and thus achieve higher scores on the modelling test but will also benefit directly from their situational drawing, for example, because it may be helpful for the interpretation or validation of mathematical results. To test this hypothesis, we constructed an alternative model that allowed us to determine the improvement or decrement in fit as we additionally inserted path 5 from the accuracy of the situational drawing to modelling
performance into the hypothesized model (Fig. 2).
Fig. 2
Alternative Model
2 Method
2.1 Participants
Participants were 61 students (25 girls and 36 boys) in grades 9 (n = 20) and 10 (n = 41) at two comprehensive schools in Germany. The average age of participants was M = 15.73 years (SD = 0.70).
3 Materials
Strategic knowledge test
To assess students’ strategic knowledge about drawing, a scenario-based test was designed and examined in a pilot study that included 15 students. Students were
presented five mathematical modelling tasks each accompanied by five potential drawings. As the test aimed at assessing students’ individual amount of strategic knowledge about drawing, the main criterion for the selection of items was content validity. To realize high content validity, the modelling tasks, which provided the test item scenarios, covered heterogeneous situational contexts and mathematical contents from the domain of geometry (e.g., computing the area of a circle, the surface of a cone, or the volume of a cuboid). An exemplary task from the test is shown in Fig. 3. The strategic knowledge test about drawing as a whole is provided as electronic supplementary material. Students were instructed not to solve the tasks but to choose the drawing that they rated as the most helpful for problem solving. For each task, both correct situational and correct mathematical drawings were presented among other incorrect drawings. Choosing the most helpful drawing out of multiple correct drawings indicates knowledge about the characteristics of good drawings. A
mathematical drawing is predicted to be more helpful for problem solving than a situational drawing as the mathematical problem structure is visible in a mathematical drawing and can be more easily read off without further processing, whereas its recognition in a situational drawing requires additional inferential processes. These may become an additional source of difficulty for students and hinder the problem solving process. Therefore, the selection of the provided correct mathematical drawing was scored as correct (coded 1), and the selection of any other drawing was scored as wrong (coded 0). Aggregated across tasks, scale scores could range from 0 to 5 points. A high score in strategic drawing knowledge thus indicates that the student recognizes the correctness and visibility of a mathematical model as characteristics of the drawing that are helpful for solving a mathematical word problem. The reliability of this scale (Cronbach’s Alpha: α = .46) was not satisfactory, but it was in line with previous findings on students’ knowledge about diagrams in the domain of mathematics (Diezmann, 2005) and students’ strategic knowledge in the domain of text
comprehension (Souvignier & Mokhlesgerami, 2006). This result suggested that the students did not have systematic knowledge about these types of drawings.
Fig. 3
Exemplary task to measure students’ strategic knowledge about drawing
Sample problems
To assess the accuracy of drawings created by the students and their modelling performance, students were asked to work on eight mathematical modelling tasks that could be solved using the Pythagorean theorem. This topic is well suited for the purpose of this study as it is of great importance in the mathematics curriculum in Germany as well as in other countries and it requires a two-dimensional, spatial interpretation of a situation that can be supported by visualization. All tasks had been thoroughly tested in previous studies (Schukajlow, Krug, & Rakoczy, 2015; Schukajlow et al., 2012) and were chosen because of their difficulty and selectivity parameters for 9th and 10th graders. Examples of tasks used in this study are shown in Fig. 4 and in Appendix B. For each task, students were instructed (a) to construct a situational drawing, (b) to construct a mathematical drawing, and (c) to solve the task.
Fig. 4
Real-world problem “Fire brigade” (Blum, 2011)
Drawing type
To analyze students’ drawings, first, we identified each drawing as a situational or mathematical type of drawing according to the predominant number of objects that are represented pictorially or mathematically (see Fig. 5). Each of the modelling tasks used in this study contained three relevant objects. We identified a drawing as
situational if two or more of the task’s three relevant objects were depicted pictorially, and we identified a drawing as mathematical if it depicted two or more of the relevant objects according to their relevant mathematical features. For example, a drawing in which the fire engine and the ladder were represented situationally, but in which the building was represented mathematically using a line was assigned to the situational type of drawing. A rater was instructed to estimate the drawing type, drawing
accuracy, and solution accuracy independently for the eight modelling problems using a coder’s manual. Two raters coded a subset of 16 % of the test booklets, and inter-rater reliabilities were computed. Inter-inter-rater reliabilities for drawing types proved to be good as they ranged from Cohen’s κ = .80 to κ = 1 for the eight modelling problems.
Fig. 5
Example of a student’s (a) situational drawing, (b) mathematical drawing, and (c) solution to the fire-brigade task
Drawing accuracy
Second, we estimated the drawing’s accuracy. To estimate a drawing’s accuracy, we took into account whether the drawing was correct and whether all relevant numbers were included and correctly allocated. A drawing was coded as correct if it represented the task’s relevant objects and if these were depicted in their correct relations. For the fire-brigade task, for example, this means that a correct (situational or mathematical) drawing depicts the fire engine, the extended ladder, and a building. For the relations to be correct, the engine would have to be positioned in front of the house and the ladder extended and targeted toward the building. The accuracy of drawings was scored on a 3-point scale with a score of 0 representing a missing or incorrect drawing, a score of 1 standing for a correct but incomplete drawing (e.g., relevant numbers were missing), and a score of 2 representing a correct and complete drawing. The inter-rater reliabilities computed for each modelling task were good, ranging from a Cohen’s Kappa of .80 to κ = 1 for the accuracy of situational drawings and from κ = .75 to κ = 1 for the accuracy of mathematical drawings.
Figure 5 illustrates an example of a student’s drawing depicting objects from the fire-brigade task. The drawing on the left is a situational drawing as it depicts the fire engine, the ladder, and the house. The drawing’s accuracy was awarded the maximum score of 2 because all relevant numbers were included and correctly allocated in the drawing. The drawing on the right is a mathematical drawing as it focuses on the mathematical figures of a right triangle and a rectangle, and the situational objects are reduced to their mathematical features (e.g., the house is reduced to a line
representing the height of the front wall). All relevant numbers are inserted and correctly allocated. Therefore, the mathematical drawing was also awarded a score of 2.
Composite scores for drawing accuracy were computed by calculating the mean drawing accuracy score across the eight modelling tasks. The reliabilities of these measurements were moderate with a Cronbach’s Alpha of .63 for the accuracy of the
situational drawing and α = .57 for the accuracy of the mathematical drawing,
indicating notable variability in students’ drawing competencies.
Modelling performance
To assess students’ modelling performance, we estimated the accuracy of their problem solutions on a 3-point scale. A correct problem solution was coded 2. Partial credit (a code of 1) was awarded for an incorrect solution that was due to
computational errors only, and a code of 0 was given to an incorrect solution resulting from an incorrect mathematization. The inter-rater reliability for modelling
performance was good, ranging from κ = .83 to κ = 1 for the eight tasks. Each student’s mean modelling performance was calculated across the eight tasks. The reliability of
the modelling performance scale was satisfactory with Cronbach’s α = .76.
3.1 Procedure
Data collection took place in schools in May, 2014. The testing session was
implemented by two trained master’s degree students and lasted about 75 min. First, students worked on the strategic knowledge test about drawings for ten minutes. Second, they received a test booklet containing the eight modelling tasks. For each task, students were asked (a) to make a situational drawing, (b) to make a
mathematical drawing, and (c) to solve the task. The layout of the test sheets indicated task processing in the postulated order. To ensure that students understood the difference between the two types of drawings, the test booklet began with an
exemplary modelling task that did not need to be solved and examples of a situational drawing and a mathematical drawing for this task (see Appendix A).
4 Results
4.1 Preliminary analyses
Path-analytic methods are based on asymptotic statistical procedures. To obtain robust results, Kline (2005) advises that researchers respect a minimum ratio of 5:1 between the sample size and the number of free model parameters. In this study, we met the required ratio with 61:10 and 61:11 for the hypothesized and alternative mediation models, respectively. Thus, the sample was sufficient to conduct the analyses to test both models.
4.2 Descriptive results
Manipulation check
As a manipulation check, we analyzed how many situational and mathematical drawings the students generated and whether the students attempted to solve each modelling problem (see Table 1). For example, 57 out of 61 students made a situational drawing for the first modelling problem. Thus, only four students did not follow the instruction for this problem. The overall high quantity of drawings and solutions indicated that the students tried to create both types of drawings and to solve the eight modelling problems.
Table 1
Problem Situational drawings [0;61] Mathematical drawings [0;61] Solutions [0;61] 1 57 59 56 2 55 59 57 3 59 58 58 4 54 54 48 5 50 53 50 6 43 29 24 7 55 32 41 8 47 44 44
Strategic knowledge about drawing
On the strategic knowledge test about drawing, 0 to 5 points were attainable. The mean value of strategic knowledge M = 3.36 (SD = 1.23) showed a moderate level of knowledge about drawing. Table 2 shows the distribution of students’ answers across the distractors of the wind problem. Fifty percent of the students indicated that the correct mathematical drawing was the most helpful drawing. However, another notable proportion of 34 % of the students indicated that the correct situational drawing was the most helpful for solving the wind problem.
Table 2
Type of drawing Percentage of Students (N = 61) who chose this type of drawing Correct mathematical drawing 50 % Incomplete situational drawing 8 % Incorrect mathematical drawing 6 %
Correct situational drawing 34 % Incorrect situational
drawing 1 %
Accuracy of drawing and modelling performance
The two types of drawings did not differ from each other in their mean degree of accuracy. The mean drawing accuracy was M = 1.20 (SD = 0.37) for a situational drawing and M = 1.30 (SD = 0.36) for a mathematical drawing. The mean modelling performance score was M = 0.98 (SD = 0.52).
4.3 Analysis of mediation models
Statistical procedure
Path analyses were conducted using the computer program MPlus (Muthén & Muthén, 1998–2012). We used a maximum-likelihood algorithm with standard errors and a mean-adjusted chi-square test statistic (MLM), which is recommended for samples of
N ≤ 250 (Muthén & Muthén, 1998–2012). We report the fully standardized path
coefficients β to facilitate comparisons of the strengths of effects. Beta coefficients can be interpreted as partial correlations with values ranging from −1 to +1. To assess the degree of model fit, we report the comparative fit index (CFI) and the Standardized Root Mean Square Residual (SRMR). The two fit indices have been found to be the most accurate for small sample sizes (Hu & Bentler, 1999). Following Hu and Bentler (1999), we selected CFI > .95 and SRMR < .09 as the criteria for good model fit. We further used the scaled chi-square difference test to compare the fits of the
Path-analytic results
Table 3 shows the correlation matrix for the variables measured in the current study. All calculated correlations were in the expected directions as no negative correlations between variables were observed.
Table 3
Correlations among measures
Strategic knowledge about drawing Situational drawing Mathematical drawing Performance Strategic Knowledge about Drawing – .13 .26* .23 Situational Drawing – .39* .24 Mathematical Drawing – .76* Performance – * p < .05; p < .10
Model fit
The hypothesized model and the alternative model fit the data well according to both fit indices (see Table 4). The hypothesized model accounted for about 20 % of the variance in mathematical drawing accuracy and for about 58 % of the variance in modelling performance. The R-squared value did not increase when the path from the
accuracy of the situational drawing to performance was inserted into the
hypothesized model (Alternative Model).
Table 4
Fit values for the hypothesized model and the alternative model
Hypothesized model Alternative model
R .58 .58
a
a
a
A nonsignificant chi-square difference test indicated that the hypothesized model and the alternative model fit the data equally well (χ (1, N = 61) = 0.06, p > .05).
Therefore, we chose to retain the simpler hypothesized model.
Direct and indirect effects
Path coefficients indicate the effects of independent variables on dependent variables. The fully standardized parameter estimates and significance levels are reported in Table 5. In addition, Fig. 6 provides a graphical presentation of the direct effects.
Table 5
Estimates for the hypothesized model
Paths β SE p
Direct Effects
From Strategic Knowledge to
Situational Drawing .13 .14 .34 Mathematical Drawing .21 .11 .05 From Situational Drawing to
Mathematical Drawing .36 .11 <.01 From Mathematical Drawing to
Performance .76 .05 <.01 Total and Indirect Effects
From Strategic Knowledge to
Performance .20 .11 .06
Via Situational Drawing .04 .04 .32 Via Mathematical Drawing .16 .09 .06 From Situational Drawing to
Performance .28 .09 <.01
In the alternative model, the direct effect from the accuracy of situational drawing to performance was not significant (β = −.07, p = .45). There were no notable changes in effect strengths and significance levels between the hypothesized and the alternative model
Fig. 6
Estimated path coefficients β. Dotted paths indicate p > .05; solid lines indicate p < .05
The path-analytic results were consistent with the idea that students’ strategic knowledge about drawing has a positive direct effect on drawing accuracy. This effect was significant at the 5 % level for the accuracy of mathematical drawings (β = .21, p = .05) but not for the accuracy of situational drawings (β = .13, p = .34). As hypothesized, the results revealed that the accuracy of students’ situational drawings affected the accuracy of their mathematical drawings (β = .36, p < .01). In addition, the results showed that the accuracy of the mathematical drawings was a strong predictor of students’ modelling performance (β = .76, p < .01).
We also tested two indirect effects. First, the total indirect effect from strategic
knowledge about drawing to modelling performance was significant at the 6 % level (β = .20, p = .06), and it was almost completely mediated by the accuracy of
mathematical drawings (β = .16, p = .06). This result can be interpreted as support for the hypothesis that students’ strategic drawing knowledge promotes modelling performance via mathematical drawing accuracy as both direct effects were
significant. This means that the more students know about drawing, the more likely they are to construct mathematical drawings of high accuracy. And the higher the accuracy of their mathematical drawings, the better their modelling performance. Second, the results showed a positive indirect effect from the accuracy of situational drawings to students’ modelling performance (β = 0.28, p < .01), which was mediated by the accuracy of their mathematical drawings. This means that the better the accuracy of students’ situational drawings, the higher the accuracy of their generated mathematical drawings and the better their modelling performance down the line. The results of the mediation analysis indicate that situational and mathematical drawings affect modelling performance in different ways. In order to explain the effects of situational and mathematical drawing on modelling, we qualitatively analyzed students’ drawings and solutions.
4.4 In-depth analysis of students’ drawings and solutions
The reported quantitative results supported the expectation that both types of drawings would promote the solving of modelling problems. To elaborate and qualify the quantitative results, we qualitatively analyzed students’ drawings and solutions for the exemplary fire-brigade task in order to explain the effects of situational andTable 6 shows the relations between the accuracy of the situational drawing, the accuracy of the mathematical drawing, and the accuracy of the solution for the fire-brigade task. For reasons of simplicity, we included correct but incomplete drawings (coded 1) and correct and complete drawings (coded 2) in the single category correct
drawings and compared them with incorrect drawings (coded 0). Analogously,
correct solutions (coded 2) and incorrect solutions resulting from computational errors (coded 1) were aggregated in the single category correct solution and compared with incorrect solutions resulting from an incorrect mathematization (coded 0).
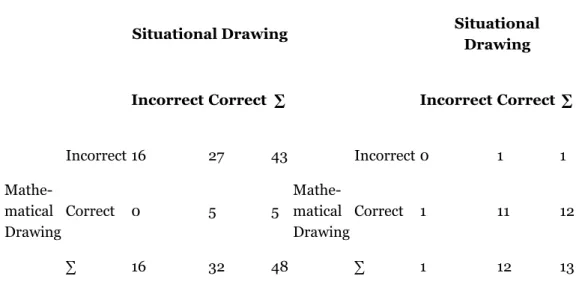
Table 6
Relations between the accuracy of situational and mathematical drawings with regard to the incorrect (left) or correct (right) solution to the fire-brigade task
Situational Drawing Situational Drawing Incorrect Correct ∑ Incorrect Correct ∑
Mathe-matical Drawing Incorrect 16 27 43 Mathe-matical Drawing Incorrect 0 1 1 Correct 0 5 5 Correct 1 11 12 ∑ 16 32 48 ∑ 1 12 13
First, with regard to the relation between situational and mathematical drawings, Table 6 shows that the construction of a correct situational drawing often preceded the construction of a correct mathematical drawing. 16 (5 + 11) out of 17 (5 + 12) students who constructed a correct mathematical drawing had generated a correct situational drawing beforehand. By contrast, among the 17 (16 + 1) students who constructed an incorrect situational drawing, only one constructed a correct mathematical drawing afterwards. According to theoretical descriptions of modelling processes (Blum & Leiss, 2007; Galbraith & Stillman, 2006; Leiss et al., 2010; Verschaffel et al., 2000), this finding indicates that a correct situational drawing can be an important factor for facilitating the construction of a correct mathematical drawing.
Figure 7 indicates how a correct situational drawing can promote the construction of a mathematical drawing and the ways in which an incorrect situational drawing may complicate the construction of a mathematical drawing. Both students whose drawings are displayed in Fig. 7 identified the house, the fire engine, and the extended ladder as important objects in the problem situation. However, only the student whose drawing is presented on the left depicted the objects in their correct spatial arrangement. It is possible that because the student inserted a notional line indicating the engine’s height, the situational drawing helped the student to see the implicit geometrical figure of a right triangle. The student computed the mathematical result by calculating the triangle’s missing leg using the Pythagorean Theorem and adding the engine’s
height to the result. Although the height was not explicitly shown in the situational drawing, the drawing may have inspired the student to consider it in the solution as the information was implicitly included in the drawing.
Fig. 7
Examples of helpful (left) and misleading (right) situational drawings for the fire-brigade problem
However, the student whose solution is displayed on the right was not able to construct a correct mathematical drawing, presumably because the student’s
situational drawing was incorrect. The situational drawing indicates that although the student did not have trouble identifying the relevant objects, he rather had trouble understanding their spatial relations. Consequently, the student was not able to generate a correct mathematical drawing or to solve the task.
However, a correct situational drawing is not sufficient for the construction of a correct mathematical drawing. In the group of non-solvers, only 5 out of 32 students who constructed a correct situational drawing were able to generate a correct
mathematical drawing afterwards. An exemplary drawing is shown in Fig. 8 on the left side. Although the situational drawing is correct, and it contains all the relevant numbers, the student failed to take the fire engine’s height into account when making the mathematical drawing. The disregarding of the engine’s height may have been due to conceptual errors or to an over-simplification in the modelling process.
Fig. 8
Examples of decreasing accuracy from the situational to the
mathematical drawing (left) and computational errors (right) for the fire-brigade problem
However, two thirds of the 48 students who did not solve the task also constructed a correct situational drawing. Results further point to the hypothesis that constructing a correct mathematical drawing is more important for solving the modelling problem than making a correct situational drawing as a correct mathematical drawing often occurred with correct problem solving. Among the 13 students who computed the correct solution, 12 students constructed a correct mathematical drawing. When a correct mathematical model is constructed, correctly applied inner-mathematical procedures directly lead to a correct mathematical result. Only four students generated correct mathematical drawings but did not solve the task correctly afterwards. This was often due to the incorrect application of mathematical procedures and was not usually due to a comprehension problem. For example, the student whose drawings and solution are displayed in Fig. 8 on the right side did not apply the Pythagorean Theorem correctly as he mixed up the triangle’s hypotenuse and leg.
To sum up, the qualitative analysis of students’ drawings and solutions supplemented the results of the mediation analysis and indicated how the construction of a
situational drawing and a mathematical drawing can promote modelling performance. Our results first point to a key role that a correct mathematical drawing plays in successful problem solving: If no technical errors occur, a correct mathematical drawing nearly always leads to a correct solution. Second, results suggest that a correct situational drawing can promote the construction of a correct mathematical drawing. Students first need to understand the problem situation in order to construct a correct mathematical model. This includes the identification of relevant objects and their interrelations. A situational drawing may promote the construction of a mathematical drawing as it can help the student reduce the given information to its relevant
mathematical structure underneath the problem’s surface structure. Further, it may inspire the student to consider implicit information. However, a situational drawing does not automatically lead to a correct mathematical drawing. Sometimes students disregard features of the situational drawing when generating the mathematical drawing.
Our quantitative and qualitative findings indicate that situational and mathematical drawings promote modelling performance in different ways. This is of practical relevance as the appropriate use of drawing strategies can help students overcome difficulties in mathematical modelling.
5 Discussion
The purpose of the study was to examine factors that affect the efficacy of instructed drawing on students’ modelling performance. Therefore, we conducted a quantitative mediation analysis to examine the interplay between students’ strategic knowledge about drawing, the type and accuracy of self-generated drawings, and students’ modelling performance. We distinguished between two types of drawings: situational
drawings, which depict the problem’s surface structure pictorially, and mathematical drawings, which focus on the relevant mathematical structure underneath the
problem’s surface structure. In addition to the inferential mediation analysis, we qualitatively analyzed students’ drawings to explain and clarify the effects of the mediation analysis.
Our results confirmed the hypothesized mediation model. Strategic knowledge about drawing was positively related to students’ modelling performance. As hypothesized, this relation was mediated by the accuracy of the drawing. Students with better strategic knowledge about drawing than their peers constructed mathematical drawings of higher accuracy and subsequently better solved the modelling problems. This result is in line with previous research on the relations between strategy
knowledge, strategy use, and learning outcome (Lingel et al., 2014; Pressley et al., 1989; Verschaffel et al., 1999). It is interesting that the indirect effect of strategic drawing knowledge on performance was not transmitted through the accuracy of situational drawing. This finding indicates that situational drawings play a minor role in modelling in comparison with mathematical drawings. It may also explain why expert problem solvers often omit situational drawings but frequently make use of mathematical drawings (Presmeg, 1986a; Stylianou, 2011).
Further analyses confirmed that the type of drawing is important for the efficacy of drawing. Both situational and mathematical drawings are related to modelling performance but in different ways. A situational drawing is not directly related to modelling performance. However, the accuracy of a mathematical drawing turned out to be strongly related to modelling performance. This finding supports the postulated order of the situational model and the mathematical model in idealized modelling activities (Blum & Leiss, 2007; Galbraith & Stillman, 2006; Verschaffel et al., 2000) and stresses the central role of abstraction and generalization in mathematics
(Dubinsky, 1991). Moreover, the accuracy of a situational drawing is indirectly related to students’ modelling performance, and this relation is mediated by the accuracy of the mathematical drawing. Therefore, a situational drawing – which in previous research often came along with poor modelling performance (Hegarty & Kozhevnikov, 1999; Van Garderen, Scheuermann, & Jackson, 2013) – should not be rated as
inappropriate for successful modelling.
In order to explain the effects of situational and mathematical drawings on students’ modelling performance, we conducted an in-depth analysis of students’ drawings for an exemplary modelling task. The indirect effect of a situational drawing on modelling performance can be explained as follows: When generating a situational drawing, the student has to select and organize the solution-relevant objects and relations described in the problem. This deepens the student’s understanding of the problem situation. Understanding the problem and building an adequate situational model is of great importance for successful problem solving (Leiss et al., 2010). Further, the situational drawing can help the student detect the implicit mathematical structure by reducing the situational objects to their relevant mathematical features and inserting notional objects such as lines and angles (Arcavi, 2003). In this way, a situational drawing promotes the construction of a mathematical drawing and helps the student manage the transition from reality to mathematics in the modelling cycle (Blum & Leiss, 2007). Besides, it is possible that a situational drawing supports modelling by
promoting the interpretation and validation of the mathematical result with regard to reality. However, the interpretation and validation of the mathematical results were not assessed in the present study, and the effect of the situational drawing on these processes remains an important open question. A mathematical drawing is strongly
However, the relations between the two types of drawings and modelling performance are not perfect. The student might disregard important aspects of the situational drawing when constructing the mathematical drawing. This may be due to disproportionately strong simplification or to the student being distracted by irrelevant details in the situational drawing (Presmeg, 2006). Further, correct mathematical drawings do not automatically lead to a correct solution if the student does not possess the requested computational skills.
Some practical implications may be carefully deduced from the presented results. In order to enhance students’ ability to use drawings efficiently, classroom practice should strengthen students’ strategic knowledge about drawing and their competency to create drawings of high accuracy. If students know what a helpful drawing is and how to construct and use such a drawing, they are more likely to generate appropriate, high-accuracy drawings, and this will increase their modelling performance down the line. Students’ drawing skills can be improved by providing them with instructional support (Van Meter & Garner, 2005) and sufficient practice in drawing (Csíkos et al., 2012; Uesaka et al., 2010).
Second, our findings suggest an adaptive use of situational and mathematical drawings for modelling. We identified a close link between the generation of a mathematical drawing and successful problem solving. However, this type of drawing is sophisticated as it demands the recognition of the mathematical structure, which is not directly apparent in the problem description. Students often struggle to make the direct transition between reality and mathematics in the modelling process. In these cases, it can be helpful if students first construct a situational drawing to deepen their understanding of the problem situation. In a second step, this drawing can be reduced to its relevant mathematical aspects. However, both teachers and students should be aware of the fact that a situational drawing should serve only as a steppingstone that helps the student arrive at the abstract mathematical problem structure. Alternatively, high ability students who do not struggle with problem comprehension may wish to delve directly into making a mathematical drawing that focuses on the abstract
mathematical problem structure. These students can be advised to omit the situational type of drawing and to make a mathematical drawing directly. However, the adaptive use of situational and mathematical drawing requires teachers to have high diagnostic skills in addition to the advanced strategic drawing knowledge required of the
students.
5.1 Limitations and future directions
We conducted a mediation analysis to examine the interrelations of strategic drawing knowledge, the type and accuracy of drawings generated, and modelling performance. The causal interpretation of paths in the hypothesized model constitutes an important limitation of this study. Support for the postulated effects mainly comes from the theoretical framework of mathematical modelling which hypothesizes that solving a modelling problem requires the construction of a model of the situation before a mathematical model can be constructed and the problem can be solved (e.g., Blum & Leiss, 2007; Galbraith & Stillman, 2006; Schukajlow, 2011; Verschaffel et al., 2000). These theoretical assumptions have further been supported by empirical evidence
(Borromeo Ferri, 2006, 2007). As the modelling problems used in this study can be considered sufficiently challenging for students to require the construction of a model of the situation and of a mathematical model, we hypothesize that externalizing the situational model first in a situational drawing can support the construction of a mathematical model that results in a mathematical drawing. In this way,
mathematical drawing creates the basis for the solution of the problem. It is possible that a student constructs a mathematical model mentally before making the
situational drawing, but this does not contradict the hypothesized direction of effects as externalizing the mental model in the situational drawing might make the student realize misconceptions, initiate a revision of the mental model, and affect modelling performance this way. However, it is an important limitation of this study that we did not control whether students respected the order of (a) making a situational drawing, (b) making a mathematical drawing, and (c) solving the problem. Future studies, which experimentally manipulate the sequence of drawing types, could expand upon this research and clarify sequence effects of situational and mathematical drawing on modelling performance.
Further, it is possible that our specification of the hypothesized mediation model was incomplete. Potentially underlying variables (e.g., students’ mathematical ability) and further important mediators (e.g., motivational and task-related factors (Uesaka et al., 2007)) could be added to the model. The identification of additional factors that may influence the efficacy of learner-generated drawing and the investigation of their interactions should be important issues for future research. Besides the accuracy of a drawing, future research should consider the richness of drawings in terms of the numbers of elements represented in the drawing. It remains an open question whether a very elaborated situational drawing helps or hinders the construction of an accurate mathematical drawing (Presmeg, 1986b). Moreover, in order to increase the stability of the mediation analyses and to obtain better estimates of the path coefficients, future research should include larger sample sizes.
The current study identified drawing-related factors that are related to students’ performance as they work on modelling problems. Our mediation model was based on the assumption that constructing an adequate model of the situation and a correct mathematical model are essential modelling activities and that asking students to create situational and mathematical drawings can promote the former and the latter, respectively. Consequently, our results cannot be generalized to other types of word problems such as dressed-up problems, which present a pre-structured and simplified model of a situation to the students (see, for example, the dressed-up problem
“Football pitch” by Schukajlow et al. (2012)). For such types of word problems, it is conceivable that the situational drawing or even both types of drawings might not be needed as the student can often almost directly proceed to the mathematical model. In addition, results cannot be transferred to even more complex modelling problems that demand very sophisticated model construction skills (e.g., modelling problems that students work on for several days (Stender & Kaiser, 2015)). To solve this type of modelling problems, situational drawings might be particularly important.
for problems with non-geometric contents, whose solutions do not imply the
construction of a spatial mathematical model such as a right-angled triangle, different results may be obtained.
We know from previous studies that most students do not solve a task in a test situation if they are not requested to do so (Krug & Schukajlow, 2013). However, we did not check whether students tried to solve the tasks presented on the strategic knowledge test. This remains a limitation of the current study.
Further, students were instructed to create drawings in this study. As previous research indicates different effects of students’ spontaneous drawing on problem solving performance, results cannot be generalized to situations where students draw on their own initiative. Our results remain highly relevant to daily classroom practice as instructions to make a drawing are commonly used in textbooks and by teachers (Dufour-Janvier, Bednarz, & Belanger, 1987).
Another limitation of this study lies in the psychometrically unsatisfactory reliabilities of the instruments measuring students’ strategic knowledge about drawing and their drawing accuracy. These may become comprehensible when considering that the test items involved heterogeneous situational contexts and diverse mathematical contents in order to realize high content validity. It can be expected that limiting the strategic knowledge test’s items to one mathematical content would increase the instrument’s reliability as students’ mathematical knowledge, which is an influencing factor, would be more homogeneous. Thus, the tests’ rather low internal consistencies indicate that students’ knowledge and use of drawings is highly task-dependent and lack cross-task consistency. This finding is in line with previous research on students’ strategic knowledge and use of representation and text comprehension strategies (Diezmann, 2005; Souvignier & Mokhlesgerami, 2006). Due to the rather low internal
consistencies, students’ test scores should carefully be interpreted as individual values of knowledge and drawing accuracy for the concrete measuring instruments at this time. Future research should investigate whether educational interventions that teach students how to develop consistent strategic knowledge and drawing skills come along with better psychometrical test quality, which would indicate that the test items form a psychometrical scale.
5.2 Conclusion
Make a drawing–instructions that are frequently used in mathematics classes–is a promising tool for supporting students’ mathematical modelling. The efficacy of such instructions depends on specific conditions. To profit from self-generated drawing, this study’s findings indicate that students have to possess sufficient strategic knowledge about drawing and the competency to create accurate mathematical drawings that support modelling performance. Different types of drawings are related to modelling in different ways. Our findings support the hypothesis that mathematical drawings are particularly helpful for modelling problem solving. However, this type of drawing is difficult to construct. Situational drawings were not found to be directly related to modelling performance, but they may support students in constructing the mathematical drawing by helping them recognize the mathematical structure
also be beneficial to mathematical modelling.
Notes
Author note
The present study was conducted within the framework of the project Visualization
while solving modelling problems (ViMo), which is directed by Stanislaw Schukajlow
and Claudia Leopold and funded by the German Research Foundation [Deutsche Forschungsgemeinschaft].
Supplementary material
10649_2016_9736_MOESM1_ESM.docx (533 kb) ESM 1 (DOCX 533 kb)
Appendix A
Explanation of a situational drawing and a mathematical
drawing for the sugarloaf task (Blum & Leiss, 2007)
Sugarloaf
From a newspaper article:
The Sugarloaf cableway takes approximately 3 min for its ride from the valley station to the peak of the Sugarloaf mountain in Rio de Janeiro. It runs with a speed of 30
and covers a height difference of approximately 180 m. The chief engineer, Giuseppe Pelligrini, would very much prefer to walk—as he did previously when he was a mountaineer and first ran from the valley station across the vast plain to the mountain and then climbed it in 12 min.
What is the approximate distance that Giuseppe had to run from the valley station to the foot of the mountain?
This task is given as an explanation. You do not have to solve the task!
When working on a word problem, you can make a situational drawing or a
km h
Appendix B
Modelling problem “Maypole” used in this study
(Schukajlow & Leiss, 2011)
References
Arcavi, A. (2003). The role of visual representations in learning mathematics.
Educational Studies in Mathematics, 52, 215–241.
CrossRef (https://doi.org/10.1023/A%3A1024312321077) Google Scholar (http://scholar.google.com
/scholar_lookup?title=The%20role%20of%20visual%20representations%20in%20lea rning%20mathematics&author=A.%20Arcavi&
journal=Educational%20Studies%20in%20Mathematics&volume=52& pages=215-241&publication_year=2003)
Blum, W. (2011). Can modelling be taught and learnt? Some answers from empirical research. In G. Kaiser, W. Blum, R. Borromeo Ferri, & G. Stillman (Eds.), Trends in
the teaching and learning of mathematical modelling - Proceedings of ICTMA14 (pp.
15–30). New York: Springer.
CrossRef (https://doi.org/10.1007/978-94-007-0910-2_3) Google Scholar (http://scholar.google.com
%3F%20Some%20answers%20from%20empirical%20research& author=W.%20Blum&pages=15-30&publication_year=2011)
Blum, W., & Leiss, D. (2007). How do students and teachers deal with mathematical modelling problems? The example sugarloaf and the DISUM project. In C. Haines, P. L. Galbraith, W. Blum, & S. Khan (Eds.), Mathematical modelling (ICTMA 12):
Education, engineering and economics (pp. 222–231). Chichester: Horwood.
CrossRef (https://doi.org/10.1533/9780857099419.5.221) Google Scholar (http://scholar.google.com
/scholar_lookup?title=How%20do%20students%20and%20teachers%20deal%20wit h%20mathematical%20modelling%20problems
%3F%20The%20example%20sugarloaf%20and%20the%20DISUM%20project& author=W.%20Blum&author=D.%20Leiss&pages=222-231&publication_year=2007) Booth, R. D., & Thomas, M. O. (1999). Visualization in mathematics learning:
Arithmetic problem-solving and student difficulties. The Journal of Mathematical
Behavior, 18(2), 169–190.
CrossRef (https://doi.org/10.1016/S0732-3123(99)00027-9) Google Scholar (http://scholar.google.com
/scholar_lookup?title=Visualization%20in%20mathematics%20learning %3A%20Arithmetic%20problem-solving%20and%20student%20difficulties& author=RD.%20Booth&author=MO.%20Thomas&
journal=The%20Journal%20of%20Mathematical%20Behavior&volume=18& issue=2&pages=169-190&publication_year=1999)
Borromeo Ferri, R. (2006). Theoretical and empirical differentiations of the phases in the modelling process. ZDM–The International Journal on Mathematics Education,
38(2), 86–95.
CrossRef (https://doi.org/10.1007/BF02655883) Google Scholar (http://scholar.google.com
/scholar_lookup?title=Theoretical%20and%20empirical%20differentiations%20of%2 0the%20phases%20in%20the%20modelling%20process&
author=R.%20Borromeo%20Ferri&journal=ZDM%E2%80
%93The%20International%20Journal%20on%20Mathematics%20Education& volume=38&issue=2&pages=86-95&publication_year=2006)
Borromeo Ferri, R. (2007). Individual modelling routes of pupils – Analysis of modelling problems in mathematical lessons from a cognitive perspective. In C. Haines (Ed.), Mathematical modelling (ICTMA 12): Education, engineering and
economics (pp. 260–270). Chichester: Horwood.
CrossRef (https://doi.org/10.1533/9780857099419.5.260) Google Scholar (http://scholar.google.com
/scholar_lookup?title=Individual%20modelling%20routes%20of%20pupils%20%E2 %80%93
%20Analysis%20of%20modelling%20problems%20in%20mathematical%20lessons% 20from%20a%20cognitive%20perspective&author=R.%20Borromeo%20Ferri& pages=260-270&publication_year=2007)
Bryant, F. B., & Satorra, A. (2012). Principles and practice of scaled difference chi-square testing. Structural Equation Modeling: A Multidisciplinary Journal, 19(3), 372–398.
journal=Structural%20Equation%20Modeling
%3A%20A%20Multidisciplinary%20Journal&volume=19&issue=3&pages=372-398& publication_year=2012)
Cox, R. (1999). Representation construction, externalised cognition and individual differences. Learning and Instruction, 9(4), 343–363.
CrossRef (https://doi.org/10.1016/S0959-4752(98)00051-6) Google Scholar (http://scholar.google.com
/scholar_lookup?title=Representation%20construction
%2C%20externalised%20cognition%20and%20individual%20differences&
author=R.%20Cox&journal=Learning%20and%20Instruction&volume=9&issue=4& pages=343-363&publication_year=1999)
Csíkos, C., Szitányi, J., & Kelemen, R. (2012). The effects of using drawings in
developing young children’s mathematical word problem solving: A design experiment with third-grade Hungarian students. Educational Studies in Mathematics, 81(1), 47–65.
CrossRef (https://doi.org/10.1007/s10649-011-9360-z) Google Scholar (http://scholar.google.com
/scholar_lookup?title=The%20effects%20of%20using%20drawings%20in%20develo ping%20young%20children%E2%80 %99s%20mathematical%20word%20problem%20solving %3A%20A%20design%20experiment%20with%20third-grade%20Hungarian%20students&author=C.%20Cs%C3%ADkos&author=J.%20Szit %C3%A1nyi&author=R.%20Kelemen& journal=Educational%20Studies%20in%20Mathematics&volume=81&issue=1& pages=47-65&publication_year=2012)
De Bock, D., Verschaffel, L., Janssens, D., Van Dooren, W., & Claes, K. (2003). Do realistic contexts and graphical representations always have a beneficial impact on students’ performance? Negative evidence from a study on modeling non-linear geometry problems. Learning and Instruction, 13(4), 441–463.
CrossRef (https://doi.org/10.1016/S0959-4752(02)00040-3) Google Scholar (http://scholar.google.com
/scholar_lookup?title=Do%20realistic%20contexts%20and%20graphical%20represe ntations%20always%20have%20a%20beneficial%20impact%20on%20students %E2%80%99%20performance %3F%20Negative%20evidence%20from%20a%20study%20on%20modeling%20non-linear%20geometry%20problems&author=D.%20Bock&author=L.%20Verschaffel& author=D.%20Janssens&author=W.%20Dooren&author=K.%20Claes& journal=Learning%20and%20Instruction&volume=13&issue=4&pages=441-463& publication_year=2003)
De Bock, D., Verschaffel, L., & Janssens, D. (1998). The predominance of the linear model in secondary school students’ solutions of word problems involving length and area of similar plane figures. Educational Studies in Mathematics, 35(1), 65–83. CrossRef (https://doi.org/10.1023/A%3A1003151011999)
Google Scholar (http://scholar.google.com
/scholar_lookup?title=The%20predominance%20of%20the%20linear%20model%20i n%20secondary%20school%20students%E2%80 %99%20solutions%20of%20word%20problems%20involving%20length%20and%20 area%20of%20similar%20plane%20figures&author=D.%20Bock& author=L.%20Verschaffel&author=D.%20Janssens& journal=Educational%20Studies%20in%20Mathematics&volume=35&issue=1&