HAL Id: tel-02880464
https://tel.archives-ouvertes.fr/tel-02880464
Submitted on 25 Jun 2020HAL is a multi-disciplinary open access
archive for the deposit and dissemination of sci-entific research documents, whether they are pub-lished or not. The documents may come from teaching and research institutions in France or abroad, or from public or private research centers.
L’archive ouverte pluridisciplinaire HAL, est destinée au dépôt et à la diffusion de documents scientifiques de niveau recherche, publiés ou non, émanant des établissements d’enseignement et de recherche français ou étrangers, des laboratoires publics ou privés.
Video-based algorithms for accident detections
Boutheina Maaloul
To cite this version:
Boutheina Maaloul. Video-based algorithms for accident detections. Data Structures and Algorithms [cs.DS]. Université de Valenciennes et du Hainaut-Cambresis; Université de Mons, 2018. English. �NNT : 2018VALE0028�. �tel-02880464�
Thèse de doctorat
Pour obtenir le grade de Docteur de l’Université de
VALENCIENNES ET DU HAINAUT-CAMBRESIS
et l’université de MONS
Discipline :Informatique
Présentée et soutenue par Boutheina , MAALOUL.
Soutenue le 16 juillet 2018 à Valenciennes
Ecole doctorale :
Sciences Pour l’Ingénieur (SPI)
Equipe de recherche, Laboratoire :
Laboratoire d’Automatique, de Mécanique et d’Informatique Industrielles et Humaines (LAMIH)
Video-Based Algorithms for Accident Detections
Des algorithmes de détection d'accidents routiers par vidéo surveillance
JURY
Président du jury
- Ruichek, Yassine. Professeur. Université de Valenciennes, France.
Rapporteurs
- Ruichek, Yassine. Professeur. Université de Valenciennes, France. - Lagadec, Loic. Professeur. ENSTA Bretagne, France.
Examinateurs
- Taleb-Ahmed, Abdelmalik. Professeur. Université de Valenciennes. - Braeken, An. Professeur. Université de Bruxelles, Belgique.
- Harb, Naim. Docteur, Ingenieur. Satt Nord, France
-Dualibe, Fortunato. Professeur, Université de Mons, Belgique.
Co-directeur de thèse : Niar, Smail. Professeur. Université de Valenciennes. Co-directeur de thèse : Valderrama, Carlos. Professeur. Université de Mons.
i
Content
CONTENT ... I LIST OF ABBREVIATIONS ... III LIST OF FIGURES ... IV LIST OF TABLES ... VI LIST OF CODES ... VII ABSTRACT ... VIII
INTRODUCTION ... 1
1.THE THESIS OBJECTIVES ... 6
2.THE THESIS ORGANIZATION ... 6
CHAPTER 1: ABNORMAL BEHAVIOR AND ACCIDENT DETECTION ON THE ROAD ... 9
1.INTRODUCTION ... 11
2.ABNORMAL BEHAVIOR SCENARIOS ON ROADS ... 11
2.1. Definitions and classification of abnormal behaviors on the road ... 11
2.2. State of the art of pedestrian abnormal behavior detection ... 13
2.3. State of the art of vehicle abnormal behavior detection... 13
3.THE GENERAL STEPS OF THE VIDEO BASED ACCIDENT DETECTION TECHNIQUES ... 15
3.1. Motion detection and tracking ... 16
3.1.1. Background subtraction ... 17
3.1.2. The optical flow ... 19
3.1.2.1. Horn and Schunk method ... 21
3.1.2.2. Lukas Kanade method... 21
3.1.2.3. Farnebäck method ... 22
3.1.3. Scale Invariant Feature Transform ... 23
3.1.4. Vehicle recognition ... 24
3.1.5. Vehicle velocity and orientation computation ... 25
3.2. Features extraction ... 26
3.3. Accident recognition ... 27
3.3.1. The comparison to predefined fixed thresholds ... 27
3.3.2. The use of learned models ... 29
4.CONCLUSION ... 32
ii
1.INTRODUCTION ... 37
2.ACCIDENT DETECTION BASED ON VEHICLE MOTION ... 37
2.1. Vehicle recognition ... 39
2.2. The Kalman filter ... 40
2.3. The Hungarian algorithm ... 41
2.4. Accident recognition ... 41
3.ACCIDENT DETECTION BASED ON PARTICLES MOTION ... 43
3.1. First approach: OF, histogram computation and fixed thresholds ... 43
3.1.1. Method 1 ... 44
3.1.2. Method 2 ... 46
3.1.3. Method 3 ... 47
3.1.4. Accident recognition ... 47
3.2. Second approach: Traffic modeling and dynamic threshold computation ... 49
3.2.1. Velocities classification and noise filtering ... 49
3.2.2. Normal motion flow modeling ... 50
3.2.3. Accident recognition: Adaptive threshold computation and accident detection ... 53
3.2.4. Automatic traffic orientation detection ... 55
3.2.5. Accident localization... 55
4.CONCLUSION ... 56
CHAPTER 3: EVALUATION RESULTS AND PERFORMANCE ANALYSIS ... 57
1.INTRODUCTION ... 59
2.ACCIDENT DETECTION BASED ON VEHICLE TRACKING ... 59
2.1. BS and object extraction experimental results ... 59
2.2. Vehicle tracking ... 61
2.3. Threshold computation and accident detection ... 61
3.ACCIDENT DETECTION BASED ON PARTICLE TRACKING ... 65
3.1. First approach: defining histogram and fixed thresholds computation ... 65
3.2. Second approach: Traffic modeling and dynamic threshold computation results ... 69
4.CONCLUSION ... 73
CONCLUSION ... 74
REFERENCES ... 77
iii
List of abbreviations
EDM Emergency and Disaster Management
OF Optical Flow
ROI Region of Interest
EU European Commission
BS Background Subtraction
GMM Gaussian Mixture Model
SIFT Scale Invariant Feature Transform descriptor
SURF Speeded Up Robust Features
HOG Histogram of Oriented Histogram
SVM Support Vector Machine
VF Velocity Feature
PF Position Features
SF Area Feature
DF Direction Feature
C-HMM Continuous Hidden Markov Model
HFG Histogram of Flow gradient
SPH Smoothed Particle Hydrodynamics
BOF Bag of Feature
ELM Extreme Learning Machine classifier
CPR Correct Positive Results APR All Positive Results EPR Effective Positive
iv
List of Figures
FIGURE 1:AN OPERATOR SUPERVISING SOME ROADS IN GIRONDE TRAFFIC MANAGEMENT CENTER-FRANCE ... 2
FIGURE 2:THE BLOCK DIAGRAM OF DRIVER ABNORMAL BEHAVIOR DETECTION ON ROADS ... 14
FIGURE 3:EXAMPLES OF VEHICLE ABNORMAL TRAJECTORY [MORIS AND TRIVEDI,2008] ... 15
FIGURE 4:THE BLOCK DIAGRAM OF THE VIDEO BASED ACCIDENT DETECTION TECHNIQUES. ... 16
FIGURE 5:A FLOWCHART OF A BASIC BACKGROUND SUBTRACTION ... 18
FIGURE 6:EXAMPLE OF SHADOW ELIMINATION ON A TRAFFIC SCENE [LEE,2012] ... 19
FIGURE 7:VELOCITY VECTORS OF SOME POINTS OF INTEREST IN A FRAME COMPUTED BY THE LUKAS KANADE OF APPROACH ... 21
FIGURE 8:THE RESULTS OF FARNEBÄCK OF APPLIED ON A TRAFFIC SCENE.(A): THE ORIGINAL FRAME,(B): THE DRAWING IN BLUE OF THE VELOCITY VECTORS COMPUTED WITH THE FARNEBÄCK OF. ... 23
FIGURE 9:AN EXAMPLE OF MATCHING BETWEEN TWO IMAGES USING SIFT[MOREL,2011]. ... 24
FIGURE 10:THE BLOCK DIAGRAM OF HOG FOLLOWED BY THE SVM. ... 25
FIGURE 11:AN EXAMPLE OF VECTOR VELOCITY COMPUTATION ... 26
FIGURE 12:ACCIDENT DETECTION ALGORITHM FLOWCHART.V,(X , Y), S, Θ ARE RESPECTIVELY THE VELOCITY, THE COORDINATE OF THE CENTROID OF THE VEHICLE, ITS SURFACE AND THE ANGLE FORMED BETWEEN TWO MOTIONS VECTORS. A, B, C, D, E, F, G, H, I, J, K ARE THRESHOLDS. ... 28
FIGURE 13:THE BLOCK DIAGRAM OF HFG ALGORITHM. Ρ AND Θ ARE THE MAGNITUDE AND THE VELOCITY ANGLE RESPECTIVELY. 30 FIGURE 14:THE BLOCK DIAGRAM OF ACCIDENT DETECTION ALGORITHM BASED ON ELM. ... 31
FIGURE 15:THE FLOW CHART OF THE ALGORITHM OF ACCIDENT DETECTION BASED ON VEHICLE TRACKING ... 38
FIGURE 16:A SCREEN SHOT OF TRACKING RESULTS USING THE KALMAN FILTER.COLORED LINES ARE VEHICLE TRAJECTORIES. ... 42
FIGURE 17:A FLOWCHART OF AN ACCIDENT DETECTION ALGORITHM BASED ON OF AND STATIC THRESHOLD ... 44
FIGURE 18:A SCHEMATIC EXPLANATION OF THE HISTOGRAM COMPUTATION ... 45
FIGURE 19:AN EXAMPLE OF MEDIAN COMPUTING FOR A BLOCK OF 3*3 PIXELS ... 46
FIGURE 20:A SCHEMATIC REPRESENTATION OF AVERAGE VECTOR COMPUTATION ... 47
FIGURE 21:EXAMPLE OF HISTOGRAM VARIATION BEFORE AND AFTER A TRAFFIC ACCIDENT. ... 48
FIGURE 22:DIFFERENT VELOCITY VECTORS CLASSIFICATION ... 50
FIGURE 23:THE DIFFERENT STEPS FOR NORMAL TRAFFIC MODELING ... 51
FIGURE 24:SVA AND SVB VARIATION AS A FUNCTION OF FRAMES FOR A NORMAL TRAFFIC SCENE ... 52
FIGURE 25:ADAPTIVE THRESHOLD COMPUTATION AND ACCIDENT DETECTION FLOW CHART. ... 54
FIGURE 26:AN EXAMPLE OF ROAD SEGMENTATION ... 55 FIGURE 27:THE RESULT OF THE BACKGROUND SUBTRACTION ON A FRAME, CLOSE TOGETHER VEHICLES ARE SEEN AS ONE OBJECT 59
v
FIGURE 28: AN EXAMPLE OF VEHICLE TRACKING.THE RED LINES ARE THE LIMITATION OF THE ROI.THE NUMBERS (1) AND (2) ARE THE ASSIGNMENT OF EACH VEHICLE. ... 61 FIGURE 29: VELOCITY AND ORIENTATION VARIATION OF TWO DIFFERENT VEHICLES IN A TRAFFIC SCENE:CAR(4) WITH ABNORMAL
MOTION AND CAR(5) WITH NORMAL MOTION ... 63 FIGURE 30:SOME ANNOTATED DETECTED ACCIDENTS ... 64 FIGURE 31:AN EXAMPLE OF HISTOGRAM RESULTS BEFORE AND AFTER ACCIDENT.FOR THIS EXAMPLE, BIN3 AND BIN6 CHANGE
SLIGHTLY WHEN AN ACCIDENT OCCURS ... 67 FIGURE 32:VELOCITY FLOWING THE RANGE OF ORIENTATION OF BIN3(A) AND BIN6(B) VARIATION IN FUNCTION OF FRAMES. ... 68 FIGURE 33:VARIATION IN P AND R FOR DIFFERENT VALUES OF N AND Λ ... 70 FIGURE 34:VARIATION IN THE 𝐹1_𝑠𝑐𝑜𝑟𝑒 FOR DIFFERENT VALUES OF Λ AND N ... 71 FIGURE 35:EXAMPLES OF DETECTED ACCIDENT SCENES WITH THE PROPOSED APPROACH.ACCIDENTS ARE ANNOTATED BY
vi
List of tables
TABLE 1:ROAD ABNORMAL BEHAVIOR EVENTS CLASSIFICATION ... 12
TABLE 2:A COMPARISON STUDY OF THE DIFFERENT VIDEO BASED APPROACHES FOR ACCIDENT DETECTION ... 34
TABLE 3:DIFFERENT BACKGROUND SUBTRACTION ALGORITHM TESTED ON AN ACCIDENT SCENE. ... 60
TABLE 4:EXPERIMENTAL RESULTS OF THE FIRST APPROACH ... 64
TABLE 5:A COMPARATIVE STUDY OF THE DETECTION RATES FOR DIFFERENT VIDEOS USING DIFFERENT BLOCK SIZES. ... 66
TABLE 6:EXPERIMENTAL RESULTS OF THE ALGORITHM BASED ON HISTOGRAM AND FIXED THRESHOLD COMPUTATION ... 69
vii
List of codes
viii
Abstract
Automatic video surveillance systems have been developed to detect and analyze abnormal behavior or situation of risk in many fields reducing human monitoring of activities captured by cameras (security surveillance, abnormal behavior detection, etc.). One of the applications of video surveillance is the traffic monitoring. Analyzing the motion in roads aims to detect abnormal traffic behavior and sudden events, especially in case of Emergency and Disaster Management (EDM).
Road accidents can cause serious injuries affecting mostly the head and the brain, leading to lifelong disabilities and even death; each additional rescue minute can mean the difference between life and death as revealed by the golden Hour[Lerner et al., 2001]. Therefore, providing a rapid assistance for injuries is mandatory. Moreover, if not addressed promptly, accidents may cause traffic jams, eventually leading to more accidents, and even greater loss of lives and properties.
Many cities in France are equipped with video surveillance cameras installed on different roads and highways. Traffic monitoring is done by human operators to visualize the congestion of a road or to measure the flow of the traffic. The video stream of this existing network of cameras is delivered unprocessed to the traffic management center. Thus, there are no video storage of accident scenes. In addition, there is no associated technology for a rapid emergency management. Therefore, it is important to design a system able to organize an effective emergency response. This response should be based, firstly on an automatic detection by video analysis, then, on a rapid notification allowing the optimization of the emergency intervention itinerary without affecting the traffic state. Our work resolves the first part of the emergency response.
The objectives of this thesis are firstly the identification of accident scenarios and the collection of data related to road accident; next, the design and the development of video processing algorithms for the automatic detection of accidents in highways. The developed solutions will use the existing fixed cameras, so as not to require significant
ix
investments in infrastructure. The core of the proposed approaches will focus on the use of the dense Optical Flow (OF) algorithm [Farnebäck, 2003] and heuristic computations for features extraction and accident recognition. The purpose of the dense OF is to estimate the motion of each pixel in a region of interest (ROI) between two given frames. At the output of the dense OF, a dense features could be extracted which is more performant than features extracted at some points. Defining thresholds for accident detection in various environment is very challenging. Therefore, studying the motion at a global scale in the image, allows defining a dynamic thresholds for accident detection using statistic computations. The proposed solution is sufficient and robust to noise and light changing.
1
Introduction
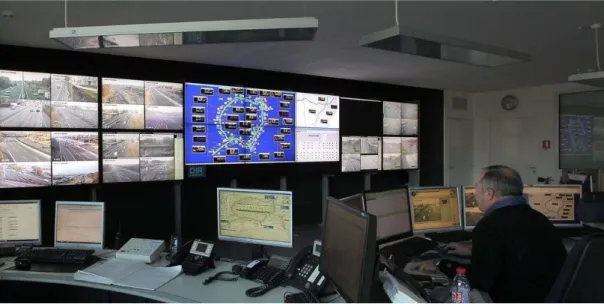
Video surveillance has become today an essential system established in the majority of the public area (stores, public transport, and roads, etc.) and extended to private spaces (houses and companies) to improve the security monitoring and the EDM. The images obtained with this system are then processed for different detection purposes (lost or abandoned object detection, abnormal behavior detection in crowded places, robbers, controlling access to some building, etc.). Videos may be archived for future use by police or insurance companies to provide evidence. Usually, cameras are connected to a control center, using optical fibers and other connectivity solutions for video transmission, where human operators check the presence of risk situations. However, the operator cannot simultaneously focus on multiple monitors. Therefore, automatic processing, detection and alerting techniques are mandatory to ensure continuous monitoring with accurate information to alert adverse events in a short time. The progress of computer vision techniques allowed the development of different algorithms for automatic detection of different incidents and dangerous situations. The implementation of these algorithms in the computers of the monitoring stations allows informing the operator of the occurrence of a sudden dangerous events. Under these conditions, the operator can trigger the most appropriate response scenario in the shortest possible time as presented in Figure 1.
Nowadays, with the increasing number of vehicles due to the rising number of population and urban areas, traffic monitoring has become one of the most important issues of video surveillance [Bunch et al., 2011]. We distinguish two categories of traffic monitoring. The aim of the first category is the measurement in real time of traffic parameters to insure a fluid traffic and avoid accidents. The second category is abnormal event detection which concerns the detection of unexpected events that may affect the safety of road users and thus improving the rescue of injured people [Fishbain and Yaroslavsky, 2009].
2
- Vehicle counting
- Vehicles tracking: speed detection, vehicle motion analysis - Traffic jam detection
- Distinguishing the absence and the presence of vehicles on road to compute the traffic density on road
- License plate recognition - Pedestrian detection on road
- The control of traffic light (for example duration of the green traffic signal depends on traffic density)
For the second category of traffic monitoring, traffic abnormal events include all signs of violation of roads rules and traffic legislation by road users (drivers and pedestrians). The most considered dangerous abnormal situations are accidents where the life of road users must be saved.
Figure 1: An operator supervising some roads in Gironde traffic management center-France1
3
In our research, we are interested in the detection of accidents on the road because of their significant impact on the death rate on especially in motorways.
Road accidents can cause serious injuries leading to lifelong disabilities and even death; each additional rescue minute can mean the difference between life and death as revealed by The Golden hour [Lerner et al., 2001]. It is the hour representing the maximum time to rescue injured from the beginning of accident until they arrive to the operation room. Therefore, providing rapid assistance to injured is mandatory. Moreover, if not addressed promptly, accidents may cause traffic jams and eventually accidents’ escalation, especially on highways, where accidents are most likely to occur. A statistic study in France shows that the number of accidents in highways has increased by 25% in 20152, while the number of accidents in urban region remains the same.
European Commission(EU)3, in 2011, has set the goal of halving the number of
fatalities caused by traffic accidents. One of the token step is to implement automatic detection systems, based on sensors, for early notification of accidents to authorities and emergency centers.
Existing techniques of automatic accident detection are based on sensors [Parkany and Chi Xi, 2005]. The most used sensors are:
1. Inductive loop detector
It is a low cost sensor fixed in road and the most commonly used traffic collection data. There is many studies for incident detection using this sensor with the application of artificial intelligence [Rossi et al., 2015].
2. Acoustic sensor
It is composed of dipole array of microphone. It detect the presence of a vehicle by their noise allowing vehicles counting and tracking, and the measurement of the
2 http://www.securiteroutiere.gouv.fr
4
traffic flow. A sound of an accident could be recognized as presented in [Kim, 2008]. The limitation of these technique is the presence of interference between the sounds of many vehicles.
3. Smartphones
Some applications were developed for smartphones to guide the drivers towards the shortest roads avoiding traffic jams and places where an accident occurs. Some of these applications are based on drivers’ information share, by manual entering the information to the application when witnessing an accident. An example of these applications is Wize4. Other researchers combine smartphone with accelerometers and
acoustic data, to detect and notify emergency centers after an accident and provide situational awareness through photographs, GPS coordinates and VOIP communication [White and all, 2011].
4. Radar
Radars can help detecting a slight increase of a vehicle speed but alone cannot give enough information when accident occurs. Indeed, multi-tracks radars can count the number of vehicles, thus, the road traffic density, what can indicate a possible accident or traffic jam. These systems are combined with cameras to identify the nature of the problem.
5. Ecall system
The EU aims at introducing the eCall system in all vehicles5. The concept of the eCall system is based on sensors detecting the occurrence of the accident (for example when the airbag is triggered) and the activation of a SIM card that automatically calls the authorities and emergency services.
4 https://www.waze.com
5 6. Video surveillance
The systems mentioned above do not provide sufficient information like surveillance cameras, covering vast areas. Extra information such as the number of injured persons, the number of damaged cars and the severity of the accident help analyzing the traffic situation and making rapid decisions. Traffic cameras provide detailed information on the accident causes, a direct communication infrastructure, and video storage resources that could be used as evidence or for further analysis.
Some industrial companies like Citilog6, Ipsotek7, Macq8 and Dallmeier9 have
deployed accident detection systems based on cameras with frameworks running in centers of traffic controls or using intelligent cameras. They assume that their systems are able to detect accidents in tunnel, bridges, at intersection roads and in highways. Information can be reported after that to the infrastructure. However there is no enough information about their algorithms and there are no meaningful results declared such as the detection rate and the used datasets for algorithms testing, etc. Consequently, we cannot conclude about the reliability of their methodology. In addition their systems are based on their own made intelligent high resolution cameras and are not yet deployed in many cities.
In our study, we consider video surveillance techniques as the most promising technique providing a big amount of information from images with a low cost. Indeed, the detection can be performed using the video flow coming from standard cameras, already mounted on poles above roads.
6 http://www.citilog.com 7 http://www.ipsotek.com 8 http://www.macq.eu/fr_BE/
6
1. The thesis objectives
Many cities in France are equipped with video surveillance cameras on different roads and highways. Traffic monitoring is done by human operators to visualize the congestion of a road or to measure the traffic flow. The video stream of this existing network of cameras is delivered raw and unprocessed to the traffic management center and is not saved. Thus, there is no video storage of accident scenes. In addition there is no associated technology for emergency management. It is therefore important to design a system for an automatic accident detection and a rapid notification.
The objectives of this thesis is the study and the development of accurate video processing algorithms for the automatic detection of accidents. Our developed approaches will use the stream of existing fixed cameras on roads, so as not to require significant investments in infrastructure. The algorithms will be based on the dense OF for features extraction and heuristic computations for accident detection. The dense OF allows the estimation of the velocity and the orientation of each pixel in the ROI which provides dense information at a global scale. However, the accident recognition is the most challenging part especially in case of the lack of a common dataset. Therefore, static and adaptive dynamic thresholds for accident recognition will be used. The proposed solution must be accurate and robust to noise and light changes.
2. The thesis organization
We present in this section a brief summary of the content of the different chapters detailing our work and contributions:
Chapter 1: Abnormal behavior and accidents detection on the road In this chapter, we present the state of the art of the video based abnormal behaviors detection and accidents detection on roads. First we classified the different scenarios of abnormal behavior on road. Then, we analyzed and classified the existing approach of detection. A theoretical
7
and a mathematical explanation of the algorithms was presented also. Our study shows that the approaches based on optical flow computation and learning techniques are more promising. However, since experimental tests of all approaches in literature were not performed on the same datasets, the comparison between the different results is not possible. Therefore, in the next chapter we will focus on developing algorithms based on pixels motion analysis using OF and compare them to an algorithm based on vehicles motion analysis.
Chapter 2: Constructive approaches for video-based road accident
detection
We firstly proposed an accident detection approach based on vehicle motion analysis using the kalman filter for cars tracking and a static predefined threshold for accident detection on highways. Then we proposed two other algorithms based on pixels motion analysis using the dense OF for pixels tracking. For the first algorithm we proposed an histogram of orientation computation and a predefined static threshold for the accident recognition part. For the second algorithm, we proposed a traffic modeling approach and a dynamic threshold computation for accident recognition.
Chapter 3: Evaluation results and performance analysis
In this chapter we experimentally defined the values of the different metrics of our proposed approaches. The values of these metrics were changed, correspondent detection rate and the false alarm rate was computed. Consequently, the best fitted values was fixed. Since there is no common benchmarks in compute vision for these topic, experimentations were done on collected videos from websites. Results
8
show that the dense OF combined with a dynamic threshold computation performs a sufficient accident detection rate.
Conclusion and future work
This final part presents the general conclusion of the thesis then the perspectives and recommendations for new researches topics.
9
Chapter 1: Abnormal behavior and accident
detection on the road
Contents
1.INTRODUCTION ... 11
2.ABNORMAL BEHAVIOR SCENARIOS ON ROADS ... 11
2.1. Definitions and classification of abnormal behaviors on the road ... 11
2.2. State of the art of pedestrian abnormal behavior detection ... 13
2.3. State of the art of vehicle abnormal behavior detection... 13
3.THE GENERAL STEPS OF THE VIDEO BASED ACCIDENT DETECTION TECHNIQUES ... 15
3.1. Motion detection and tracking ... 16
3.1.1. Background subtraction ... 17
3.1.2. The optical flow ... 19
3.1.2.1. Horn and Schunk method ... 21
3.1.2.2. Lukas Kanade method... 21
3.1.2.3. Farnebäck method ... 22
3.1.3. Scale Invariant Feature Transform ... 23
3.1.4. Vehicle recognition ... 24
3.1.5. Vehicle velocity and orientation computation ... 25
3.2. Features extraction ... 26
3.3. Accident recognition ... 27
3.3.1. The comparison to predefined fixed thresholds ... 27
3.3.2. The use of learned models ... 29
10
In this chapter we describe the general steps of abnormal behavior detection on road by video surveillance and we present the more relevant existent approaches in literature. Then we focus on the state of the art of video based accident detection techniques and their results. Finally a comparison of this techniques is proposed based on different criteria’s: methodology and used algorithms, accuracy, used datasets, scenarios of detection and time of detection. The limitation of these solutions is discussed.
11
1. Introduction
Abnormal event detection in videos is one of the important issues for computer vision community. It covers different public areas like shopping centers, crowded spaces, and roads. A quick reporting of these activities with detailed information may help avoiding risky situation, and in case of EDM, providing quick rescue for affected people. In this chapter, we classify abnormal behaviors on road then we focus on road accident detection by video surveillance.
The chapter is organized as follows: Section 2 presents the different scenarios of abnormalities on roads, their classification and a quick review of existent approaches for their detection. In section 3, the different steps of video based accident detection approaches are described and the more relevant finding approaches in literature are summarized. We conclude in Section 4.
2. Abnormal behavior scenarios on roads
2.1. Definitions and classification of abnormal behaviors on the
road
A road user (driver and/or pedestrian) behavior is considered as abnormal when the behavior does not respect the roads legislation leading to serious problems such as traffic jams, incidents and accidents. Abnormal behaviors on road are classified in the Table 1 according to our estimation of the severity of each behavior. In case of an abnormal behavior with “Week Severity”, unlikely crashes between vehicles occur. An abnormal behavior with “Medium Severity” may lead to vehicles crashes or pedestrian injury. We consider an abnormal behavior with “Important Severity” all kind of vehicles crashes. Existing approaches for video based abnormal behavior detection on road are based on the vehicles or pedestrian motion analysis. Basically, detecting an abnormal motion in a video sequence starts by extracting the targets that we want to keep an eye on (human or objects, etc.) from the video sequence. These targets are
12
tracked in purpose to compare their activities to the predefined models. These models could be a set of characteristics called features of normal activities and/or abnormal activities. The common basic algorithm used in video processing for motion detection, object recognition, tracking and features extraction in roads will be presented in Section 3.
Week severity Average severity Important severity Vehicle -Vehicle intrusion
on unauthorized
roads and
structures
-Vehicle stopped on the road or on the emergency line -Driver
abandoning his vehicle in the road. - Congestion
-Speeding violation -Illegal turns
-Wrong way driving
-Collusion between vehicle/pedestrian,
vehicle/vehicle, vehicle/ bicycle/ motor.
- Car overturned
-Fire and smoke in tunnels and roads
Pedestrian - Pedestrian crossing
road borders/entering road zone
- Illegal stay of pedestrian on road - Pedestrian moving long the curb.
- Pedestrian fighting
13
2.2. State of the art of pedestrian abnormal behavior detection
Pedestrian abnormal behavior on road is classified as abnormal behavior with “Medium Severity”. Consequently, a rapid detection helps saving lives. For instance, [Qianyin et al. 2015] has established a mathematical model of pedestrian abnormal behavior. Firstly, a Background Subtraction (BS) algorithm and a shadow elimination technique were applied to detect and segment all objects in motion on the road. Each object is modeled by an external rectangle. The ratio of this rectangle (the rectangle’s height to weight) helps distinguishing a pedestrian from a vehicle. Thereafter, pedestrian was tracked and his trajectories was extracted and compared to the model of pedestrian abnormal behavior. This model was defined by authors. The detected scenarios are: Pedestrian crossing road borders, pedestrian entering road zone, illegal stay on road, pedestrian crossing the road, pedestrian moving long the curb. [Hou et al. 2013] performed background modeling to extract the motion area in videos. Filtering technique was applied on the foreground image to detect people in motion. Their trajectories, then, were detected and analyzed to distinguish between normal behavior and abnormal behavior. In this work, the categories of abnormal behavior detected are fights and damages.
2.3. State of the art of vehicle abnormal behavior detection
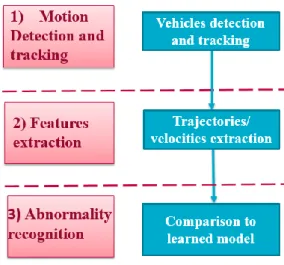
The majority of the state of the art of vehicle abnormal behavior detection are based on vehicles trajectories analysis. The general steps of abnormal behavior detection in road are presented in Figure 2. The first step is motion detection and tracking, then feature extraction and finally abnormal behavior detection. For the first step, vehicle in motion are recognized and tracked, for the second step features are mainly the trajectories and/or velocities of vehicles. Different techniques are used to model the normal trajectories which help the detection of unusual motion.
14
Figure 2: The block diagram of driver abnormal behavior detection on roads
In [Moris and Trivedi, 2008], a study of different approaches of abnormal motion detection technique in different field, including traffic areas, was presented. The authors show that in literature, neural network, iterative optimization, online adaptation, hierarchical method and co-occurrence method are the most used for path learning and normal traffic modeling. They precise that collusion between vehicles at an intersection could be recognized by the detection of the interaction between objects in motion. Figure 3 shows some examples of abnormal trajectories on road presented in this work. Since abnormal detection remains a challenging task, researches continue proposing different approaches. For example, [Cui et al., 2011] used BS and pixel moving velocity computation for motion region classification (pedestrian, vehicle, noise region, etc.). The motions detected are classified using trained local feature’ distribution map. A classifier is used to detect abnormal behaviors. [Li et al. 2015] used the local invariant features and the visual codebook approach for image descriptor, where a Gaussian distribution model was used to detect abnormal behavior. [Cai et al. 2015] proposed a new algorithm for trajectory analysis composed by two parts: trajectory learning and online abnormal detection. The Hidden Marcov model was used to define an activity path pattern and abnormality was detected by comparison to normal trajectories. However, [Mehboob et al, 2016] used other features
15
than trajectory extraction for abnormal detection in road. They extract vehicle number in the frame and their mean velocity to detect congestion. Congestion is considered as incident or caused by incident. Fuzzy logic was used to analyze features for the detection.
Figure 3: Examples of vehicle abnormal trajectory [Moris and Trivedi, 2008]
Early sited works are dedicated for multiple scenarios of abnormal motion detection. Some other researchers preferred to focus their effort on developing algorithm for a specific scenario which is vehicle collusion (accident) detection. Collusion detection can be based also on trajectories analysis and/or other features extraction such as velocity, orientation, acceleration, area, etc. The more relevant approaches for accident detection are described in the following section.
3. The general steps of the video based accident detection
techniques
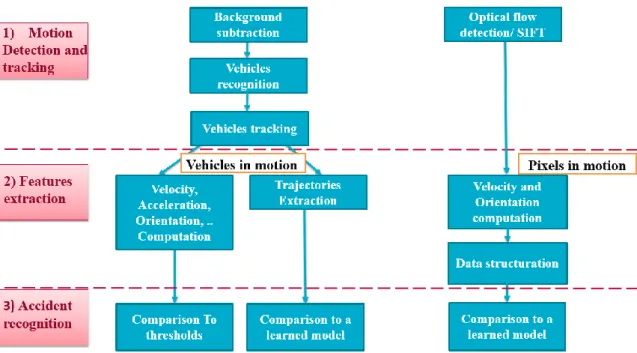
The scenario of road accident used in literature concerns the crash between two or many vehicles in different kind of roads including intersection, urban areas and highways. The same as abnormal behavior detection, the different steps of video based road accident detection are: 1) Motion detection, 2) Feature Extraction and then 3) Features Analysis and Accident Recognition. A block diagram of the sequence of steps
16
to detect an accident is shown in Figure 4 with more details. The most frequently used algorithms for motion detection are BS and OF. The features related to the traffic motion and vehicles trajectories can be extracted using different processing techniques such as tracking. Finally, the analysis of these traffic features allows the differentiation of normal motion versus abnormal.
Figure 4: The block diagram of the video based accident detection techniques.
A few researchers dealt with the problem of traffic accident detection by video surveillance. Existing approaches, sited below, follow the sequence of steps listed in Figure 4. However, the video processing techniques used to perform each step are different.
3.1. Motion detection and tracking
The objective of this step is the localization of all moving objects in the image. It can be done using different methods such as BS, OF and SIFT (the Scale Invariant Feature Transform descriptor).
17
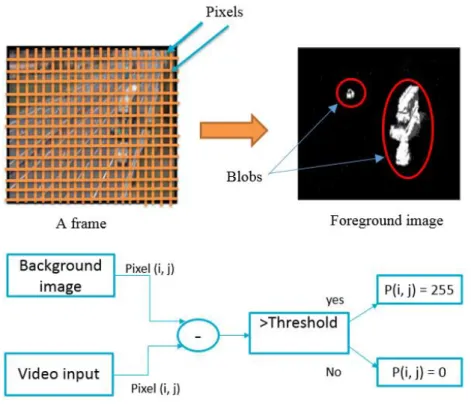
3.1.1. Background subtraction
The objective of the subtraction is to segment the moving objects that are present in the scene. It is used for videos captured by fixed cameras. In order to achieve the motion segmentation, a model of the background scene is necessary. Each image in the video sequence is compared to the background model. The pixels having a significant difference from the model are considered as belonging to moving objects. The output of a BS algorithm is a binary image where the moving objects are presented as a group of white pixels (blobs). The most basic technique for BS is to take an image of the scene with static objects as a background model. The pixels of moving objects are detected by applying a threshold on the absolute difference between the background image and the incoming frame as presented in Figure 5. To update the background image automatically, there is other methods such as the adaptive median approach [McFarlane and Schofield, 1995] which increments or decrement the value of a pixel of the background model depending on the difference between the model and the current image, the temporal median approach [Cucchiara et al., 2001] which computes for each pixel its median value using the last N frames of the video, and the sigma-delta approach based on a simple recursive nonlinear operator with a spatiotemporal regularization algorithm [Manzanera and Richefeu, 2007].
18
Figure 5: A flowchart of a basic background subtraction
The approaches based on a background images are sensitive to the change of luminosity. As a solution, many approaches based on modeling the background using a statistic distribution of a pixel have been developed. In [Wren et al., 1997], each pixel is modeled by a Gaussian probability density defined by the average color of the pixel and a covariance related to that color. The comparison of the current image to the model is carried out with a log likelihood distance or using the Mahalanobis distance [Benezeth et al., 2008]. The average and variance are updated with each new image. For more accuracy, [Stauffer and Grimson, 1999] used a mixture of Gaussian (GMM) instead of a single Gaussian for background modelling. Other techniques based on Gaussian mixture modeling were developed later such as [KaewTraKulPong and Bowden, 2002], [Zivkovic, 2004] and [Zhao et al, 2012] which are based on Fuzzy GMM and Markov Random Field. However, [Barnich and Van Droogenbroeck, 2011] has developed another method for background modeling named ViBe which consists of modeling each pixel by N samples taken from previous images. A pixel of the
19
current image is considered as belonging to the foreground image when the number of samples of the model inside a circle of radius R centered on the pixel, is greater than a defined number.
Other researchers tried to improve the classic BS algorithm by eliminating noise and shadow. For instance, [Lee, 2012] has developed an advanced shadow elimination technique. An example of shadow elimination is shown in Figure 6.
Figure 6: Example of shadow elimination on a traffic scene [Lee, 2012]
3.1.2. The optical flow
The OF is the apparent velocity field observed between two successive frames in a scene. In other words, for each pixel of coordinates(𝑥, 𝑦), the OF estimates its position at the next frame. These computations are based on the constant lighting hypothesis. Under this hypothesis, we assume that image brightness in a small area remains the same. That means that the level of gray of an object at a position (𝑥, 𝑦) of a frame at the instant (𝑡) is the same at a position (𝑥 + 𝑢, 𝑦 + 𝑣)of the next frame at the instant (𝑡 + 1) with a motion following the vector V. This assumption is presented by the equation (1).
20 Where:
- 𝐼(𝑥, 𝑦, 𝑡) is the gray level of the pixel (𝑥, 𝑦)at the instant t;
- 𝑢 and 𝑣 are the motion along the horizontal and the vertical axes respectively; - (𝑥 + 𝑢, 𝑦 + 𝑣) is the coordinates at the instant 𝑡 + 1;
From this hypothesis, the following equation must be satisfied:
𝑑𝐼 𝑑𝑡(𝑥, 𝑦, 𝑡) = 0 (2) ↔ 𝛿𝐼 𝛿𝑥 𝛿𝑥 𝛿𝑡 + 𝛿𝐼 𝛿𝑦 𝛿𝑦 𝛿𝑡 + 𝛿𝐼 𝛿𝑡= 0 (3) ↔ 𝐼. 𝑥. 𝑢 + 𝐼. 𝑦. 𝑣 + 𝐼𝑡 = 0 (4)
However, this assumption, practically, is very often not respected, for example at the borders objects or on reflective surfaces. Consequently, a second constraint is applied. This constraint assumes that neighboring pixels are likely to belong to the same object. This hypothesis supposes a certain rigidity of the objects locally, however, it is not systematically verified.
Existing algorithms differ in the formulation of these constraints in order to correct these discontinuities and other problems of the OF. Different approaches exist to address these problems such as differential methods, correlation methods and regression methods. Equation (4) presents the constraint to be respected for the motion. However, we have only one equation to determine two unknown
u
andv
. In order to determine these two unknowns, all methods to calculate the optical flow carry out one or more additional assumptions in relation to the nature of the field of motion.There is different technique of OF computation, the sparse OF applied on some points of interest such as the Lukas kanade OF [Lukas and Kanade, 1981] and the Horn and Schunck OF [Horn and Schunck, 1981]; and the dense OF applied to all points (pixels) in the frame such as the Farnebäck OF [Farnebäck, 2003]
21
3.1.2.1. Horn and Schunk method
Horn and Schunck [Horn and Schunck, 1981] introduced an overall smoothing constraint, making it possible to estimate the OF throughout the image. They aim to minimize distortions in the OF, they prefer the solutions which present more smoothing. Indeed, the method proposed by Horn and Schunck assumes that the neighboring pixels must have a similar speed of movement, which means that the OF has gradual variation.
3.1.2.2. Lukas Kanade method
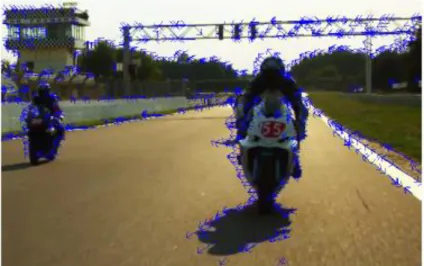
Lucas and Kanade [Lukas and Kanade, 1981] has developed a local method for estimating the OF assuming that the latter is constant in a local neighborhood. The OF equation (4) for all the pixels in the neighborhood are considered. The method proposed by Lucas and Kanade is also known for its robustness to noise. It is usually applied on selected points of interest such as corners. However, this approach may present errors in the processing of uniform regions. Figure 7 shows the result of Lukas kanade OF applied on a traffic scene. The computed velocity vectors are presented as blue arrows.
Figure 7: Velocity vectors of some points of interest in a frame computed by the Lukas
22
3.1.2.3. Farnebäck method
An efficient and robust algorithm for the OF computation was designed by Gunnar Farnebäck [Farnebäck, 2003]. This algorithm is a dense computation of the flow of each pixel. The first step of this algorithm is to approximate each neighborhood of each pixel between two frames by a quadratic polynomial.
𝑓1(𝑥) = 𝑥𝑇𝐴𝑥 + 𝑏𝑇𝑥 + 𝑐
1 (5)
Where A is a symmetric matrix, b is a vector and c is a scalar.
We consider 𝑑 as an ideal translation of the pixel. A new signal 𝑓2(𝑥) is then constructed as follow
𝑓2(𝑥) = 𝑓1(𝑥 − 𝑑) = (𝑥 − 𝑑)𝑇𝐴
1(𝑥 − 𝑑) + 𝑏1𝑇(𝑥 − 𝑑) + 𝑐1 = 𝑥𝑇𝐴
2𝑥 + 𝑏2𝑇𝑥 + 𝑐2 (6)
We obtain the flowing equations:
𝐴2 = 𝐴1 (7)
𝑏2 = 𝑏1− 2𝐴1𝑑 (8)
𝑐2 = 𝑑𝑇𝐴
1𝑑 − 𝑏1𝑇𝑑 + 𝑐1 (9)
If the matrix 𝐴1 is non-singular, then from the equation (8) we get the translation 𝑑 as
follow:
𝑑 =−1
2 𝐴1−1(𝑏2− 𝑏1)
(10) From the value of 𝑑, the velocity of a pixel could be computed.
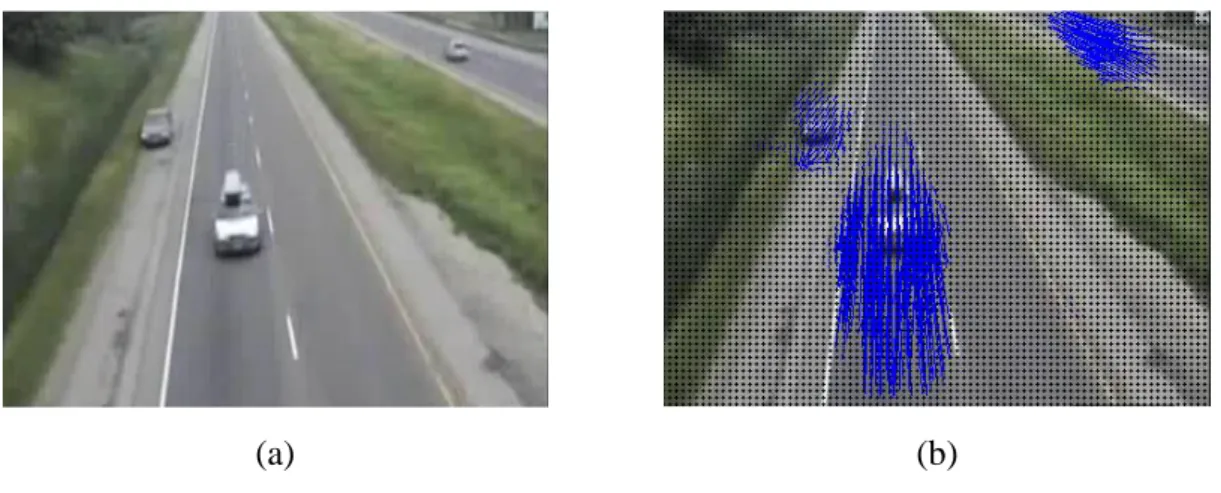
Using the dense OF allows having more information about the motion at a global scale compared to the sparse OF which is related to some point of interest. Figure 8 shows the velocity vectors computed by the Farneback OF in a traffic scene.
23
(a) (b)
Figure 8: The results of Farnebäck OF applied on a traffic scene. (a): the original frame,
(b): the drawing in blue of the velocity vectors computed with the Farnebäck OF.
3.1.3. Scale Invariant Feature Transform
The SIFT is an algorithm widely used in the field of computer vision. Developed by David Lowe in 1999 [Lowe, 1999], it can detect and identify similar objects between different images. So, it allows characterizing the visual content of the image independently of the scale, the brightness and the position of the camera. SIFT is based on 3 steps: first gradient computation for pixels; second the Gaussian computation applied to the values of gradients and finally the histogram computation. Figure 9 shows an example of the use of SIFT descriptor for object recognition as presented in [Morel, 2011]. The descriptor SIFT is used for motion tracking using matching between objects. However after few frames, and due to the video distortion, the number of matches decrease so the number of false alarm increase. Researches, used to combine SIFT descriptor with other tracking technique like kalman in [Mantripragada et al, 2014] and OF in [Chen et al. 2016].
24
Figure 9: An example of matching between two images using SIFT [Morel, 2011].
3.1.4. Vehicle recognition
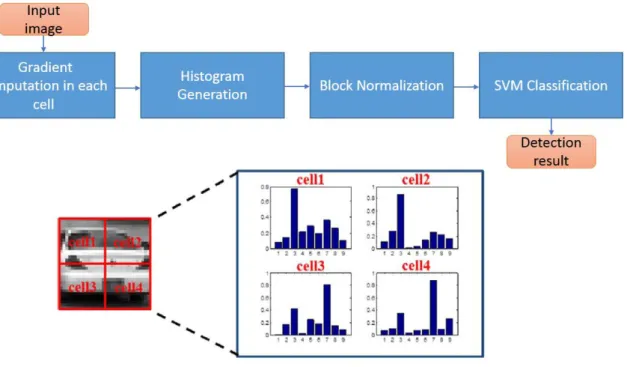
After motion detection, the most challenging task is vehicle recognition. Moving targets can be represented by points or geometric areas like rectangles. However to distinguish vehicles from other objects, there is two categories of approaches: The first ones are the representative approaches based on the colors, the edges, the shape of vehicles or their parts like windshield and lights. The second one are more complex based on training techniques like Haar[Viola and Jones, 2001] or descriptors like the Speeded Up Robust Features (SURF)[Bay et al., 2006] used in[Li and Zhang, 2013] for vehicle detection and the Histogram of Oriented Histogram (HOG) [Dalal and Triggs, 2005]. The Haar-like cascade classifier is a classifier trained with hundreds of samples of the object to detect the called positive samples from other arbitrary objects called negatives samples. After training, a classifier can be applied to a zone of interest to perform the detection. However, in case of HOG, the image is divided into cells which are grouped into overlapping blocks. The gradient is computed for each pixel and the mean orientation of the gradient is associated with each cell. The vector of
25
features is then formed, for each block, to form the histograms of the oriented gradients. This vector, normalized later, characterize the shape of the object. Flowed by a classification technique, the nature of object could be recognized. The most used classifier are the Support Vector Machine (SVM) and AdaBoost[Wu and Weng, 2017] [Chen et al, 2017]. Figure 10 shows the bloc diagram of HOG followed by the SVM classifier.
Some researchers improved the HOG algorithm to enhance the detection rate such as [Kim et al, 2015]who invented the PIHOG which add to the histogram the position information.
Figure 10: The block diagram of HOG followed by the SVM.
3.1.5. Vehicle velocity and orientation computation
The tracking methods consist of estimating the motion of a specific points or a regions of the frame. For an object at the position (𝑥1, 𝑦1)in a frame (i), tracking
26
techniques estimate its next position (𝑥2, 𝑦2) in the frame (i+1). Using this information,
the vehicle velocity vector 𝑢⃗ and the angle of orientation θ could be computed as presented in Figure 11. The acceleration and the vehicle trajectory could be determined. Tracking techniques are important for the applications related to the behavior analysis. The most commonly used techniques are Kalman filtering [kalman, 1990], Bayesian filtering [Haritha and Ramadevi, 2013]and OF.
.
Figure 11: An example of vector velocity computation
3.2. Features extraction
A feature is a characteristic of a given object in motion. It could be velocity, orientation, trajectories, area, position and histograms, etc. Usually combining more than one characteristic gives more details about the motion. Some researchers are interested on extracting features of the vehicles in motion, other researchers preferred
27
extracting features of all particles (pixels) to have dense motion information at a global scale which we assume more accurate.
A comparison between the extracted features and predefined conditions allow the detection of abnormal behavior. Thus, the accuracy of each algorithm of accident detection depends on the quality of the extracted features. To have sufficient results, features must be relevant covering the maximum of the aspect of the motion.
3.3. Accident recognition
In literature, researchers used different approaches to recognize an accident. We classify them in two categories. The first one is based on the comparison of the extracted features to predefined fixed thresholds. The second one is based on the comparison of the extracted features to learned models. These models could be the normal trajectory of a vehicle or a specific representation of its motion such as the histogram of velocities. The models of a normal traffic are obtained from a large dataset of videos of normal traffic situation.
3.3.1. The comparison to predefined fixed thresholds
Ki and Lee [Ki and Lee, 2007] used, for moving object extraction, difference between two frames, binarization, horizontal and vertical projection then, the extraction of pixels that exceed a threshold. In their tracking approach they estimate the area of vehicle in next frames according to the direction of motion. The area of the vehicle is expected to have the same size in the second frame. In the third frame the estimated area can be reduced. To make the process faster, vehicles are estimated in the third frame by using direction and velocity. Next, the algorithm extract features as acceleration, position area and direction of the vehicle and compute the variation rate of vehicle speed (Velocity Feature: VF), the variation rate of position (Position Features: PF), the variation rate of area (Area Feature: SF) and the variation rate of
28
direction (Direction Feature: DF). An accident is detected if these values exceed a threshold. A diagram of the algorithm is presented in Figure 12. [Hui et al. 2014] used the GMM for motion detection then the Mean Shift algorithm for tracking and features extraction (velocity, acceleration and orientation). The accident recognition is also performed by comparison to static predifined thresholds.
Figure 12: Accident detection algorithm flowchart. V, (x , y), s, θ are respectively the
velocity, the coordinate of the centroid of the vehicle, its surface and the angle formed between two motions vectors. a, b, c, d, e, f, g, h, i, j, k are thresholds.
The limitation of the approaches based on static thresholds is that we have to manually fix new thresholds values for each traffic scene. A lot of information are needed for that such as the environment of detection, the camera position and calibration and the resolution of the image.
29
3.3.2. The use of learned models
To avoid the use of fixe threshold, researchers used trajectories analysis. For example in [Lee, 2012], the authors perform road lane analysis based on Calogero-Moser system. Accident is detected when an abruptly change in line is detected. In [Akooz and Karsligil, 2010], detection is performed by extracting moving blobs and removing background noise using smoothing techniques. Next, the position, the velocity, the acceleration and the vehicle trajectory are extracted. Thereafter the Continuous Hidden Markov Model (C-HMM) was used to cluster trajectories and find activities path. A model of normal vehicle behavior is learned so an accident is detected when the system detects an activity that does not match the learned model. The limitation of these approaches is the impossibility of distinguishing an accident from another abnormal behavior. Any abrupt change is reported, which could be a vehicle turning in a wrong direction for example.
The different works sited above are based on vehicle motion analysis which give less information compared to the detection based on particle (pixels) motion analysis. For that reason, some researchers used OF to track pixels and extract more features to detect accident. For instance, [Sadek et al., 2010] proposed a new framework for accident recognition relatively tolerant to changes of lights based on a new algorithm named HFG (Histogram of Flow gradient) which is similar to HOG running on OF algorithm for motion estimation. Figure 13 shows the different steps of HFG algorithm. After video acquisition, the first step is the sparse OF computation. Then, the angle and the magnitude of the flow velocity are represented by an 8 bins histogram of gradient orientation. Each bin represents a range of orientation in the trigonometric circle as presented in Figure 13. The last step is an automatic classification for accident detection. [Ahmadi et al., 2016] exploit the Topic Model technique creating a model of normal traffic motion based on Lukas Kanade OF vectors indexed in a document of words. Each word represents velocities in a specific range of orientation. Abnormal traffic is detected when the computed words are different from the model
30
Figure 13: The block diagram of HFG algorithm. ρ and θ are the magnitude and the
velocity angle respectively.
In these works, the OF is applied on points of interest, so many information in the image was not considered. Besides, OF creates distortion vectors, if not filtered, it can affect the accuracy of the results. As a solution, researchers used dense OF and filtering techniques. In [Ullah et al., 2015], authors used Farnebäck OF for motion detection then applied Thermal Diffusion to find the coherent motion field. They used the Enthalpy Model to filter particles and model the traffic motion. Then they used Smoothed Particle Hydrodynamics (SPH) for accident recognition. In another work, [Ren et al., 2016]proposed to extract moving objects using background subtraction then extract road segments and lines positions. Then a traffic tracking and time and space diagram was generated. SVM was used for classification and accident recognition. Chen et al [Chen et al., 2016]extracted OF and SIFT features. Then they used Bag of Feature (BOF) for features encoding and finally they used Extreme
Video acquisition
Optical flow computation
Classification
Flow gradient The 8 bins distribution in the trigonometric circle
bin Histogram of
31
Learning Machine classifier (ELM) for accident detection. Figure 14 shows the block diagram of their algorithm.
Figure 14: The block diagram of accident detection algorithm based on ELM. The limitation of these approaches is the need to collect a large amount of datasets for more accurate results. However, challenging database of accident videos does not exist so far, since accident simulation is dangerous, and registering videos of real traffic is not allowed by authorities. Created synthetic scenarios or 3D simulation of accident does not take into consideration luminosity or meteoric change and noises.
Researchers used different videos found on websites, created synthetically or given by the authorities in their country [Ki and Lee, 2007].Table 2 shows a comparison study of existent approaches depending on different criteria: the used algorithms, the type of road, the accuracy, the time for detection, the used datasets, and the platform of implementation. For instance, a comparison in term of accuracy and robustness is not possible for many reasons. First, researchers did not use the same datasets for experimental results. In addition, they did not use the same metrics for accuracy computation, for example [Sadek et al., 2010] computed the detection rate and false alarm to evaluate their approach, while [Ullah, 2015] computed the
F1_score. Other information are missing in some works such as the type of road and
32
4. Conclusion
This chapter resumes the common techniques used in computer vision for vehicles recognition and tracking. In addition, an overview of the state of the art of different approach of abnormal behavior detection and accident detection in road was presented. We highlighted the performance of each technique and its limitations. OF based techniques are promising thanks to their robustness. However, the modeling of a traffic flow needs a large dataset of videos which does not exist. In the next chapter we will present new algorithms of accident detection.
33
Ref Motion detection and
tracking Features extracted Accident recognition Region of detection
Dataset Results Time of
detection
Simulation/Implem entation
[Ki and Lee, 2007] BS+ Vehicle area tracking Velocity, acceleration, orientation, area Static threshold Intersections Free ways Videos from cameras installed in Seoul 4 accident detected during the period of test
Real time
?
[Hui, 2014], GMM + Mean Shift Algorithm Velocity, acceleration, orientation Static threshold Highway One video,320×240 pixels, total frame is 347 Accident detected on one video. Real time Windows 7, memory of 2.00G, Visual studio 2010 [Akooz and Karsligil, 2010] BS, KLT Tracker Vehicle trajectory clustered C-HMM Intersections 106 synthetic accident scenes creation 84% detection rate according to accident severity ? ? [Lee, 2012] BS, shadow filtering, vehicle tracking Vehicle lane (trajectory) Calogero-Moser system Highway Stored moving images 100% of detection for 10 cases of study 1-1.5 minutes ? [Sadek et al., 2010]
Lukas kanade Optical flow
HFG Logistic regression
Multiple scenarios 45 Websites videos with 250 accident scene Detection rate : 99.6% False alarme: 5.2% Real time Intel(R) Core(TM)2 Q9550 2.83GHz 4GB of RAM Visual studio 2008, openCV [Ahmadi et al., 2016] Lukas kanade Optical Flow Histogram of words
Topic Model Multiple scenarios Tehran traffic videos
34
Table 2: A comparison study of the different video based approaches for accident detection [Ullah, 2015] Farneback OF,
thermal diffusion, enthalpy Model
Traffic model
SPH Multiple scenarios 20 video sequence of accidents from websites F1score = 0.73 ? ? [Ren et al., 2016] Background subtraction, extracting line positions, tacking
Time and space model diagram
SVM Multiple scenarios 12 lane-hours traffic which includes 6 lane-hours video collected in YanTai 6 lane-hours video collected in Beijing. 640 × 480 resolution at 25 fps Detection rate= 96.87% ? VC++ 2008 in Windows XP and ran on a computer with Intel®
Core(TM) i3-3220 CPU at 3.30 GHz, 4 GB RAM and AMD Radeon HD6700 display adapter [Chen et al,. 2016]
Optical flow and SIFT BOF for feature coding Extreme learning machine
Highway Videos from websites Precision : 83.3%-100% Recall: 100%-50% Accuracy : 82.6%-96.7% ? ?
35
Chapter 2: Constructive approaches for
video-based road accident detection
Contents
1.INTRODUCTION ... 37 2.ACCIDENT DETECTION BASED ON VEHICLE MOTION ... 37
2.1. Vehicle recognition ... 39 2.2. The Kalman filter ... 40 2.3. The Hungarian algorithm ... 41 2.4. Accident recognition ... 41
3.ACCIDENT DETECTION BASED ON PARTICLES MOTION ... 43 3.1. First approach: OF, histogram computation and fixed thresholds ... 43
3.1.1. Method 1 ... 44 3.1.2. Method 2 ... 46 3.1.3. Method 3 ... 47 3.1.4. Accident recognition ... 47
3.2. Second approach: Traffic modeling and dynamic threshold computation ... 49
3.2.1. Velocities classification and noise filtering ... 49 3.2.2. Normal motion flow modeling ... 50 3.2.3. Accident recognition: Adaptive threshold computation and accident detection ... 53 3.2.4. Automatic traffic orientation detection ... 55 3.2.5. Accident localization... 55
36
In this chapter we present our algorithms for video-based accident detection on road segments. The first one is based on vehicles tracking using the Kalman filter. Extracted features are vehicles velocities and orientations. A static threshold was computed for accident recognition. The other algorithms are based on particle tracking using the Farnebäck OF. Extracted features are histograms of pixel velocities and orientations for each frame. Different thresholds are defined. An improvement of this approach is presented as a last algorithm based on traffic modeling and dynamic threshold computation. The conclusion of the accuracy of each approach for accident detection is presented in chapter 3 based on experimental results.
37
1. Introduction
As presented in the previous chapter, there are two categories of approaches for accident detection. The first one is based on vehicle motion analysis and the second one is based on relevant pixel analysis. With the lack of a common dataset, the comparison between these different approaches in terms of accuracy is still a complicated task. With the purpose of validation of the hypothesis proposed in the previous chapter (the detection based on particle motion analysis is more accurate than detection based on vehicle motion analysis), different algorithms for accident detection on a segment of road were developed. Algorithms are in accordance with the state of the art categories. The first approach is based on vehicle tracking using the kalman filter and then a comparison to a static threshold for accident recognition. In the second approach we are focused on the tracking of all pixels in the image using Farnebäck OF. For this approach, first, different methods for features definition were used, and then the static threshold for accident detection was fixed. Finally, we propose a novel approach based on road traffic modelling and dynamic threshold computation. Experimental results will be discussed in the next chapter.
2. Accident detection based on vehicle motion
Usually an accident is characterized by a sudden change in the velocity (increasing speed or sudden stopping) and the orientation of one vehicle or more. To have this information we first need to detect the presence of vehicles, and then track them to save the evolution of their motion in a video sequence. Figure 15 shows the flow chart of the algorithm. First, after testing different BS algorithm, the GMM was chosen for motion detection since it has better accuracy. Vehicles are recognized by the size of
38
their areas. Then, the centroid of each vehicle is computed and tracked between two different frames using Kalman filtering.
Figure 15: The flow chart of the algorithm of accident detection based on vehicle
tracking
A common problem with tracking is to identify the same vehicle from a frame to another. The problem of vehicles assignment is resolved using the Hungarian algorithm. Then velocity and orientation are computed (as explained in the previous chapter) and compared to predefined thresholds. If the velocity and the orientation values exceed the value of the thresholds, an accident is detected.
No Yes Frame(i) GMM Vehicle recognition by area Centroid computation Kalman filtering The Hungarian algorithm
Velocity and orientation computation Thresholds Comparison >? Alarm i = i+1
39
2.1. Vehicle recognition
After applying the GMM algorithm, a binary image representing the foreground image is extracted. From this image, the contours delimiting the white blobs that represent the moving objects are extracted. Each contour is composed of a set of points. These points are known by their coordinates (pixels coordinates). From these values, areas of moving object are computed. Depending on these areas, we conclude the nature of the object and where it is a vehicle or not. In other words, the area of each moving object is computed and compared to a threshold ‘min’ and ‘max’. If the area is bigger than the value of ‘min’ and smaller than the value of ‘max’ we consider the moving object as a vehicle. However if the area is smaller than the value of ‘min’, the detected object is not considered. In the case that the area is bigger than the value of ‘max’ a problem is noted. This problem may be a big shadow, rain, wind or congestion (vehicles are too close to each other). The values of ‘min’ and ‘max’ depends on the camera position and its calibration. Consequently, these values are experimentally defined. Thereafter, the centroid of each vehicle is computed to be tracked later.
The C++ code below Code 1 shows how to detect and compute the centroid of each vehicle. The function findContourswas used to extract the vector of coordinates of each point in the contour of each moving object. ContourArea is used to compute the area of each moving object. Then centroids are computed using the function
40
cv::findContours(image, contours_all,CV_RETR_EXTERNAL,CV_CHAIN_APPROX_NONE); for( int i = 0; i < int (contours_all.size()); i++ )
{ if (cv::contourArea(contours_all[i])> 200) vehicles.push_back(contours_all[i]); } vector<Moments> mu(vehicles.size() ); vector<Point2f> mc(vehicles.size() ); vector<Point2f> mco(vehicles.size()); if (vehicles.size() >= 1) {
for( int i = 0; i < int (vehicles.size()); i++ ) {
mu[i] = moments( contours[i], false );
mc[i] = Point2f(double (mu[i].m10/mu[i].m00) , double (mu[i].m01/mu[i].m00) );
points_for_tracking.push_back(mc[i]); }
}
Code 1 : The C++ code for vehicle detection and its centroid computation.
2.2. The Kalman filter
The Kalman filter [Kalman, 1990] is an optimal estimator of the state of Gaussian systems. It estimates recursively the state of a system whose state transition are known, as well as the uncertainty associated with it. It receives input in the form of a series of observed measurements as well as the noises of the state evolution. The strength of the Kalman filter is that, beside the computation of a vector of estimated metric of a given system, it computes a covariance matrix of estimated errors. The Kalman filter is the
![Figure 3: Examples of vehicle abnormal trajectory [Moris and Trivedi, 2008]](https://thumb-eu.123doks.com/thumbv2/123doknet/14537934.724335/27.892.149.750.308.532/figure-examples-vehicle-abnormal-trajectory-moris-trivedi.webp)
![Figure 6: Example of shadow elimination on a traffic scene [Lee, 2012]](https://thumb-eu.123doks.com/thumbv2/123doknet/14537934.724335/31.892.159.751.377.567/figure-example-shadow-elimination-traffic-scene-lee.webp)
![Figure 9: An example of matching between two images using SIFT [Morel, 2011] .](https://thumb-eu.123doks.com/thumbv2/123doknet/14537934.724335/36.892.235.694.140.445/figure-example-matching-images-using-sift-morel.webp)