HAL Id: tel-01832194
https://tel.archives-ouvertes.fr/tel-01832194
Submitted on 6 Jul 2018
HAL is a multi-disciplinary open access archive for the deposit and dissemination of sci-entific research documents, whether they are pub-lished or not. The documents may come from
L’archive ouverte pluridisciplinaire HAL, est destinée au dépôt et à la diffusion de documents scientifiques de niveau recherche, publiés ou non, émanant des établissements d’enseignement et de
Some aspects of the robustness of climate change
mitigation policies
Julie Rozenberg
To cite this version:
Julie Rozenberg. Some aspects of the robustness of climate change mitigation policies. Economics and Finance. EHESS - Paris, 2014. English. �tel-01832194�
Eléments sur la robustesse des
politiques climatiques
Some aspects of the robustness of climate change
mitigation policies
Thèse présentée par
Julie Rozenberg
pour obtenir le grade de Docteur
de l’Ecole des Hautes Etudes en Sciences Sociales
Discipline : Economie
Soutenue le 18 Juin 2014 devant un jury composé de
Valentina Bosetti: rapporteur
Professeur d’économie à l’Université Bocconi, Milan
Lionel Ragot: rapporteur
Professeur d’économie à l’université Paris Ouest Nanterre La Défense
Marianne Fay: examinateur
Economiste en chef du groupe Changement climatique, Banque Mondiale
Jan Corfee-Morlot: examinateur
Directrice du programme climat, environnement et développment à l’OCDE
Keywan Riahi: examinateur
Directeur de recherche à l’IIASA
Jean-Charles Hourcade: directeur de thèse
© 2014 - Julie Rozenberg Some Rights Reserved.
This work is licensed under a Creative Commons Attribution License-ShareAlike 3.0 Unported (CC BY-SA 3.0)
Remerciements
Cette thèse est une compilation de collaborations scientifiques. Les travaux qu’elle contient doivent beaucoup au travail et aux conseils avisés de Stéphane et Céline et à la contribution régulière d’Adrien à mes réflexions et tribulations informatiques. Je les en remercie chaleureusement.La première partie de la thèse fut initiée sous la direction d’Olivier, et s’appuie sur le modèle IMACLIM-R, dont l’entretien et l’amélioration permanents sont as-surés par une équipe intrépide. Je remercie Oliver et Renaud d’avoir donné « vie » à la bête, Christophe pour la coordination de l’équipe, Henri, Ruben et tous les autres d’avoir partagé mon incrédulité et ma satisfaction devant le code et les résul-tats du modèle. Je remercie Meriem de m’avoir accompagnée aux premières confé-rences où j’ai présenté ces travaux et d’avoir égayé ma vie au labo pendant toutes ces années. Je remercie également Franck N. pour ses conseils étendus et enthou-siastes sur les analyses économétriques des sorties d’IMACLIM.
La deuxième partie de la thèse prit forme suite à de longues discussions avec Baptiste sur la réforme du système monétaire international et le ski de rando. Je le remercie de m’avoir accompagnée sur cette voie de recherche sinueuse avec autant d’ardeur, jusqu’à ce que nos chemins se séparent quand il s’est consacré aux DSGE pendant que je planchais sur Ramsey.
Je remercie Jean-Charles pour sa super vision, ses inspirations qui m’ont amenée à vouloir réformer la finance internationale, et sa mémoire photographique des premiers rapports du GIEC. Je remercie les rapporteurs de ma thèse ainsi que les autres membres du jury pour l’intérêt qu’ils ont bien voulu porter à mes travaux et leur présence à ma soutenance. Je remercie aussi Franck L. pour ses conseils sur la thèse et les perspectives de carrière.
Les souvenirs joyeux que je garderai de mes années passées au CIRED doivent tout à son peuple, qui contribue en plus de la forêt à l’ambiance inégalable du labo. Je pense bien sûr à mes merveilleux co-bureaux, Philippe Q. qui a partagé avec moi des conseils de sage et des soirées arrosées (et auprès duquel je m’excuse de n’avoir jamais terminé le papier sur la CCS), Aurélie qui elle a partagé mes désar-rois imaclimesques et mes road trips en Afrique du Sud, et Manon dont je regrette déjà les édifices en papier-à-bulles-et-trombones et la bonne humeur. Je remer-cie également Valentin, Patrice, Tarik, Antonin, Gaëtan, Yaël, Vincent, Raphaël,
Béatrice, Thierry, Marie-Laure, Elsa, Manu, Julien, Cédric, Paolo, Oskar, Ankur, Miriame, William, Gaëlle, Florient, Laurent, Jules, Philippe R., Antoine et tous les autres pour les discussions passionnantes ou déconcertantes du déjeuner, du cou-loir et de la salle café.
Mes pensées vont ensuite à ma famille, Valérian, Claire, Hamed, Priscilla, Julie, Nico, Guillaume, Etienne, Laure, Mathieu, Jamie, Alice, Tamara, Vanessa, Jonathan et Ismaïl, qui m’ont soutenue discrètement par leur présence, leurs questions et leur humour au cours de ces dernières années. Les treks sans eau ni semelles feront sans aucun doute partie de mes souvenirs les plus marquants de cette époque. Je dois enfin plus que des remerciements à Adrien, qui m’a accompagnée hors du labo et a su répondre avec esprit à mes excès d’humeur ou questionnements existentiels pendant la dernière année de cette thèse.
Il est de circonstance, pour clore cette section, de remercier le peuple européen pour le financement des travaux de la thèse et l’INRA d’Orléans pour l’impression de ce manuscrit.
Acknowledgements
I’d like to thank once again the jury members for reading and commenting my the-sis. Many thanks also to Rob for teaching me about RDM and accepting to by my co-author, and to Brian and Vanessa for inviting me to spend three great months in Boulder.
Directeur de thèse: Jean-Charles Hourcade Julie Rozenberg
Eléments sur la robustesse des politiques climatiques
RésuméCette thèse s’attache à améliorer la robustesse des techniques d’évaluation des po-litiques d’atténuation du changement climatique, ainsi que la robustesse des instru-ments implémentés. En explorant des centaines de scénarios qui capturent l’incertitude sur les évolutions technologiques, sociologiques et démographiques futures, ainsi que sur la disponibilité des ressources fossiles et l’implémentation des politiques d’atténuation, elle révèle les déterminants des émissions futures et des couts de l’atténuation. Cette méthodologie permet de filtrer les informations pertinentes pour la décision et de concentrer le débat sur les questions et politiques centrales pour le succès des politiques de réduction d’émissions de gaz à effet de serre. La thèse propose également de focaliser le débat sur des instruments robustes aux contraintes politiques car ayant peu d’impacts négatifs à court-terme. Des poli-tiques permettant de rediriger les investissements vers du capital bas-carbone – par exemple les normes d’efficacité énergétique ou des instruments financiers – nous rapprochent des objectifs d’émissions de long-terme sans affecter les propriétaires du capital polluant déjà installé.
Thesis advisor: Jean-Charles Hourcade Julie Rozenberg
Some aspects of the robustness of climate change
mitigation policies
Abstract
This thesis looks for robustness in climate change mitigation policies assess-ment and impleassess-mentation. Exploring the uncertainties surrounding future tech-nologies, fossil fuel resources, policy instruments, consumption preferences, pop-ulation and economic growth with an Integrated Assessment model, it disentan-gles the future drivers of future carbon emissions and of mitigation costs. Such methodologies improve the understanding of models, filter out the issues that do not really matter, help policymakers focus on critical factors and develop consen-sus about where the focus should be. The thesis also proposes to focus on instru-ments that are robust to political constraints thanks to their lower short-term im-pacts. Such instruments include performance standards or financial instruments that redirect the bulk of investments towards clean capital without affecting the owners of existing polluting capital.
Contents
Introduction 1
1 The Shared Socio-Economic Pathways in perspective 11
2 A scenario elicitation methodology to map the space of pos-sible future challenges to mitigation and adaptation 29
2.1 A new generation of scenarios . . . 29
2.2 The ex-ante drivers of challenges to adaptation and mitigation . . 33
2.3 How to build scenarios . . . 35
2.4 How to select relevant scenarios . . . 38
2.5 Conclusion and further challenges . . . 55
3 The determinants of future CO2 emissions 61 3.1 Historical trends and overview of the database . . . 65
3.2 Analysis . . . 72
3.3 Structural Decomposition Analysis (SDA) . . . 78
3.4 Conclusion . . . 81
4 Climate policies as a hedge against the uncertainty on fu-ture oil supply 87 5 The cost of climate change mitigation: uncertainties and metrics matter 97 5.1 Introduction . . . 97
5.3 Results . . . 103
5.4 Conclusion . . . 111
6 Irreversible investment and transition to clean capital 119 6.1 Model . . . 123
6.2 Laissez-faire equilibrium . . . 125
6.3 Discounted welfare maximization: carbon price . . . 126
6.4 Investment-based instruments . . . 133
6.5 Timing of action and carbon-intensive lock-in . . . 137
6.6 Discussion . . . 140
7 Funding low-carbon investments in the absence of a carbon tax 147 7.1 Introduction . . . 147
7.2 Carbon certificates as a tool to finance low-carbon projects . . . 151
7.3 Conclusion . . . 157
Conclusion 161 A The imaclim-r model and the dialogue between economists and engineers 165 A.1 General description . . . 165
A.2 Dynamic equations that will be used to build scenarios . . . 168
B Building scenario databases for chapters 2 to 4 185 B.1 Scenarios: neither “best guess” nor arbitrary “storylines” . . . . 185
B.2 Selecting relevant drivers for future challenges to adaptation and mitigation for chapter 2 and building the database . . . 187
B.3 Chapter 3 and 5 differences with chapter 2 . . . 196
B.4 Parameters choices for chapter 4 . . . 198
C Exploring GDP trends for the SSPs with the Imaclim-R model 207 C.1 Parameter choices for the five SSPs . . . 207
C.3 Further simulations, variations for SSP3 and SSP5: cheaper coal
and increasing convergence for low income countries . . . 215
D Appendix for chapter 5 221 D.1 Uncertainties and integrated assessment and economy-energy-environment models . . . 221
D.2 Mitigation costs metrics . . . 222
D.3 CART results . . . 224
D.4 Additional graphs . . . 224
E Irreversible investment and transition to clean capital: proofs229 E.1 Maximization of the household’s utility . . . 229
E.2 Social optimum (section 6.3) . . . 230
E.3 Decentralized equilibrium with a tax on emissions . . . 232
E.4 Firms’ maximization problem with differentiation of investment costs . . . 234
E.5 Maximization of social welfare with full utilization constraint: tem-porary subsidy on existing polluting capital . . . 236
E.6 Investment regulation (performance standards) . . . 237
Author List
Chapter 2: Rozenberg, J., C. Guivarch, R. Lempert, and S. Hallegatte (2013). Build-ing SSPs for climate policy analysis: a scenario elicitation methodology to map the space of possible future challenges to mitigation and adaptation. Climatic Change. Design of the study: 50%, Analysis: 100%, Writing: 50%
Chapter 4: Rozenberg, J., S. Hallegatte, A. Vogt-Schilb, O. Sassi, C. Guivarch, H. Waisman, and J.-C. Hourcade (2010). Climate policies as a hedge against the uncertainty on future oil supply. Climatic Change 101(3), 663-668.
Design of the study: 50%, Analysis: 90%, Writing: 60%
Chapter 5: Working paper with C. Guivarch
Design of the study: 50%, Analysis: 80%, Writing: 60%
Chapter 6: Rozenberg, J., A. Vogt-Schilb and S. Hallegatte (2014). Transition to clean capital, irreversible investment and stranded assets. World Bank Policy
Re-search Paper no. WPS 6859.
Design of the study: 50%, Analysis: 90%, Writing: 80%
Chapter 7: Rozenberg, J., S. Hallegatte, B. Perrissin-Fabert, and J.-C. Hourcade (2013). Funding low-carbon investments in the absence of a carbon tax. Climate
Policy 13(1), 134-141.
List of Figures
1.1 The SRES space. . . 13 1.2 The challenges space. . . 16 1.3 Windows of opportunity . . . 22 2.1 Identified drivers of the challenges to mitigation and adaptation,
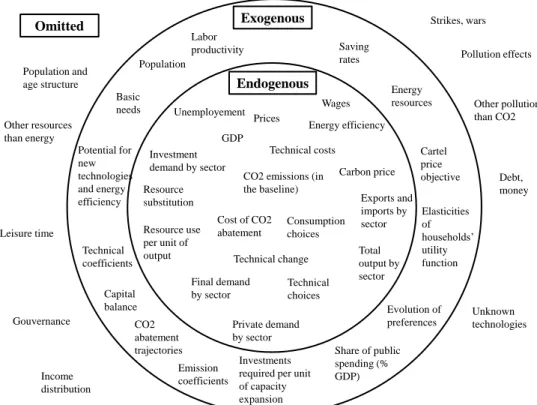
in the four main dimensions. . . 34 2.2 Endogenous, exogenous and omitted drivers in the IMACLIM-R
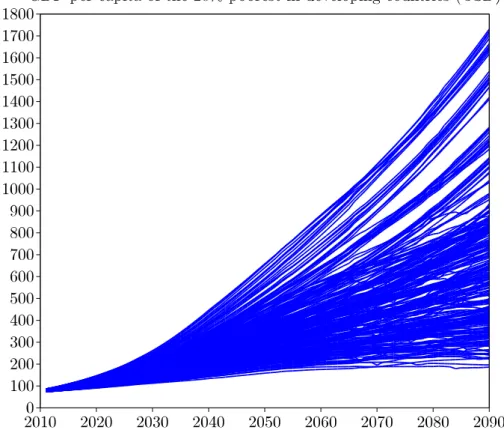
model. . . 35 2.3 GDP per capita of the 20% poorest in a selection of developing
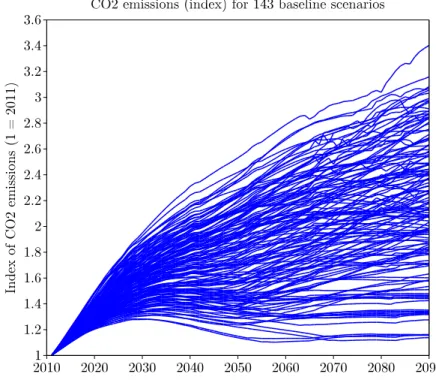
countries in 286 scenarios resulting from 143 model runs with IMACLIM-R and two hypotheses on the share of income of the 20% poorest. . . 39 2.4 CO2 emissions resulting from 143 model runs with the
IMACLIM-R model. . . 40 2.5 Capacities to adapt and to mitigate that define the five SSP spaces
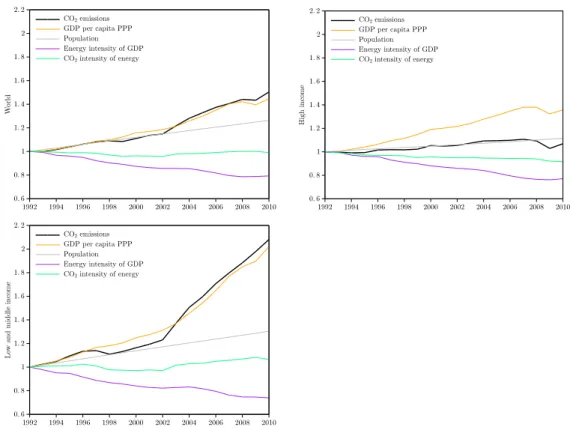
and the results of our 286 model runs arrayed in this space. . . . 42 2.6 Different thresholds . . . 49 2.7 Different indicators . . . 53 3.1 Hitorical Kaya components indexes (1=1992). Source: World
Bank data. . . 67 3.2 Exogenous drivers and endogenous factors determining CO2
emis-sions within the imaclim-r framework. . . 68 3.3 Box plot for Kaya components. . . 69
3.4 CO2 emissions for the scenario database . . . 71
3.5 Influence of drivers on Kaya elements. . . 77
3.6 Box plot for the SDA decomposition. . . 80
3.7 ANOVA results for SDA factors. . . 82
4.1 Histogram of GWP losses . . . 92
5.1 Macroeconomic cost of climate policy and carbon tax in all sce-narios . . . 106
5.2 Macroeconomic cost of mitigation and global GDP per capita in climate policy scenarios . . . 110
6.1 Polluting and clean installed capital, and utilized polluting capital in the first-best optimum . . . 130
6.2 Under-utilization of polluting capital as a function of initial emis-sions and the ceiling . . . 132
6.3 Shadow carbon price in the two simulations . . . 135
6.4 Output and consumption in the two simulations . . . 136
6.5 GHG emissions in the two cases . . . 138
6.6 Under-utilization of polluting capital and feasibility of the ceiling with investment-based instruments as a function of initial emissions 138 7.1 An investor receiving carbon certificates can exchange them for a concessional loan. Banks can use the certificates as legal reserve assets. . . 153
A.1 Maximum market share for new technologies penetration, with the different phases . . . 175
A.2 Biodiesels supply curves in Mtoe. Each curve corresponds to a given price per barrel of Gasoline equivalent (including taxes). . 177
A.3 Investors’ beliefs on profitability of CTL investments (f(t)) . . . 179
C.1 GDP per capita for the world and five main world regions in the five SSPs. . . 211
C.2 Global CO2 emissions from energy consumption, compared to
the RCPs. . . 212
C.3 On top: potential GDP per capita in each SSP, calculated from exogenous population growth rates and labor productivity growth rates. Below: ratio between effective (endogenous) GDP per capita in each SSP and potential GDP. . . 214
C.4 Coal price in SSP3 and in variation with low elasticity of coal price. 215 C.5 World GDP per capita for different assumptions for SSP3. . . 216
C.6 World CO2 emissions for different assumptions for SSP3. . . 216
C.7 Coal price in SSP5 and in variation with low elasticity of coal price. 217 C.8 World GDP per capita for different assumptions for SSP5. . . 217
C.9 World CO2 emissions for different assumptions for SSP5. . . 218
D.1 Uncertainties along the causal chain from emissions determinants to climate change damages. In blue boxes: the elements of the causal chain. In orange ovals: main uncertainties. Green lines: targets at different positions in the causal chain. (Note: very sim-plified figure of the complex system; in particular it does not rep-resent interactions and feedbacks between elements) . . . 222
D.2 CART results for macroeconomic cost. . . 225
D.3 CART results for GDP per capita. . . 225
D.4 CART results for the carbon tax. . . 225
D.5 ANOVA results for the macroeconomic cost. . . 226
D.6 ANOVA results for the carbon tax. . . 226
List of Tables
2.1 Combinations of future challenges to adaptation and mitigation in our five SSP spaces . . . 45 2.2 Different thresholds . . . 50 2.3 Different indicators . . . 52 3.1 Correlation coefficient between the average annual growth rates
of the different Kaya factors. . . 72 3.2 ANOVA for CO2 emissions mean growth . . . 74 3.3 ANOVAs for Kaya factors. . . 75 3.4 Correlation coefficients between the SDA factors. . . 80 4.1 Variations in the 3%-discounted GWP . . . 93 A.1 Regional and sectoral disaggregation of the imaclim-r model . . 166 B.1 Parameters options for energy efficiency . . . 191 B.2 Parameters options for behaviors . . . 194 B.3 Parameters options for low carbon technologies . . . 195 B.4 Parameters options for fossil fuels . . . 196 B.5 Parameters options for leader growth and high income
popula-tion growth. Data for populapopula-tion is available at https://secure.iiasa.ac.at/web-apps/ene/SspDb . . . 197 B.6 Parameters options for low income catch-up speed and
popula-tion growth. Data for populapopula-tion is available at https://secure.iiasa.ac.at/web-apps/ene/SspDb . . . 197
B.7 Parameters options for energy efficiency . . . 198 B.8 Parameters options for coal and CTL . . . 198 C.1 Convergence speed assumption depending on the income group
and the SSP. . . 208 C.2 Other socio-economic assumptions for the SSP. . . 209
Introduction
This thesis contributes to the analysis of the uncertainty surrounding the evalu-ation and implementevalu-ation of climate change mitigevalu-ation policies. In the scientific community, this uncertainty – around the future drivers of climate change impacts or mitigation costs – has raised criticism about the use of Integrated Assessment Models for finding what policy to implement. Some accusers argue that the mod-els are too obscure when they incorporate many complex mechanisms (Henriet et al., 2014) or others that they are too simple when they reduce those mechanisms to cost curves (Pindyck, 2013).
It can be argued that in the field of climate change, the complexity of mod-els is inevitable since a variety of stakeholders need to understand by which lever they will be affected by policies. One can then imagine at least two directions for improving the use of models as supports for policy decisions: (i) changing the methodology and exploiting computational capacity to improve the understand-ing of models, filter out the issues that do not really matter, help policymakers fo-cus on critical factors and develop consensus about where the fofo-cus should be; (ii) coming back to compact models for in-depth analysis and theoretical grounding of the central mechanisms.
The thesis argues that in context of deep uncertainties, finding the optimal in-strument is illusory but other approaches can inform robust decision-making frame-works for climate mitigation. Mitigation policies can for instance be evaluated in a robust way against hundreds of different baseline scenarios, in which we have a precise understanding of emissions drivers. Large databases help finding the trade-offs between different metrics of mitigation costs and the drivers of each metric. They also allow concentrating on the determinants of GDP in policy scenarios
in-stead of the relative cost with regards to a highly uncertain counter-factual baseline. Also, an analysis of the co-benefits of climate mitigation, e.g. in terms of protec-tion against oil scarcity, can be very valuable to many decision makers, in particular when there are trade-offs between the cost metrics. Eventually, the thesis analyzes instruments that mitigate the inter- and intra-generational distributional impacts of climate policies.
Baselines are key in assessing climate mitigation costs
The usual approach to assess climate mitigation costs requires defining a “baseline” scenario that gives the emissions of greenhouse gases (GHG) in the absence of a climate policy. This baseline is then compared to a climate-stabilization scenario in order to evaluate the impacts of mitigation instruments on various indicators (e.g. GDP, welfare, investment) — everything else being equal. The definition of the baseline therefore determines both the potential for future GHG emissions reduction and the costs of meeting a given climate stabilization target.The baseline includes assumptions on future consumption preferences, techni-cal change, fossil fuel resources, and economic policies at the macroeconomic and sectoral levels. These assumptions shape future development pathways, notably growth rates, structural change and resource intensity. For developing countries, an economy following development policies that emphasize greater investments in infrastructure, such as rail transport or energy efficiency improvements, is likely to follow a low GHG emission trajectory. Conversely, an economy with substantial coal resources and scarce capital can be pushed towards a development path with high emissions.
These assumptions are compromised by pervasive uncertainties that make the conception of one baseline irrelevant. Two main types of uncertainty can be dis-tinguished when using the models that assess climate mitigation costs: conceptual uncertainty and parametrical uncertainty (Oreskes and Belitz, 2001). Concep-tual uncertainty arises from the different mechanisms represented in models (e.g. partial vs general equilibrium effects), and the equations used to do so. Some of the dynamic linkages between technical choices and consumption patterns and, in turn, how these interact with economic signals and policies are indeed poorly
un-derstood (IPCC, 2001, chapter on costing methodologies). On the other hand, parametrical uncertainty comes from the wide range of possible values for input parameters of the equations. These include inter alia uncertainties on the costs and future availability of low-carbon technologies, unconventional fossil fuels re-sources, growth and wealth distribution, consumption patterns and social changes. These considerations call for several alternative baseline scenarios characterized by different assumptions regarding development patterns and innovation. Mitiga-tion (or adaptaMitiga-tion) costs assessments across these different baselines would thus give estimate ranges rather than a single number and would help understand better the impact of different uncertainties on emissions and cost measures.
Building contrasted baseline scenarios for climate change policies is a difficult endeavor. It requires both a qualitative vision of possible futures and a quanti-tative translation of their corresponding trajectories. In the usual approach, that was used for instance for the SRES scenarios (?) the qualitative exploration pre-cedes the quantitative translation. More precisely, the first step necessitates iden-tifying ex-ante the key drivers of future emissions, selecting a few contrasted set of assumptions, and building comprehensive storylines out of these sets of assump-tions. These storylines must be — as far as possible — internally consistent and be representative of the scope of possible scenarios. The storylines are then translated into model inputs, leading eventually to quantitative scenarios.
The first part of the thesis starts with a chapter on this process, illustrated by the Shared Socio-Economic Pathways, the new IPCC socio-economic scenarios built for climate change research. In order to integrate the research communities work-ing on adaptation and mitigation, the SSPs must be contrasted along two axes: challenges to mitigation, and challenges to adaptation. Defining appropriate indi-cators for these challenges and selecting both contrasted and internally-consistent scenarios is a difficult task. This first chapter points the methodological issues met when using the usual approach and proposes different methodologies.
Now that calculation capacity has significantly improved, the scenario construc-tion process may indeed be reversed. Both the complexity of the issues decision-makers and scientists are dealing with and the uncertainty surrounding for instance future economic, technological or climatic conditions could be better compre-hended. The existence of many links and feedbacks between the drivers that need
being considered may lead to counter-intuitive trajectories: even though input drivers are chosen to be representative of the uncertainty, the scenarios created as output of the models may not be representative of the scope of possible futures. This thesis proposes new methodologies to improve the assessment of future climate and energy policies. It demonstrates that the calculation power now avail-able for socio-economic scientists can help reveal new insights on complex prob-lems if a large number of scenarios is systematically considered before evaluating policies.
Instead of selecting ex-ante a few sets of hypotheses, models can be run hun-dreds or thousands of times to explore a scenario ensemble as large as possible. Choices can then be made in the output space (that of scenarios) instead of the input space (that of the input hypotheses). Such alternative methodologies help better apprehending the deep uncertainty surrounding future economic forces rel-evant for the study of climate change adaptation and mitigation and help assess policy costs in a more robust way. Understanding and ranking uncertainties in-deed allows finding the important levers for policy action and reducing some of these uncertainties.
In this thesis, scenario databases will be built with only one model, for practical reasons. First, we had only the IMACLIM-R model at our disposal. Second, an-alyzing the underlying drivers of scenarios generated with a single model is much easier than doing so for the outputs of many models.¹
Chapter 2 proposes a methodology to develop Shared Socio-Economic Path-ways (SSPs) with a “backwards” approach, based on (i) an a priori identification of potential drivers of mitigation and adaptation challenges; (ii) a modeling ex-ercise to transform these drivers into a large set of scenarios; (iii) an a posteri-ori selection of a few SSPs among these scenarios using statistical cluster-finding algorithms. This backwards approach helps inform the development of SSPs to ensure the storylines focus on the driving forces most relevant to distinguishing between the SSPs. This illustrative analysis shows that, in our database, consump-tion behaviors, equity concerns and convergence of developing countries prove
¹Key challenges arise from using a variety of models with differences in model focus, struc-ture and assumptions. However, a promising direction for fustruc-ture research is to find ways to sys-tematically analyze the large scenario databases that have been produced for the IPCC fifth as-sessment report.
most important towards explaining future difference in challenges to adaptation and mitigation.
Chapter 3 identifies the main drivers of future CO2 emissions using a scenario database built with the IMACLIM-R model. Starting with an analysis of the Kaya components across the database, we find that the main driver of future emissions is GDP per capita, offset by improvements in energy efficiency. The carbon con-tent of energy, conversely, barely changes between 2010 and 2050, and this is true in all scenarios. We also find that GDP per capita and energy efficiency are anti-correlated, such that they cancel each other’s effects on emissions and reduce the overall uncertainty on future emissions. We then look for the drivers of emissions among the exogenous parameters of the model and find that assumptions on the availability of coal and unconventional oil mainly determines future CO2 emis-sions. The influence of this parameter is however not channeled through increased carbon intensity of energy, or through increased GDP per capita (GDP per capita depends on assumptions on behaviors and energy efficiency potentials). To go further, the chapter is completed by a Structural Decomposition Analysis (SDA) to disentangle structural change from increases in activity. Correlations between factors are lower with such decomposition, and we show that the activity effect (in-crease in production per capita) is the main determinant of future emissions and it is mainly driven by the availability of coal and unconventional fuels. This effect is offset by structural and energy intensity effects, which are caused by energy effi-ciency and behaviors hypotheses. SDA therefore proves very useful for explaining future emissions as it decorrelates the factors and explains why future fossil fuels availability is the main driver of emissions in this particular database.
Mitigation costs metrics and co-benefits
The previous chapter found that baseline emissions strongly depend on assump-tions on the future availability of coal and unconventional fuels. Chapter 4 and 5 find that depending on the metrics considered, these parameters also play an im-portant role in mitigation costs through their impact on the baseline.
Chapter 4 addresses the co-benefits of climate policies by assessing in a com-mon framework both the costs of climate policies and oil scarcity, taking into
ac-count macroeconomic feedbacks. It shows that both costs are of the same order of magnitude, and that mitigation costs are lower when oil is scarce in the base-line (this result is consistent with the previous chapter). Moreover, a robust result across the database suggests that, in the context of a limited and uncertain amount of ultimately recoverable oil resources, climate policies reduce the world vulnera-bility to peak oil. Climate policies, therefore, can be considered as a hedge against the potential negative impact of oil scarcity on the world economy. This hedge parallels the climate-related hedge of early climate policies, and may appear as a significant side-benefit of climate policies to many decision-makers.
Chapter 5 takes a step back and shows that when assessing mitigation costs, one stumbles over the irreducible socio-economic uncertainties at play, but also on the several cost metrics that co-exist and are conceptually different (e.g. carbon price and macroeconomic cost of the policy). Using a scenario database and analyz-ing scenarios with statistical methods, it finds that the two issues are linked. Our results first highlight the quantitative importance of findings from the theoretical literature: the political choices behind the implementation of mitigation policies, namely here the use of carbon pricing revenues, have a major influence for the costs of the policy. A substitution of the carbon tax for pre-existing distortive taxes also entails a trade-off: it reduces macroeconomic costs and its range of possible values, but it increases the carbon price and its range of possible values. Moreover, our re-sults give new insights. The macroeconomic cost of a mitigation policy strongly depends on baseline assumptions on the availability of fossil fuels, while these pa-rameters have no impact in the stabilization scenario (this is analyzed in depth in chapter 4). The macroeconomic cost is thus not a good proxy for absolute GDP per capita reached in mitigation scenarios. The latter is strongly determined by as-sumptions on energy efficiency and behaviors, two drivers that do not influence significantly the macroeconomic cost. Framing therefore matters when assessing mitigation costs and their determinants. The importance of behaviors and energy efficiency for the cost-efficiency of mitigation policies is a remarkable result, given that most mitigation studies focus on technologies and policy design, and disre-gard the uncertainty surrounding future consumption behaviors. This chapter calls for caution in costs results interpretation, presentation and communication and emphasize the need to pursue efforts to develop and apply methods that quantify
the effects of socio-economic uncertainties for climate policy decisions. Chapter 5 also suggests that baselines are misleading in the assessment of mitigation costs. These assessments could instead concentrate on finding the parameters and policy levers that maximize welfare under a climate constraint.
These last two chapters illustrate the fact that the sub-optimality of the baseline growth path (in the absence of the climate externality) is also crucial in assessing mitigation costs. The presence of rigidities or market imperfections — such as unemployment or imperfect foresight — in the baseline may increase mitigation costs but allows highlighting some co-benefits of climate mitigation policies. For instance, in the presence of a complex fiscal system the implementation of a car-bon tax recycled through a decrease of distortionary taxes (e.g. labor taxes) can generate a double dividend (Chapter 5). Also, mitigation policies can reduce the adverse impacts of oil scarcity on economic growth if in the baseline agents do not anticipate oil depletion (Chapter 4).
Such considerations are very important for the implementation of mitigation policies, given the uncertainty surrounding mitigation costs. In particular, when there are trade-offs between the different metrics of mitigation costs, evaluating the potential co-benefits of a climate mitigation policy may strengthen the case for action and help reach a consensus.
The rest of the thesis focuses on a different issue, namely the intra and inter-generational impacts of mitigation instruments. It argues that the short-term im-pacts of a climate mitigation policy may hamper its political implementation and call for alternative instruments able to tackle both the equity and efficiency aspects of a policy.
The intra and inter-generational impacts of mitigation
in-struments
Short-term impacts of mitigation instruments is another central point for perform-ing a sound assessment of mitigation options and for providperform-ing policy-relevant in-formation to decision-makers. Most cost assessments rely either on a cost-benefit analysis that compares the economic costs of a mitigation policy to its benefits in terms of avoided climate change damages, or on a cost-efficiency approach that
looks for the least-intertemporal-cost option allowing to reach a given climate tar-get.
According to these criteria, the carbon tax is the best instrument to maximize intertemporal welfare in a climate-stabilization scenario. But public policy is espe-cially difficult in contexts where costs are immediate, concentrated and visible; and benefits are spread over time and over citizens (Olson, 1971). There will necessar-ily be losers in an intertemporal-efficient transition to a clean economy. Among them, the owners of the most carbon-intensive long-lived capital will see their as-sets instantaneously loose value and become “stranded asas-sets.” Since the owners of polluting capital – and the workers whose job depend on this capital – were playing by the rules when they made their investment, before any carbon pricing had been decided, they may become strong opponents to a carbon tax. If this equity issue is not tackled, it is very unlikely that a carbon tax can become politically-acceptable and thus be implemented.
In order to provide policy-relevant information, mitigation instruments could therefore be assessed with both efficiency criteria (they reduce emissions) and eq-uity criteria (they compensate losers). Instead of using a uniform carbon tax as a benchmark against which other instruments should be evaluated, one could use a carbon tax completed by measures that compensate the losers. The thesis thus looks for robustness in the design of mitigation instruments by looking at their inter- and intra-generational distributional impacts.
Chapter 6 investigates how the transition to clean capital is modified when us-ing investment-based instruments such as performance standards or feebate pro-grams instead of a carbon price. It uses a Ramsey model with two kinds of capital and irreversible investment, and focuses on the short-term asset price variations caused by different instruments and on the repartition of abatement efforts over time. The cost of climate mitigation decomposes as a technical cost of using clean instead of polluting capital and a transition cost due to the irreversibility of pre-existing polluting capital. With a carbon price, the transition cost can be limited by under-utilizing polluting capital, at the expense of a loss in polluting assets value (i.e. stranded assets) and a drop in income. By removing this option, instruments that focus on redirecting investments increase the intertemporal cost of the tran-sition but reduce short-term losses and increase the short-term value of polluting
assets. These results highlight a trade-off between the optimality of a climate mit-igation policy and its short-term impacts, which may influence political accept-ability. When comparing the instruments in terms of welfare maximization, the carbon tax alone is always the best policy. When looking at criteria such as short-term impacts, however, investment-based instruments may appear preferable to some decision-makers and voters. In particular, the impact on asset prices would primarily affect the owners of polluting capital and the workers who depend on them, transforming them into strong opponents to the mitigation policy.
Chapter 7 then proposes instruments that can help redirect investments towards low-carbon capital in the absence of a carbon price. It argues that such redirecting can be done with “carbon certificates” that can be accepted as part of commercial banks legal reserves. These certificates can be distributed to low-carbon projects, and be exchanged by investors against concessional loans, reducing capital costs for low-carbon projects. Within this scheme, mitigation expenditures are com-pensated by a reduction in regular investments, so that immediate consumption is maintained. This framework is not as efficient as a carbon tax but may be politically easier to implement. Eventually, the key message of this thesis is that optimality is not a good framework for the evaluation of mitigation policies: mitigation costs are too dependent on uncertain exogenous drivers. Instead, robust approaches can be used both for the evaluation and the design of mitigation policies.
Eventually, the key message of this thesis is that optimality is not a good frame-work for the evaluation of mitigation policies: mitigation costs are too dependent on uncertain exogenous drivers. Instead, robust approaches can be used both for the evaluation and the design of mitigation policies.
References
Henriet, F., Maggiar, N., and Schubert, K. (2014). A stylized energy-economy model for france. Energy Journal.
IPCC (2001). The IPCC 3rd assessment report. Technical report, Intergovern-mental Panel on Climate Change (IPCC).
Olson, M. (1971). The Logic of collective action public goods and the theory of groups. Harvard University Press, Cambridge, Mass.
Oreskes, N. and Belitz, K. (2001). Philosophical issues in model assessment.
Model validation: Perspectives in hydrological science, 23.
Pindyck, R. S. (2013). Climate change policy: What do the models tell us? Work-ing Paper 19244, National Bureau of Economic Research.
1
The Shared Socio-Economic Pathways in
perspective
Building scenarios for climate change research
When Broecker popularized “Global Warming” in Science in 1975 (Broecker, 1975), he built a projection of future CO2atmospheric concentration and temperature
in-crease based on predicted fuel consumption until 2010. Shortly after that, Nord-haus (1977a) and NordNord-haus (1977b) projected future changes in global tempera-ture until 2080, and analyzed the costs of three different climate mitigation scenar-ios compared to this “uncontrolled” scenario. In 1989, the IPCC started preparing emissions scenarios to provide climate scientists with a basis for estimating future possible climate changes up to 2100, under the hypothesis that no mitigation pol-icy is implemented by then. A first set of scenarios was published in 1990 (IPCC, 1990), followed by the six IS92 scenarios in 1992 (Leggett et al., 1992; Alcamo et al., 1994).
A scenario can be thought of as a “coherent, internally consistent, and plausi-ble description of a possiplausi-ble future state of the world” (McCarthy, 2001). Most published analyzes of climate change mitigation policy, and many investigating climate change impacts and adaptations, have been based on long-term socioeco-nomic scenarios. Since the turning point between the second and third IPCC as-sessment report,¹ construction of scenarios has been recognized as a means for or-ganizing and communicating the many uncertainties associated with climate pol-icy support. By illuminating the span of possible futures, consideration of diverse scenarios has the potential to highlight the interaction of complex uncertainties that would otherwise be difficult to analyze (Groves and Lempert, 2007).
In climate change research, scenarios have mostly been produced by “story and simulation” methods (Garb et al., 2008). Groups of experts first work collabora-tively to build a few storylines that qualitacollabora-tively describe plausible, internally con-sistent outcomes for deeply uncertain processes, such as future population change, economic growth, and technological progress. These storylines are informed by experts’ intuition regarding the most important driving forces of these trends. Sto-rylines are then translated into representative quantitative projections, which are used as inputs to Integrated Assessment Models (IAMs) or different sectoral mod-els. IAMs then produce key outputs such as energy technology market shares, greenhouse gas emissions, and atmospheric CO2 concentration.
The gap between qualitative storylines and quantitative trajectories creates many methodological challenges that are disconnected from modeling difficulties. Among them is the different levels of consistency that are required within storylines and quantifications, and between them. One can describe a storyline as consistent if it embodies influences that are self-reinforcing (Schweizer and Kriegler, 2012). On the other hand, IAMs trajectories are consistent if the model can find solutions to the set of equations, given initial conditions. The consistency between story-lines and quantifications is however one of the biggest challenges of the story and simulation approach and will be discussed in this chapter.
Up to now, most analyzes have used the Special Report on Emissions
Scenar-¹The second IPCC assessment report was strongly based on econometrics and prevision, while from the third report on, IPCC assessments were built around a multiplicity of future sce-narios.
Figure 1.1: The SRES space.
ios (SRES, see Nakicenovic et al., 2000). These scenarios describe possible world evolutions in demographic, social, economic, and technological terms, up to 2100. To construct the SRES, experts adopted the scenario axis method as in Schwartz (1991), which uses quadrants of a two-dimensional space to define four scenarios (fig. 1.1). In the SRES, the axes were defined by degree of globalization and degree of sustainable development. The quadrants were used to sketch four storylines and quantify four sets of projected exogenous variables, which were used as model in-puts for many climate policy studies (see Parry et al., 2004, for one of the many ex-amples). The SRES scenarios were thus developed using a forward-looking logic that started by first describing driving forces, and then modeling the resulting emis-sions and atmospheric concentrations of greenhouse gases and aerosols. In this sequential approach, climate models were used last to project the magnitude and pattern of climate change under the different SRES scenarios.
The SRES assume that there are no climate change impacts and no mitigation policies. They have been used as “baselines” to assess the performance of adapta-tion and mitigaadapta-tion policies and to investigate residual impacts from climate change. For instance, the costs and benefits of climate mitigation policies can be estimated by comparing the change in global mean temperature in a SRES scenario and in the same scenario in which specific climate policies are implemented (see a review in IPCC, 2007). Also, the potential impacts of climate change can be assessed by
comparing a SRES scenario with the same scenario in which climate impacts are included (e.g., Arnell, 2004).
The modeling community however indicated that the scenario axis and sequen-tial methods often hindered effective use of scenarios (Moss et al., 2010; Parson et al., 2007). The sequential approach took more than ten years before climate modelers could use SRES to simulate different climate changes. Also, because sto-rylines were decided on separately from model construction, it was often difficult for the models to completely reflect the storylines (Wang et al., 2013).
Since the SRES were published, new information has accumulated in demo-graphic and socioeconomic projections, in impact, adaptation, and mitigation an-alyzes. The SRES demographic and socioeconomic assumptions are aging and new scenarios are needed to address more effectively the questions surrounding adaptation and mitigation policies (Ebi et al., 2013; Hallegatte et al., 2011). Such scenarios also need to cover a wider range of greenhouse gas concentrations (in-cluding those that can be reached by implementing mitigation measures) and to facilitate the integration of mitigation, adaptation, and impact analyzes (Ebi et al., 2013).
The scientific community has thus developed a new set of scenarios to replace the SRES (Moss et al., 2010; van Vuuren et al., 2012; Kriegler et al., 2010; Arnell et al., 2012; O’Neill et al., 2011; Ebi et al., 2013), following a different logic. Instead of a sequential approach, the new process builds climate and socioeconomic sce-narios in parallel, starting from a set of four future pathways for anthropogenic im-pact on the climate system, measured using “radiative forcings.” These four path-ways are known as representative concentration pathpath-ways (RCPs) and cover a very wide range of possible future radiative forcing: they range from ambitious climate stabilization at 2.6 W/m2forcing to 8.5 W/m2forcing, which correspond,
respec-tively, to atmospheric greenhouse gas concentrations of about 430 and 1230 ppm CO2-eq. in the year 2100. In contrast to the SRES, RCPs are first defined by GHG concentration outcomes instead of driving forces, and they don’t incorporate any socio-economic information.
Such a process gives a high relative autonomy between the IPCC groups I (on the physical aspects of the climate system) and II-III (on the socio-economic as-pects of climate change) for purely technical reasons. While climate modelers have
assessed the climate response to these RCPs for the IPCC fifth assessment report,² in IAM modelers are building socioeconomic scenarios, called Shared Socioeco-nomic Pathways (SSPs), consistent with the RCPs. As with the earlier SRES sce-narios, the new SSPs describe different socioeconomic characteristics, different vulnerabilities, and different GHG emissions.
The key point of the new scenarios architecture is that the four RCPs are not associated to a unique GHG emissions pathways or socio-economic pathway (van Vuuren et al., 2012; Guivarch and Rozenberg, 2013). Each RCP can result from different combinations of economic, technological, demographic or institutional evolutions.
The SSPs will also be combined with climate mitigation policies called Shared Policy Assumptions (SPAs). Indeed, even though some of the RCPs can be reached in “baseline” scenarios, i.e. with no mitigation policy, others will most likely re-quire to implement specific economic instruments to reduce GHG emissions.
The SSPs, combined with SPAs, will thus allow creating a correspondence be-tween the four RCPs and different combinations of socio-economic and policy assumptions.
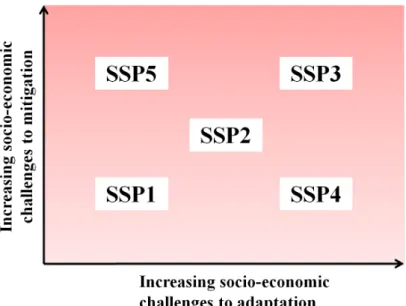
To assist with the exploration of both adaptation and mitigation questions with the same scenarios, Arnell et al. (2012) proposed to develop SSPs that are con-trasted along two axes: socio-economic challenges to adaptation and socio-economic challenges to mitigation (Figure 1.2). In this challenges space, three domains cor-respond to futures where mitigation and adaptation challenges co-vary (SSP1, SSP2, SSP3), while two domains are mixed futures where adaptation challenges domi-nate (SSP4) or mitigation challenges domidomi-nate (SSP5). This new framework will allow two distinct research communities working on the same scenarios and high-lighting the synergies and trade-offs between adaptation and mitigation issues.
To build the scenarios, experts adopted a “story and simulation” approach (as for the SRES) and gathered in Boulder in November 2011 to build five storylines for the SSPs. Building narratives for each of the SSPs required imagining five co-herent, internally consistent, and plausible future states of the world defined in terms of challenges to adaptation and mitigation. Those five narratives that depict
²for instance RCP2.6 maintains global temperature increase below 2C by the end the century while RCP8.5 can lead to temperature increases of 4C by 2100.
Figure 1.2: The challenges space.
five future states of the world are different in nature from those of the SRES, which were built around future identified trends (e.g. consumption preferences, global-ization). Here, since the classification of any particular scenario as representative of any of the five domains depends upon its outcomes, the socio-economic driving forces of future challenges remained to be identified.
The concepts of “challenges to adaptation and mitigation” are broad and were not clearly defined in the scenario framework. Each expert could thus interpret these challenges with their own indicators (e.g. CO2emissions or cost of low
car-bon technologies for mitigation challenges, GDP per capita or exposure to climate change for adaptation challenges). Also, no structured discussions were organized to agree on the socio-economic driving forces of future challenges to adaptation and mitigation.
Experts therefore started from five future states of the world defined implicitly by some indicators of future challenges to adaptation and mitigation, and leaning on the drivers they had intuitively identified as relevant for these indicators, they built the narratives representative of the five SSPs. The narratives can be found in O’Neill et al. (2011).
of quantitative projections for population, GDP and urbanization (the “drivers”), which will be used as inputs to Integrated Assessment Models. These models will then produce key outputs such as energy technology market shares or greenhouse gas emissions for each SSP.
In a second step, these same models calculate, for each SSP, the costs of reach-ing a given stabilization target. The quantified drivers will also be used for local adaptation studies and sectoral models.
Limitations of the “story and simulation” approach
This innovative process met some methodological challenges in its practical im-plementation.
Given the uncertainty surrounding all possible drivers of future challenges to adaptation and mitigation, and given the feedbacks and correlations that exist be-tween these different drivers, relying on intuition to build storylines may hamper the process of building internally-consistent storylines, or storylines that will be consistent with model outputs. For instance, there are many links between the evolution of population and GDP growth — e.g. high birth rates can reduce GDP growth through investments effects or “capital dilution” (Brander and Dowrick, 1994), population aging has strong effects on labor supply and induces large struc-tural changes that impact growth (Borsch-Supan, 2003), education spending, which is correlated to wealth levels, have strong impacts on population and economic growth (Mankiw et al., 1992; Lutz and Kc, 2011) — and many of them are not captured quantitatively when both pathways are determined by separate models.
Two limitations of the “story and simulation” approach for building SSPs are discussed in this thesis: (i) this approach does not guarantee that the final scenar-ios will be contrasted enough to cover a wide range of challenges to mitigation and adaptation; (ii) there may be an important consistency gap between the storylines and the quantifications.
The first concern materialized in The Hague in May 2012 when IAM teams presented the first quantifications based on the population and GDP projections that were produced by IIASA and the OECD respectively. When they interpreted the SSP narratives, the OECD modeling team constructed very contrasted
projec-tions. Growth is very high in SSP5 – high challenges to mitigation and low chal-lenges to adaptation – with 3% global mean GDP per capita growth rate per year between 2010 and 2100, while it is very low growth in SSP3 – high challenges to adaptation and mitigation – with 0.9% global mean GDP per capita growth rate per year between 2010 and 2100. In 2100, GDP per capita is thus more than six times higher in SSP5 than in SSP3. As a result, although it may look surprising at first glance, the IAMs that used these GDPs as inputs produced outcomes that did not match the SSP storylines in terms of GHG emissions. For instance, GHG emissions were low in SSP3 while this scenario is defined by high challenges to mitigation. Indeed, in SSP3 GDP per capita is so low in some regions of the world that in IAMs emissions are limited by the lack of economic activity after 2050.
Of course, other indicators of challenges to mitigation could be high in SSP3, for instance bad governance or very expensive low-carbon technologies. However, building SSPs coherent with the RCPs and the corresponding climate projections requires that some scenarios meet RCP8.5 concentration levels.
The second concern in the construction of SSPs is the internal consistency of the storylines, and their consistency with the quantifications. The internal consistency issue of the narratives is addressed by Schweizer and O’Neill (2013), who use a systematic technique for the development of storylines called the cross-impact bal-ance (CIB) method and find that most of the internally-consistent scenarios lie on the SSP1-3 diagonal in the challenges space.
Here, we are concerned by another consistency issue. The narratives assume, with very few theoretical justification, that GDP growth is higher in SSP5 – which is very energy-intensive – than in SSP1 – which is energy-sober. The numerical in-terpretations thus lead to a GDP per capita that is 1.7 times higher in SSP5 than in SSP1 in 2100 (3% against 2.4% mean GDP per capita growth rate per year between 2010 and 2100). This view that an environmentally-friendly world creates less wealth than an energy-intensive world was already anchored in the SRES scenar-ios. In the A1B1 scenario (energy intensive), GDP per capita is 74.9 1031990US$ in 2100 while it is only 46.6 1031990US$ in the B1 scenario
(environmentally-friendly). These numbers amount to a 2.7% mean growth rate per year between 1990 and 2100 in A1 against 2.25% per year in B1. This opposition between growth and the environment is not grounded on solid scientific evidence and can lead to
mis-interpretation and misuse of scenarios. For instance, Lomborg claimed in his book (Lomborg, 2001; Hourcade and Journé, 2003) that this lower GDP growth in the B1 scenario was the cost of climate mitigation. This interpretation is wrong since SRES are defined by different preferences and values, making the compar-ison of GDPs irrelevant. Also, all SRES scenarios are baselines, i.e. they do not model climate mitigation policies. Mitigation costs can only be assessed within each scenario, comparing GDP in the baseline scenario with that of a similar sce-nario in which a policy is implemented to reach a climate stabilization target.
Such interpretation of the scenarios can be detrimental to the climate change community as it can give the impression that there is trade-off between energy ef-ficiency and development potentials. Lessons were not learned from the SRES in that regard, and scientists keep implying that an environmentally-friendly world creates less wealth than an energy-intensive one when they build scenarios, even though there is no evidence of such a strong assumption. In chapters 3 and 5 and in appendix C we find that when using an IAM with endogenous GDP, that is which represents the feedbacks of energy consumption and fossil fuels depletion on eco-nomic growth, GDP tends to be higher in scenarios with low energy intensity than in energy-intensive ones. In chapter 2 we find that when using GDP and CO2 emissions as indicators to future challenges to adaptation and mitigation, very few scenarios end up in the SSP5 domain (high challenges to mitigation low challenges to adaptation, Fig. 1.2). This suggests that with our model, the quantifications of SSP5 are not consistent because high GDP growth is most of the time associated with high energy efficiency. In Chapter 3 and Appendix C we show that when using an IAM with endogenous GDP, computing a higher GDP in SSP5 than in SSP1 implies changing assumptions on future coal availability. Indeed, in a fossil energy-intensive scenario, high GDP growth (that is, one possible interpretation of SSP5) can only be achieved with large availability of coal and unconventional oil.
These results suggest that the assumption of an opposition between growth and the environment is not only misleading but also possibly wrong. For future re-search, it is thus worth investigating the links between energy consumption and economic growth in depth and incorporating these mechanisms in IAMs.
Building databases with Integrated Assessment Models
The dominant approach consisting in choosing a small number of scenarios and treating each as a distinct “parallel universe” made sense when computer time was scarce. However, a general shortcoming of this approach is that the wide variety of future uncertainties is inspected ad hoc leaving many uncertainties and potential risks un-investigated. Some authors suggest that the ad hoc nature of these scenar-ios constrains their policy relevance, since it can easily be argued that such stud-ies are not comprehensive (Lloyd and Schweizer, 2013; Schweizer and Kriegler, 2012), and many stakeholders do not recognize themselves in the analysis.Now that computational capacity has greatly improved, more reliable method-ologies than the “story and simulation” approach could be used. For instance, more value may come from adopting risk analytic perspectives, where the condi-tions for policy failure are identified (e.g. Lempert, 2013), or the analysis is tasked with uncovering less biased scenarios (this from a statistical perspective, e.g. Mor-gan and Keith, 2008; Shlyakhter et al., 1994). In the case of SSPs, experts could analyze scenario databases that cover a wide range of uncertainties for the possi-ble drivers of future challenges to adaptation and mitigation, and choose ex-post the most relevant and consistent scenarios. Such a methodology would be all the more relevant as SSPs are defined by their outcome (challenges to adaptation and mitigation) and not by their drivers.
Methodology
As in any quantitative scenarios exercise, building a scenario database requires structuring the problem, i.e. carefully defining the question or the decision, with clear distinctions drawn between alternative outcomes for a single decision maker. It also requires identifying key decision metrics in consultation with that decision maker and key uncertainties (Lempert et al., 2003).
Problem structuring leads to choose — or develop — one or several numeri-cal models that represent the exogenous uncertainties, the policies levers and the relationships between them.
Once in possession of one of several appropriate models, the next step is the construction of a database. There are an infinite number of combinations of
plau-sible values of the model(s) input parameters. Depending on the number of uncer-tainties that need being considered and of the size of the model, different methods can be used.
In this thesis, we will use the IMACLIM-R model, an Integrated Assessment Model developed at CIRED, since it is this only one at our disposal. It also sim-plifies the work, as analyzing the underlying drivers of scenarios generated with a single model is much easier than doing so for the outputs of many models that vary in model focus, structure and assumptions.
With IMACLIM-R, we choose two or three possible values for each parameter (based on the literature) and we group the parameters into a few subsets of param-eters (between 5 and 10 generally) to avoid combinatory explosion. Combining the two or three possibilities for each subset leads to the simulation of several hun-dred scenarios that cover the uncertainty space a priori important for the issue we are analyzing.
Databases open up new perspectives
Working with a large ensemble of quantitative scenarios opens up new perspec-tives illustrated in this thesis and related working papers. It can help select ex-post a small number of scenarios relevant for a given question, identify emerging behav-iors across all scenarios, assess the sensitivity/robustness of a result to uncertainty or analyze the ensemble dynamically to identify shifts in pathways.
With only a small number of scenarios, one cannot possibly know whether the mechanisms or numbers assessed are robust to a variation of key parameters or if they are looking at a special case. With a scenario database, quantifications are associated to the margins of error due to the uncertainties considered. This helps discriminating robust results from those that are sensible to key parameters.
Also, a scenario database allows analyzing the result distribution and applying probabilistic reasoning if one is capable of building (subjective) probability distri-butions for the input parameters or the resulting scenarios. The scenario ensemble can then be analyzed to identify emerging behaviors. For instance, looking for cor-relations between different measures enlightens multi-criteria decisions and high-lights the possibilities for synergies or trade-offs. To go further, it is also possible
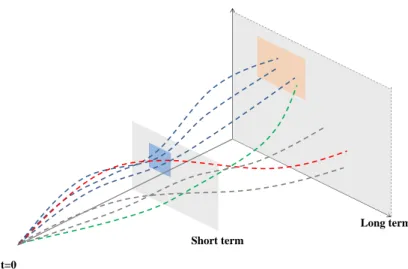
Long term Short term
t=0
Figure 1.3: Windows of opportunity
to evidence the conditions that lead to these synergies. Statistical techniques are used to discover the main drivers of a group of scenarios, i.e. the combination of input parameters that lead to certain results in the output space.
Furthermore, the database can be analyzed in a dynamic way, in order to link the short and the longer-run and discover windows of opportunity (fig. 1.3 and Guivarch et al., 2014). A dynamic approach indeed moves away from the “parallel universes” approach and allows answering questions such as “where should I be in the short-run to be able to reach this particular long-term objective?” (it is comple-mentary to sequential decision-making such as in Ha Duong et al., 1997). Given the diversity of possible long-run trajectories, such a question is only relevant for a large number of scenarios.
Finally, in situations where a small number of scenarios is required (for instance to communicate the results or harmonize different studies that will rely on the same scenarios), a database can help choosing the scenarios that will be most rel-evant to the question we are asking.
Systematic scenario techniques can assist the construction of consistent story-lines and bring transparency to the usual story and simulation methodologies. As an example, the quantitative results for SSP2 in chapter 2 illuminate the difficulties that were met during the Boulder meeting when storylines had to be built (O’Neill et al., 2011). These demonstrate that a scenario elicitation methodology that starts
from indicators of future challenges to adaptation and mitigation cannot easily find relevant drivers for a middle scenario (SSP2). The “middle of the road” SSP – SSP2 – was indeed problematic in Boulder as the endpoint was not well defined: medium challenges for both adaptation and mitigation was hard to depict in an unanimous way. In particular, it was unclear whether SSP2 was in the middle be-cause many indicators of future challenges to adaptation and mitigation were in the middle, or because the scenario was a combination of opposite extreme (e.g. high availability of low-carbon technologies but very bad governance may gener-ate middle challenges to mitigation). When using the quantitative methodology in chapter 2, the endpoint is well defined (quantitative indicators of challenges are in a “middle” state) but there is no unique set of drivers that put scenarios in the SSP2 domain (or out of this domain). These results show that SSP2 cannot be defined properly. As a consequence, in place of the backwards approach used for other SSPs, experts adopted a forecast approach and defined the SSP2 as a “con-tinuation of current trends” scenario.
Accordingly, thinking that models can solve all issues in scenario building is il-lusionary. Models are helpful tools to help organize the experts’ thoughts but they are limited. We do not discuss the relevance of existing models in this thesis, and the interested readers can refer to Crassous (2008) for a detailed discussion on the IAM modeling community. Here, we use scenario databases to put scenario building methodologies into perspective (chapter 2), improve the utilization of complex models for climate change mitigation and highlight robust behaviors or policies (chapters 3 and 5).
References
Alcamo, J., Bouman, A., Edmonds, J., Grubler, A., Morita, T., and Sugandhy, A. (1994). An evaluation of the IPCC IS92 emission scenarios. International institute for applied systems analysis.
Arnell, N. (2004). Climate change and global water resources: SRES emissions and socio-economic scenarios. Global Environmental Change, 14(1):31–52. doi: 10.1016/j.gloenvcha.2003.10.006.
Arnell, N. W., Kram, T., Carter, T., Ebi, K. L., Edmonds, J. A., Hallegatte, S., Kriegler, E., Mathur, R., O’Neill, B., Riahi, K., Winkler, H., van Vuuren, D., and Zwickel, T. (2012). A framework for a new generation of socioeconomic scenarios for climate change impact, adaptation, vulnerability, and mitigation research.
Borsch-Supan, A. (2003). Labor market effects of population aging. LABOUR, 17:5–44. doi: 10.1111/1467-9914.17.specialissue.2.
Brander, J. A. and Dowrick, S. (1994). The role of fertility and population in economic growth. Journal of Population Economics, 7(1):1–25. doi: 10.1007/ BF00160435.
Broecker, W. S. (1975). Climatic change: Are we on the brink of a pronounced global warming? Science, 189(4201):460–463. doi: 10.1126/science.189.4201. 460. PMID: 17781884.
Crassous, R. (2008). Modéliser le long terme dans un monde de second rang :
appli-cation aux politiques climatiques. Ph.D. thesis, Institut des Sciences et Industries
du Vivant et de l’Environnement (Agro Paris Tech), Paris, France.
Ebi, K. L., Hallegatte, S., Kram, T., Arnell, N. W., Carter, T. R., Edmonds, J., Kriegler, E., Mathur, R., O’Neill, B. C., Riahi, K., Winkler, H., Vuuren, D. P. V., and Zwickel, T. (2013). A new scenario framework for climate change research: background, process, and future directions. Climatic Change, pages 1–10. doi: 10.1007/s10584-013-0912-3.
Garb, Y., Pulver, S., and VanDeveer, S. D. (2008). Scenarios in society, so-ciety in scenarios: toward a social scientific analysis of storyline-driven en-vironmental modeling. Enen-vironmental Research Letters, 3(4):045015. doi: 10.1088/1748-9326/3/4/045015.
Groves, D. and Lempert, R. (2007). A new analytic method for finding policy-relevant scenarios. Global Environmental Change, 17(1):73–85. doi: 10.1016/j. gloenvcha.2006.11.006.
Guivarch, C. and Rozenberg, J. (2013). Les nouveaux scénarios économiques pour la recherche sur le changement climatique. the new socio-economic scenarios for climate change research. Revue Pollution Atmosphérique, Special issue.
Guivarch, C., Schweizer, V., and Rozenberg, J. (2014). Enhancing the policy rele-vance of scenarios through a dynamic analytical approach. On going work. Ha Duong, M., Grubb, M., and Hourcade, J.-C. (1997). Influence of
socioeco-nomic inertia and uncertainty on optimal CO2-emission abatement. Nature, 390(6657):270–273.
Hallegatte, S., Przyluski, V., and Vogt-Schilb, A. (2011). Building world narratives for climate change impact, adaptation and vulnerability analyses. Nature Climate
Change, 1(3):151–155. doi: 10.1038/nclimate1135.
Hourcade, J. and Journé, V. (2003). Lomborg et la negation du risque climatique.
Critique Internationale, 18.
IPCC (1990). Climate change, the scientific assessment. Technical report, WMO/UNEP, Cambridge University Press, Cambridge,.
IPCC (2007). The IPCC 4th assessment report. Technical report, Intergovern-mental Panel on Climate Change (IPCC).
Kriegler, E., O’Neill, B. C., Hallegatte, S., Kram, T., Lempert, R., Moss, R., and Wilbanks, T. (2010). Socio-economic scenario development for climate change analysis. Technical report, CIRED Working Paper DT/WP.
Leggett, J., Pepper, W. J., and Swart, R. J. (1992). Emissions scenarios for IPCC: an update. Climate change, pages 69–95.
Lempert, R. (2013). Scenarios that illuminate vulnerabilities and robust re-sponses. Climatic Change, pages 1–20.
Lempert, R. J., Popper, S. W., and Bankes, S. C. (2003). Shaping the next one
hun-dred years: new methods for quantitative, long-term policy analysis. Rand