Publisher’s version / Version de l'éditeur:
Canadian Journal of Physics, 38, 9, pp. 1137-1148, 1960-09
READ THESE TERMS AND CONDITIONS CAREFULLY BEFORE USING THIS WEBSITE. https://nrc-publications.canada.ca/eng/copyright
Vous avez des questions? Nous pouvons vous aider. Pour communiquer directement avec un auteur, consultez la
première page de la revue dans laquelle son article a été publié afin de trouver ses coordonnées. Si vous n’arrivez pas à les repérer, communiquez avec nous à [email protected].
Questions? Contact the NRC Publications Archive team at
[email protected]. If you wish to email the authors directly, please see the first page of the publication for their contact information.
NRC Publications Archive
Archives des publications du CNRC
This publication could be one of several versions: author’s original, accepted manuscript or the publisher’s version. / La version de cette publication peut être l’une des suivantes : la version prépublication de l’auteur, la version acceptée du manuscrit ou la version de l’éditeur.
Access and use of this website and the material on it are subject to the Terms and Conditions set forth at
The cracking activity in ice during creep
Gold, L. W.
https://publications-cnrc.canada.ca/fra/droits
L’accès à ce site Web et l’utilisation de son contenu sont assujettis aux conditions présentées dans le site LISEZ CES CONDITIONS ATTENTIVEMENT AVANT D’UTILISER CE SITE WEB.
NRC Publications Record / Notice d'Archives des publications de CNRC:
https://nrc-publications.canada.ca/eng/view/object/?id=dd4aa80e-da9c-4e36-9dd6-c9f08f93a2ff https://publications-cnrc.canada.ca/fra/voir/objet/?id=dd4aa80e-da9c-4e36-9dd6-c9f08f93a2ffTHE CRACKING ACTIVITY I N ICE DURING CREEP1
ABSTRACT
Observations were made a t one temperature on the cracks t h a t form in ice during creep under constant compressive load. The ice had a hexagonal symmetry with respect to the grain boundaries. The load was applied perpendicular t o the lona axis of the grains. A piezoelectric crystal was used to detect the cracking
actrvity in the ice. -
Two stages of cracking were observed. T h e first occurred during the transient period of t i e creep, and ;he plane of these cracks tends t o be parafie1 to the grain boundaries and to the direction of the stress. The rate a t which these cracks formed decreased very markedly as the creep rate approached a constant value. Above a certain stress, the creep rate continuously increased with time. Under this condition the second stage of cracking was observed. These cracks tend t o be more irregular in direction a n d to occur in planes that are a t 45O to the applied stress.
I N T R O D U C T I O S
Observations on the elastic and creep behavior of ice under constant com- pressive stress have been carried o u t b y Brown (1926). A t lower stresses he observed a creep rate which, after the initial transient stage, tended t o decrease with time t o a constant value characteristic of the stress. A t a critical stress range, between 190 a n d 200 p.s.i. for the temperature a n d load conditions of the experiment, the character of the creep-time curve changed radically from one for which the creep rate decreased with time to one for which it increased with time. T h e period of observation was never more than 3+ hours.
Throughout his paper, Brown refers to internal cracking of the ice and associated audible "crackling" that occurred during a load test. Qualitatively, his comlnents indicate t h a t the intensity of "cracltling" dependson the tempera- ture and on the magnitude of the applied stress.
T h e creep of ice and its general dependence on stress, temperature, and time is similar to t h a t observed for many materials. Glen (1958), in his review of such investigations, found t h a t the minimum observed strain rate is related to the applied stress according to the law:
LManuscript received May 10, 1960.
Contribution from the Snow a n d Ice Section, Division of Building Research, National Research Council. Ottawa. Canada.
Issued a s N . R . ' ~ . No. 5763.
1138 C A N A D I A N JOURNAL O F P l I Y S l C S . VOL. 38. 1960
where d is the strain rate, c is the applied stress, and k is a constant. The exponent n is observed to increase with c within the range 1.85
<
n<
4.16 for1.0
<
c<
15 kg/cm2. Glen (1955) observed that until accelerating creep occurs,ice obeys the Andrade law with the initial transient in the creep curve being proportional to the cube root of the time.
Cracking activity has been reported in other inaterials during co~npressive loading. Obert (1945) conducted investigations in the laboratory to see if the microseismic activity, which he observed in rock in the field, could also be detected with roclt specin~ei~s subject to compressive loads in the laboratory. He observed a high "microseismic rate" when the load was bet\veen 1/8 to 1/2 the ultimate strength of the roclt. This rate had decreased to a minimum \\-hen the load reached 1/2 to 3/4 the ultimate strength. As the load was increased, he observed that the roclts that tendecl to shatter showecl a marlted increase in "microseismic" activity at about 8/10 of the crushing strength, whereas the rocks that tended to crush showed comparatively little increase in activity. He was able to show t h a t the first maximum in his observed "microseismic" activity was due to the geometry of loading. If he held the load constant a t stresses up to 9/10 the ultimate load, the activity rate in the sample decreased with time to a constant value which depended on the magnitude of the load. Bridgman (1949) attributed ailoinalies in the voluine change during loading for loads approaching the ultimate strength of the material to the formi~lg of internal cracks or interstices a t grain boundaries, mecha~lical impurities, or around dislocations in the lattice.
Jones (1052) observed that the velocity of an ultrasonic pulse transmitted through a concrete speci~lleil in a direction perpendicular to the applied com- pressive load began to decrease when the load was about 25 to 30y0 of the ultimate strength. He attributes this decrease to the formation of internal craclts. Because the velocity of a pulse propagated in the direction of the stress did not change, he concluded that the plane of the cracks must be parallel to the directioil of the stress.
Riisch (1959) using a crystal pickup, recorded the internal cracking in concrete subject to compressive loads. For loads within 85'34 of the 1-minute ultimate strength, he observed a high rate of cracking when the load was first applied. This rate dropped off but increased again rapidly just before failure occurred.
T h e purpose of the observations reported in this paper was to investigate a t one teinperature and under constant coinpressive load, the craclting activity t h a t occurs in ice during creep. In particular, it was desired to investigate the sudden transition t h a t Brown reported in the character of the creep-time curve and to see if this transition was in some way related to the internal cracking.
E X P E R I M E N T A L P R O C E D U R E
The observations were carried out on rectangular ice specimens 5 X 10 cill and 20 crn long prepared a t -10' C with a standard metal cutting lathe and a wood planer. A small, manually driven testing machine (Hounsfield
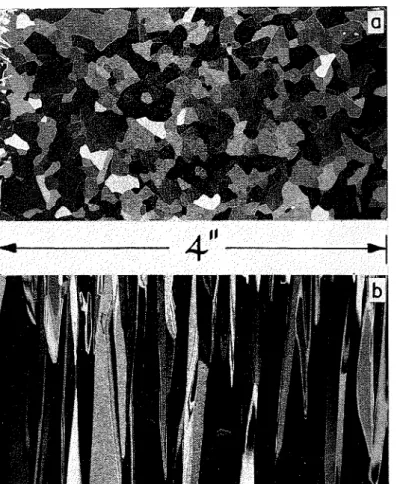
FIG. 2. ' r h i l ~ ~ c c t i o ~ i s of test S ~ ) C C ~ I I I C I I \.ic\vecl \vittl polarized light: ( a ) section perpendicular
GOLD: CRACKING ACTIVITY IX I C E 1139
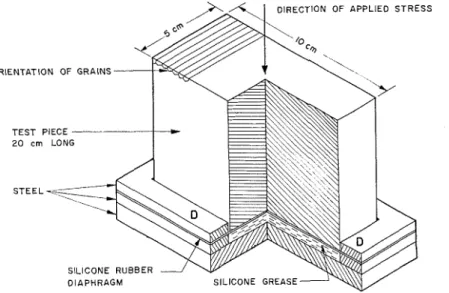
tensometer) with a capacity of 2000 lig was used for applying the load. The test pieces were mounted between special loading heads one of which is shown in Fig. 1. The silicone grease, separated from the ice by the silicone rubber
I DIRECTION O F APPLIED STRESS
ORIENTATION OF GRAINS T E S T PIECE --- 2 0 cm LONG S T E E L SILICONE RUBBER
2
'
DIAPHRAGM SILICONEFIG. 1. Slcetch of loading head construction.
diaphragm, ensured t h a t the applied compressive stress was uniform over the test piece.
T o keep the silicone rubber from shearing during an experiment, water \vas frozen in the small space between the test piece and D of the loadi~lg heads. The frozen bond between the ice and D failed as soon as a load was applied but the ice was constrai~led from deforming laterally. This constraint influenced the distribution of craclis in the vicinity of the loading heacl as will be shown later.
An extensometer with a 2-in. gauge length and a strain magnification of 3300 was used for measuring the creep. The gauge had to be remounted periodically because of its limited range. The creep u7as recorded on a Baldwin X-Y
recorder, model MD-2. The pen of the recorder automatically and continuously traversed the chart paper a t a constant rate of 2$ inches per minute. T h e creep-time curve was co~lstructed by aligning the measured sections on the known time base.
The ice used in the observations was prepared fro111 ordinary tap water in a cylindrical container about 1 meter in diameter. The direction of freezing was perpendicular to the water surface. When the water surface cooled to 0" C, ice grains were spl-iniiled on the surface to act a s centers of nucleation. The result- ing grain structure as seen with polarized light is shown in Fig. 2. Figure 2a is a thin section cut parallel to the ice surface and Fig. 2b is a section cut perpen- dicular t o the surface. The columnar structure is typical for multigrained ice often encountered under natural conditions.
1140 CANADIAN JOURNAL OF PHYSICS. VOL. 38. 1960
T h e test specimens were cut so that the long axis of each grain was perpen- dicular to the 1 0 x 2 0 cm face and therefore perpendicular to the applied compressive stress as shown in Fig. 1. The stress applied to the test specimen was kept constant to & l y o of the applied load during the test.
T o measure the cracking activity in the ice during creep, a piezoelectric crystal was frozen to one face of the test piece. The output from the crystal was fed into a high-gain amplifier and then recorded. Each tirne a disturbance occurred within the ice that would set u p a shock wave, the event caused a deflection of the recorder pen.
The observations were carried out in a cold rooln maintained a t
-
10&0.5' C. The test pieces were stored in the rooin in kerosene for a t least 24 hours before they were loaded in the testing machine.Cracking Activity
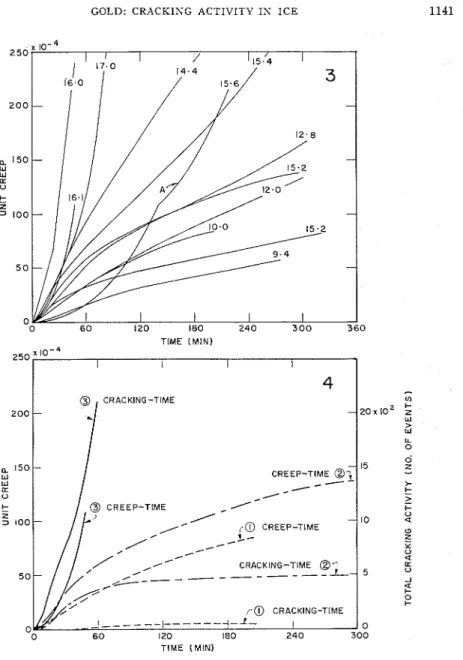
Figure 3 shows that the observed creep-time curves for all tests exhibit an initial increase in creep rate with time. Those subjected to a stress less than about 16 kg/cm2 had a decreasing creep rate with time after about the first half hour. Two of these showed a tendenc~. to a later period of increasing creep rate with time.
Figure 4 shows the observed dependence of the total cracking activity on time for three test pieces subject to the applied stress given in the figure. Also show11 are the associated creep-time curves. At a stress of 10 kg/cmz, very little internal cracking occurred; a t a stress of 15.2 kg/cm2 the cracking activity was appreciable. Most of the activity occurred in the first hour during the transient portion of the creep-time curve. After 13 hours, practically no further cracking occurred. When the stress was greater than about 16 kg/cni2, and the creep rate showed no t e n d e r ~ c ~ to decrease with tiine, the cracl<ing activity greatly increased.
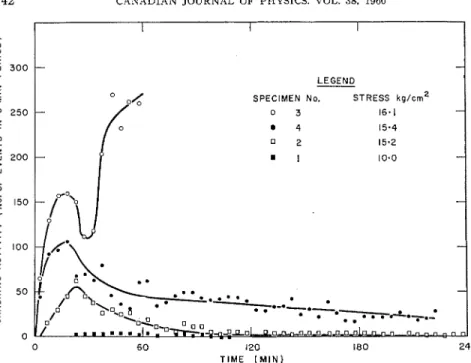
Some of the details in the cracking-time curves are shown in Fig. 5 where the number of disturbances that occurred in a 3-minute interval are plotted against tinie. The resulting curve is an approximation to the rate of cracking activity. One further set of observations made a t a stress of 15.4 kg/cin2 is shown to illustrate the oscillatory character of the rate of crac1;ing activity after the first maximum. The cracks seein to occur in bursts a s though a critical situation developed within the test piece, which then was relieved by the formation of cracks. Figure 5 shows also that even when the applied stress was great enough that no decrease was observed in the rate of creep, a decrease \\-as observed i l l the cracking rate but then the rate increased beyond the original inasimurn.
I n Fig. 6, the logarithm of the total cracking activity that occurred during the first hour, which amounted to a t least GOYo of the total cracking activity observed, is plotted against the applied stress. The line drawn is the least squares fit to all the observations made. This figure shows the marked depen- dence that the cracking activity has on the applied stress.
GOLD: CRACKING ACTIVITY I N ICE 1141 TlME ( M I N I 200 - - 20 - 15 CREEP-TIME 9- /
-
- 10 CRACKING-TIME @: 5 / @ CRACKING-TIME 0 300 CRACKING-TIME CREEP-TIME 9 I-- /-
C R E E P - T I M E'
;a
CREEP-TIME , / / - TIME ( M I N )FIG. 3. Creep-time curves. T h e stress in kg/cm2is given for each curve.
FIG. 4. Three typical examples of the dependence of the total cracking activity a n d the creep on time a t the applied stress given. (1) ---stress = 10 kg/cm?; (2) -- - stress =
15.2 kg/cm2; (3)
-
stress = 16.1 kg/cm2. Crack FormationThe cracks \\rere observed t o propagate parallel t o the long clirectio~i of the grain boundaries and perpe~ldicular t o the appliecl stress. This is sho\vn in Fig. 7b where each light 11larli is a crack. T h e edge view shows that in some cases the cracks will propagate fro111 face t o face. For stresses below about 15 kg/cm2, the crack distribution, u~hich resulted during the period of loading,
CANADIAN JOURNAL O F PHYSICS. VOL. 38. 1960
LEGEND
SPECIMEN No. STRESS kg/crn2
60 120 1 8 0
T I M E ( M I N )
FIG. 5. Time dependence of the rate of cracking activity.
FIG. 6. minutes.
STRESS P (kg/crn2)
Frc,. 7. E s a ~ i i l ~ l c s of crack clcvclop~ncnl in ice cluring crccp (scale i n i ~ ~ c l i c s ) : (cc) slrcss, 10 I<g/c~n?; cl~~ralioli of loacl, 180 nlinutes; (6) stress, 15.2 kg!cm'; clul-atioll of load, :100 minutes;
( c ) stress, 10 kg/cm3; d ~ ~ r a t i o n of loacl, 50 minutes; (d) stress, 15.0 Icg/cm?; duration of load,
GOLD: CRACKING A C T I V I T Y I N I C E 1143
was fairly uniform as shown in Figs. 7a and 7b. For stresses greater than about 15.5 kg/cm2, a marlced change occurred in the character of the cracking and this change was associated with the increase in the craclcing rate shown in Fig. 5 for speciineil 3. In these cases, after an initial cracking period of 15 to 30 minutes, during which the craclcs formed uniformly throughout the test piece, the craclcs tended to form in planes that were about 45" to the applied stress and parallel to the grain boundaries as shown in Fig. 76. In only one case out of the five in which these cracking planes developed was the plane not parallel to the grain boundaries. This is shown in Fig. 7 d ; its creep-time curve is designated by A in Fig. 3.
Most of the test pieces were quite free of craclcs in a triangular zone adjacent to the loading heads as shown in Fig. 76. This is thought to be due to the con- fining influence of the loading heads.
Two test pieces were subjected to stresses of the order of 14 kg/cm2 and allowed to deform until a number of cracks had developed. The angle between the plane of each crack and the direction of the stress was measured. The resulting distribution diagram for 56 craclcs observed, which is shown in Fig. 8, sho\vs that there is a definite preference for a crack to for111 with its
A N G L E 8 ( D E G R E E S )
FIG. 8. Number of cracks in 28-degree interval with plane of crack a t angle 0 t o stress.
plane parallel to the direction of the applied stress. No cracks were observed with their plane a t an angle greater than 4.5" to the stress. As already mentioned, the long direction of the cracks is parallel to the grain bound? ries. '
Out of 74 cracks studied, 22 occurred a t grain boundaries. An additional eight occurred a t grain boundaries but were also partly transcrystalline. The remainder were completely transcrystalline.
T h e water n~olecules in ice are loose-packed and the single crystal has an hexagonal symmetry. A11 attempt was made to see if there was any correlation between the direction of the axis of hexagonal symmetry and the direction of
1144 CANADIAN JOURNAL O F PHYSICS. VOL. 38, 1960
the plane of those cracks that were transcrystalline. A11 etching technique described by Higuchi (1958) was used to determine the crystallographic orientation. No positive correlation was found because it proved to be almost impossible to form an etch pit in grains containing a crack using Higuchi's technique.
I t was realized during the etch-pit observations and later confirmed by observations using polarized light that there was a bias in the crystallographic orientation of the grains. I t had been hoped that seeding with snow would result in a randonl orientation. Hillig (1958) has shown that ice crystals grow more quickly perpendicular to the axis of the hexagonal symmetry than parallel to it. As a result, crystals with their s y ~ n ~ n e t r y axis perpendicular to the direction of growth tend to squeeze out those t h a t are parallel. I n the present experiments, no crystals were observed that had their axis of hexagonal symmetry within 45' of the direction of growth. Thus, the easy slip plane of the grains tended to be parallel to the grain boundaries. Because the symmetry axis tended to be normal to the grain boundaries and therefore parallel to the ice surface, it was impossible with the apparatus available to determine its direction accurately with polarized light. I t was observed that a t least 12 of the 44 transcrystalline cracks were either parallel or perpendicular to the symmetry axis and therefore parallel or perpendicular to the easy slip plane.
Deformation of the Test Pieces
Measurements were made on one specimen that had been subject to a stress of 17 kg/cm2 to determine the change of volume that occurred over the section where the creep was measured. An increase in volunle of approxi~nately 3% was observed. This increase is probably due to the formation of the cracks. When the sample was immersed in kerosene for storage after the observations, air bubbles were observed to issue from some of the cracks.
All of the lateral defornlation of the specimen was observed to be normal to the grain boundaries. KO significant creep in the direction parallel to the long axis of the grains was observed in any of the tests. The ice defornled in a way similar to a pile of logs subject to a load perpendicular to the long dimension of the logs. At the conlpletion of a test, the edges of most of the test pieces were very irregular and it was possible to recognize irldividual grains because of their displacement relative to their neighbors.
DISCUSSION
In an earlier paper, Gold (1958) presented evidence \vhich indicated that when ice, a t a temperature between 0" C and -40" C, is subject to a uniaxial compression normal to the grain boundaries, there is a relaxation of the shear stress a t the grain boundaries. Consider the array of hexagonal grains shown in Fig. 9. If the shear stress relaxes a t the grain boundaries, a tensile stress will be developed across the planes nearly parallel to the applied stress, such as A-A, whose average value is given approximately b y
GOLD: C R A C K I N G A C T I V I T Y IK I C E
FIG. 9. Array of hexagonal grains.
where
p
is the average tensile stress, c is the compressive stress,0
<
a<
1 is the proportion of shear stress still effective a t the grain boundary,b is the angle between the applied stress and the plane under con- sideration. For b = 0 ° ,
This demonstrates that under conditions of uniaxial compression, if the shear stress can relax a t the grain boundaries, each grain \\till be subject to both compressive and tensile stresses. The magnitude of these stresses at each point will depend on the value of the applied stress, the local geometry of the grain boundaries, and their orientation with respect to the applied stress. I n the present case, the stress field is biaxial because of the columnar nature of the grains. Under these conditions, one ~vould expect cracks to form parallel to the grain boundaries with their plane tending t o be parallel to the direction of the applied stress, that is, to form in planes across which tensile stresses can develop. Furthermore, it would be expected that the number of such sites available for crack formation would be limited and \vould depend 011 the magnitude of the stress as was observed (Fig. 4).
Figures 4 and 5 show t h a t the initiation and extension of a crack in ice is time dependent. If one considers the conditions necessary for the clevelopment of a crack according to the theory put forward by Griffith (1924), this would imply that ( a ) the stress across the rupture plane increases wit11 time, (b) imperfections in the single crystal or a t the grain boundaries coalesce until in time a nucleus of the right size has formed from which a crack call develop (Cottrell 1959), or (c) both processes occur together.
Cottrell states that for holes a t incoherent grain boundaries to grow, the following relation must be satisfied :
1146 C A N A D I A N JOURNAL O F PHYSICS. VOL. 38, 1960
where
p
is the tensile stress normal to the boundary, d is the surface energy of ice per unit area,r is the radius of the hole.
Figure 7 shoxx~s that for the duration of load associated with the observations, the compressive stress has to be greater than about 9 kg/cm2 for a crack to develop. Assuilliilg t h a t the shear stress has coillpletely relaxed a t the grain boundary, this ~vould give for
p
a value of about 9 lcg/cm2. The value o f 120 ergs/crnVor d (Skapslti et al. 1957) gives, for the critical radius, r = 2.7 X 1 0 4 cm. This value for r is a little sinaller than that used by Cottrell in calculations of the critical tensionp
for metals.Figure 4 shows t h a t the transient portion of the creep-time curve occurs during the period when the cracking is maxin~um. Glen (1955) has attributed this transient stage, and the coildition of an increasing creep rate with time, to recrystallization. In the present experiments it is apparent that the forination of cracks and the resulting disruption of the lateral constraillt on the grains must inalce a significant contribution to the observed creep 1-ate. The increasing creep rate with time a t the start of the test would support the thesis t h a t the tensile stress concentration across planes, such as A-A in Fig. 9, tencis to increase with time. The forillatioil of a craclc would relieve the tensile stresses locally and thus change the stress distribution. This change in stress distribu- tion would tend t o decrease the creep rate of the grains involved. I t would appear that under the conditions of the present experiments, during the first few illinutes at least, Andrade's law for creep is not obeyed.
Steineinann (19.54) gives evidence of the recrystallization of ice during the creep process. The ice used in his experiments had a granular rather than a columnar structure. I t is possible t h a t for coillpressive stresses less than about '3 lig/cm2 a t a temperature of - 10" C , creep and recrystallization of the grains ensures that concentrntions of stress and imperfections will not develop t o the magnitude necessar)i for the iilitiation of a craclc.
Although the evidence indicates that it is the grain boundaries that coiltrol the formation of the craclcs and the direction of the creep of multigrained ice, the possible influence of the easy slip direction, which tends to be parallel to the direction of the grain boundaries because of the bias in the crystallographic , orientation, callnot be ruled out. This bias may certainly have been a con- tributing factor to the lack of creep in the direction of the long axis of the grains. I t would also contribute t o the ability of each grain to deform under the constraints imposed b17 its neighbors.
Each time a craclt fonns, the internal structure of the ice is altered. In the present situation it would appear that wl~en enough cracks form, the ability of the ice t o ~iithstaild shear stresses is lowered to the extent that large movements accompanied by extensive crack formation occur along preferred planes in which the shear stress is a maximum. When this condition is reached the ice can be considered t o have failed. T h e cracking associated with the planes of shear failure is responsible for the high cracking rate observed after the first $ hour for those test pieces that showed a continually
GOLD: C R A C K I S G A C T I V I T Y I N ICE 1147
increasing creep rate with tinne. I t is probable that, if the tests a t loxver stress had been continued long enough, failure along the planes of maximum shear would have developed in these cases also, resulting in a sudden increase in the craclti~ng rate and a corresponding increase in the creep rate si~nilar to that observed in concrete by Riisch (1959).
Because of the movement that occurs a t the planes of craclting in Fig. i c
and 7d, the creep measured by an extensometer similar to that used would depend on the location a t which it is mounted. An obvious example of this is curve A in Fig. 3. I t was also observed t h a t if the craclting tended to occur on one side of the test piece, tlne creep would be greater on that side, t h a t is, the test piece would develop a bow. These factors are responsible in part for the irregular dependence of the creep on the applied stress as seen in Fig. 3. Even so, the observed dependence of the creep rate on the stress does agree well with the dependence found by Steinemann (1951) for granular ice.
CONCLUSIONS
The purpose of these observations was to investigate, a t one temperature and under constant compressive load, the craclting that occurs in ice during creep. In particular, it was desired to investigate the sudden transition in the creep-time curve that had been reported earlier and to see if this transition was in some \yay related to the internal craclting. From the present observa- tions tlne follo\ving conclusions are drawn :
(1) During creep under uniaxial compressive stress greater than about 9 lig/cm2 applied perpendicular to the grain boundaries of ice a t -10' C,
internal craclts form in the ice. The rate of formation of these craclts depends on the time and on the magnitude of the stress. For stresses beloxv about 16 kg/cm2, this rate goes through a maxi~num within the first hour after the application of the load and then decreases. The craclts tend to be long and narrow with their plane parallel to the direction of the grain boundaries and to the applied stress.
(2) T h e formation of these craclts is due to a tensile stress which is developed perpendicular to the applied stress because of the relaxation of shear stresses a t the grain boundaries.
(3) T h e transient portion of the creep-time curve is due, in part, to the formation of internal craclts.
(4) The formation of internal craclts wealtens the structure until a condi- tion is attained where the specimen will fail along the planes of maximu~n shear.
(5) Because of the logarithinic dependence of the rate of craclting on the stress, this conditioi~ is attained very rapidly a t stresses of about 16 ltg/cin2 and is respolnsible for the sudden change in the character of the creep-time curve that is observed in this stress range.
(6) Once failure begins along the planes of rnaxinnum shear the craclting activity greatly increases, the craclts forming primarily i11 the failure plane.
CANADIAN JOURNAL O F PHYSICS. VOL. 38. 1960
ACKNOWLEDGMENTS
The author acliilowledges with gratitude the assistance of R. Wallace in obtaining the observations that forni the basis of this paper. This paper is a contribution from the National Research Council of Canada, Division of Building Research, and is published with the approval of the Director.
R E F E R E N C E S BRIDGMAN, P. W. 1949. J. Appl. Phys. 20, 1241.
BROWN, E. 1926. Experiments on strength of ice, St. Lawrence Waterway Project, Report of Joint Board of Engineers, Appendix F , 423-453.
COTTKELL, A. H. 1959. Theoretical aspects of fracture. 171 Fracture (The Technology Press of Massachusetts Institute of Technology a n d John Wiley & Sons, Inc., New York). GLEN, J. IV. 1955: Proc. Roy. Soc. A, 228, 519.
1958. P1111. Mag. Suppl. 7, 254.
GOLD, L. W. 1958. Can.'J. Phys. 36, 1265.
GKIFFITH, A. A. 1924. Proc. Intern. Congr. rlppl. A~Iech., 1st Congr., 55-63. Delft, 1924. HIGUCHI, I<. 1958. Acta Met. 6, 636.
HILLIG, W. B. 1958. T h e kinetics of freezing of ice in the direction perpendicular t o the basal plane. I n Groivth and perfection of crystals (John Wiley & Sons, Inc., New York). J o x s s , R. 1952. Brit. J . Appl. Phys. 3, 229.
OBEKT, L. a n d DUVALL, W. 1945. hlicroseis~nic method of predicting rock failure in under- ground mining. P a r t I . General method (U.S. Departlnent of Interior, Bureau of Mines, R I 3797).
RUSCH, H. vow. 1959. Zenlerlt-Icalk-Gips, 12, 1.
SUPSKI, A., BILLUPS, R., and ROONEY, A. 1957. J. Chem. Phys. 26, 1350.
STEINEMANN, S. 1954. Flow and recrystallization of ice. IH International Union of Geodesy
and Geophysics. International Association of Scientific Hydrology, Rome general assembly, 'Tome IV, pp. 449-462.