Crushed Rock Thermal Energy Storage & Nuclear Technology:
Option Space & Economic Impacts
by
Nathaniel Ross McLauchlan
B.S., Chemistry, United States Naval Academy, 2016 Submitted to the Institute for Data, Systems, and Society &
the Department of Nuclear Science and Engineering in partial fulfillment of the requirements for the degrees
of
Master of Science in Technology and Policy and Master of Science in Nuclear Science and Engineering
at the
MASSACHUSETTS INSTITUTE OF TECHNOLOGY June 2018
© Massachusetts Institute of Technology 2018. All rights reserved.
Author . . . . . . Institute for Data, Systems, and Society Department of Nuclear Science and Engineering May 11, 2018 Certified by . . . . . . . . . . . . Charles W. Forsberg Principal Research Scientist of Nuclear Science and Engineering Thesis Supervisor Certified by . . . . Michael J. Driscoll Professor Emeritus of Nuclear Science and Engineering Thesis Reader Accepted by . . .
Munther Dahleh William A. Coolidge Professor of Electrical Engineering & Computer Science Director, Institute for Data, Systems, and Society Accepted by . . .
Ju Li Battelle Energy Alliance Professor of Nuclear Science and Engineering
Crushed Rock Thermal Energy Storage & Nuclear Technology:
Option Space & Economic Impacts
by
Nathaniel Ross McLauchlan
Submitted to the Institute for Data, Systems, and Society & the Department of Nuclear Science and Engineering in partial fulfillment of the requirements for the degrees
of
Master of Science in Technology and Policy and Master of Science in Nuclear Science and Engineering
Abstract
Increasing amounts of intermittent renewables have led to zero and negative priced electricity at times of peak wind and solar production. The volatility added to the grid by renewables and low prices at peak production create a demand for flexible energy supply and present an opportunity for energy arbitrage. Nuclear reactors in the United States are inflexible when compared to fossil generators, and batteries may store energy at peak renewable production, albeit at a high capital cost. Thermal energy storage coupled to nuclear reactors may both increase nuclear flexibility and capitalize on price volatility, benefitting the economics for the struggling nuclear industry. This research maps the option space for constructing a crushed rock thermal energy storage (TES) system coupled to a light water reactor and employs a modification of the GenX capacity expansion model to evaluate the economic. Historic demand and renewable resource availability from ERCOT were used to illustrate the benefit of crushed rock TES with an increasingly restrictive CO2 emission constraint. Parametric variations were used to address uncertainty
in performance estimates. Crushed rock TES was found to be beneficial under favorable conditions, reducing the average price of electricity from $81/kWh (without TES) to $73/kWh (with TES) at a system marginal cost of $5/kWh-heat and emissions constraint of 100 g CO2/kWh-electric, a nearly 10X reduction
of current emissions. Unfavorable conditions resulted in a price reduction from $81/kWh to $78/kWh with the same cost estimates and carbon constraint. The investment cost of enabling the ability for nuclear generation to couple to crushed rock TES was also found to significantly affect the system’s favorability and effect on electricity prices.
Thesis Supervisor: Charles W. Forsberg
Title: Principal Research Scientist of Nuclear Science and Engineering Thesis Reader: Michael J. Driscoll
Acknowledgements
First, I would like to thank everyone whose teaching and mentorship contributed directly to this work. This thesis would not have been possible without the insight and feedback of my thesis supervisor, Dr. Charles Forsberg, and reader, Professor Michael Driscoll. Thank you for broadening my horizons and your expert advice throughout this process. To other members of the NSE faculty, particularly Professor Jacopo Buongiorno, thank you for cultivating my interest and enriching my knowledge in nuclear science and engineering. I am also indebted to Nestor Sepulveda, for the hours of mentorship, wisdom, support, and most of all, patience.
To the TPP administration, particularly Dr. Frank Field, Ed Ballo, and Barbara
DeLaBarre. You three are at the heart of TPP, and have always provided support, kindness, and candy when needed. TPP is a family because of you, and I am leaving MIT a better person for having known you all. To my TPP friends and classmates, I have learned so much from you all, and am excited to see how you will change the world.
Of course, I could not have completed this work without those who supported my path to MIT and funded my studies throughout. To the Navy for allowing me to pursue my graduate studies, to the staff at Lincoln Labs who took a bet on me and awarded me the Lincoln
Laboratory Military Fellowship, namely John Kuconis and Dr. Jonathan Pitts, and to my mentors at Lincoln Laboratory, especially Dr. Brian Lee, thank you. I would also like to thank all of my mentors throughout the years who taught me the value of hard work and set me on this path, specifically John Sperry and Paul Schreiner. You both set the standard for the leader and officer I hope to be.
Lastly, I would like to thank my parents, Theresa Walters and Robert McLauchlan, and my siblings, Connor, Amelia, and Kate. You all inspire me more than you know.
Disclaimer: Nathaniel McLauchlan is an active duty Officer in the U.S. Navy. Any views, opinions, assumptions, or conclusions expressed in this work are those of the author and do not reflect the official policy or position of any agency of the U.S. government. As well, the author is responsible for any errors or deficiencies contained in this work.
Table of Contents Abstract ... 3 Acknowledgements ... 4 Table of Contents ... 5 List of Figures ... 7 List of Tables ... 9 1. Introduction ... 11
1.1 Changing Energy Markets ... 11
1.2 Energy Storage and Crushed Rock ... 12
1.3 Structure of the Thesis ... 14
2. Literature Review ... 15
2. 1 Evolving Electricity Markets ... 15
2.1.1 Electricity, Capacity, and Auxiliary Services Markets ... 15
2.2 Drivers towards a low-carbon energy grid ... 17
2.2.1 Changing supply and demand side technologies ... 17
2.2.2 Policies Promoting a Low Carbon Energy Grid ... 19
2.3 Economic Prospects for Nuclear Energy Today ... 20
2. 4 Energy Storage ... 22
2.4.1 Utility of Storage Technologies ... 22
2.4.2 Examples of Storage Technologies ... 24
2.5 Crushed Rock Thermal Energy Storage ... 27
2.5.1 Related Work ... 29
2.5.2 Considerations for Coupling Crushed Rock TES to Nuclear Reactors ... 33
3. Engineering Modeling and Option Space Estimations ... 36
3. 1 Nomenclature ... 37
3.2.1 Pressure Drops ... 38
3.2.2 Heat Transfer ... 39
3.3 Correlations for Modeling Flow in Irregular Rock Beds ... 40
3.3.1 Correlations for Friction Factors in Rock Beds ... 40
3.3.2 Correlations for Heat Transfer Coefficients in Rock Beds ... 41
3.4 Specific Considerations for Crushed Rock TES ... 41
3.5.1 Thermal Losses at the Walls ... 42
3.5.4 Sizing Energy Storage ... 49
3.5.5 Estimating the Temperature Front ... 53
3.6 Future Work for Engineering Analysis ... 54
4. Economic Modeling ... 56
4.1 Common Electricity Market Models ... 56
4.2 GenX Formulation ... 56
4.3 Modeling Crushed Rock Heat Storage with GenX ... 58
4.3.1 System-Level Model ... 58
4.3.2 LWR Base Case Formulation ... 60
4.3.3 LWR with Crushed Rock Thermal Storage Formulation... 62
4.4 Model Input Estimates ... 65
4.4.1 Parameter Estimates for Existing Technologies ... 65
4.4.2 Parameter Estimates for Crushed Rock Thermal Energy Storage ... 67
4.5 Experimental Design ... 68
5. Results and Discussion ... 70
5.1 Base Case Investments ... 70
5.2 Favorable TES Results ... 71
5.3 Unfavorable TES Scenario Investments ... 79
5.4 Charging and Storage Level Samples ... 82
5.5 Average Prices ... 84
5.6 Results with $500/kW Cost for Crushed Rock Capability ... 86
6. Conclusion ... 90
6.1 Policy Matters ... 90
6.2 Future Work ... 90
Appendix A – Engineering Analysis MATLAB Code ... 92
A.1 Calculating Frictional Pressure Drop ... 92
A.2 Time to charge ... 94
A.3 Heat Deposited from Air as a Function of mass flux ... 95
A.4 Energy Stored at Varying Temperatures ... 97
A.5 Calculating Pumping Power as in Barton ... 98
List of Figures
Figure 1 - Price Collapse at Times of High Solar Production in California (“California Solar Spike Leads
to Negative CAISO Real-Time Prices in March” 2017) ... 12
Figure 2 - Illustration of Technological Gap in Energy Storage ... 13
Figure 3 – Crushed Rock Thermal Energy Storage in Heating Mode ... 14
Figure 4 - Price Swings Due to Solar and Wind Energy... 16
Figure 5 - Cost Declines in Key Technologies, 2008-2014; MIT Utility of the Future ... 18
Figure 6 - Weekday Demand Load for EVs in CA ... 18
Figure 7: LCOE between Various Energy Technologies at Varying Discount Rates ... 21
Figure 8 - Chart of Energy Technology Attributes (U.S. Department of Energy 2017) ... 24
Figure 9 - LCOS for Various Technologies in Commercial and Industrial Application in $/MWhe ... 25
Figure 10 - Illustration of Technological Gap in Energy Storage ... 27
Figure 11 - Crushed Rock Thermal Energy Storage in Heating Mode ... 28
Figure 12 – Siemens Gamesa System (“Siemens Gamesa Starts Construction Of Heat Rock-Fill Storage For Wind Energy” 2017) ... 30
Figure 13 – STERG Group Experimental Rock Bed (Laubscher SolarPACES) ... 31
Figure 14 - Effect of Insulation Thickness on Ambient Energy Losses over 24 Hours for Crushed Rock TES System ... 43
Figure 15 - Pressure Drops as a Function of Mass Flux and Rock Diameter ... 45
Figure 16 - Illustration of Heat Transfer Simplification ... 46
Figure 17 - Time to Fully Charge as a Function of Mass Flux, Air Velocity, and Rock Bed Height ... 48
Figure 18 - Pump Work Ratio for Varying Rock Bed Heights and Charging Times D = 0.1 m ... 50
Figure 19 - Pump Work Ratio for Varying Rock Bed Heights and Charging Times D = 0.2 m ... 51
Figure 20 - Heat Deposition as Functions of Mass Flux and Flow Velocity ... 52
Figure 21 - Effect of Temperature Differential on Energy Stored ... 53
Figure 22 - System Level Illustration of Electricity Market without TES ... 57
Figure 23 - System Level Illustration of Electricity Market With FIRES ... 58
Figure 24 - System Level Illustration with Crushed Rock TES ... 59
Figure 25 - LWR Base Case Interaction with the Generation Pool ... 60
Figure 26 - LWR with TES Interaction with the Generation Pool ... 62
Figure 29 - Capacity Investment for Favorable Crushed Rock Parameters with Varying Marginal Cost ($1-100/kWh heat) ... 74 Figure 30 - Optimal Peaking Capacity for Favorable Scenarios ... 76 Figure 31 - Sizing TES Capacity [MWh] for Favorable Scenarios Relative to Installed LWR Capacity [MWh-heat/MWe] ... 77 Figure 32 - Total Capacity Investments for TES [MWh-heat] for Favorable Scenarios. ... 78 Figure 33 - Capacity Investment for Unfavorable Crushed Rock Parameters with Varying Marginal Cost ($1-100/kWh heat) ... 82 Figure 34 - Crushed Rock Charging and Discharging Profiles and Battery Comparison Over 75 Hour Window ... 83 Figure 35 - Effect of Crushed Rock TES Availability on Average Electricity Prices ... 85 Figure 36 - Capacity Investment with High Overnight Cost for Crushed Rock Availability ... 88 Figure 37 - Crushed Rock TES Effect on Average Prices with High Overnight Cost for Crushed Rock Availability ... 89
List of Tables
Table 1 – Nomenclature for Engineering Estimates ... 37
Table 2 - Parameters for LWR Base Case Formulation ... 61
Table 3 - Variables for LWR Base Case Scenario ... 61
Table 4 - Constraints for LWR Base Case Scenario ... 61
Table 5 - Parameters for LWR with Crushed Rock TES ... 63
Table 6 - Variables for LWR with Crushed Rock TES ... 63
Table 7 - Variables for LWR with Crushed Rock TES ... 64
Table 8 - Objective Cost Functions... 65
Table 9 – Annualized Cost Parameters for Generation Technologies ... 66
Table 10 - Cost Parameters for Generators ... 67
Table 11 - Performance Parameters for Generators ... 67
1. Introduction
1.1 Changing Energy Markets
Electricity markets have experienced significant changes in recent years due to both technological developments and a growing emphasis on mitigating anthropogenic climate change. These changes include an increasing shift towards renewable energy production in the forms of wind and solar generation, increased digitization of the energy grid, and a lessening reliance on fossil fuels. While such advancements are projected to limit future CO2 emissions, they may also
give rise to a fundamental change in the electricity grid that may require changes in energy policy.
Historically, energy production has centered on low-capital, high-fuel cost technologies; producing more energy simply required burning more carbon based fuels. In contrast, low carbon forms of energy production, wind, solar, and nuclear power, are high-capital, low-fuel cost technologies. In order for these technologies to remain as economically favorable over their lifetimes, they must operate at high capacity factors; operating nuclear reactors or wind farms at half capacity effectively doubles their lifetime cost. In addition to this phenomenon, renewables are intermittent, limiting their capability to match demand in real time. As a result, meeting energy demand with renewables absent energy storage technology, if possible, could require massive amounts of distributed renewable energy production.
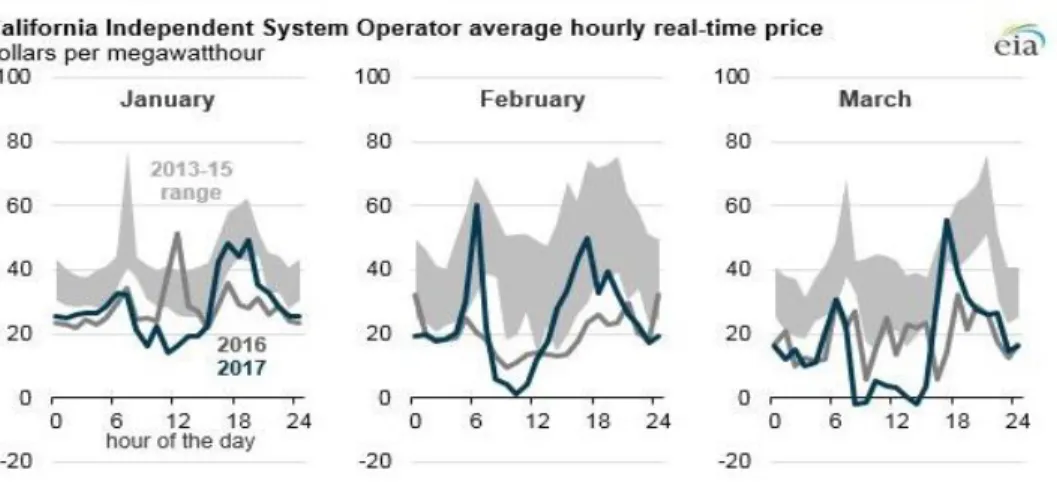
The economic consequences of extensive renewable energy production without adequate storage technology are severe. The price of electricity is set through a bidding system, whereby the price reflects the lowest bid offered to meet energy demand at a certain time. Currently, renewable generation plants offer bids at or near zero cost reflecting their marginal costs of production, while fossil fuel burning plants effectively set the cost of electricity. Absent the burning of fossil fuels, the market is dominated by high capital, low fuel cost energy, and the price of electricity approaches zero or even negative costs in the presence of subsidies for renewables. This revenue collapse described extensively in MIT’s Future of Solar Energy study eliminates the incentive for investment in renewable energy sources (“The Future of Solar Energy” 2015). Figure 1 below illustrates the effect that extensive investment in solar energy has had specifically on the price of energy in California, dropping to negative pricing during peak solar production. These negative prices reflect how much gas turbine operators are willing to pay the grid in order to remain
operating during peak solar production, enabling them to capitalize on high prices following the solar peak.
Figure 1 - Price Collapse at Times of High Solar Production in California (“California Solar Spike Leads to Negative CAISO Real-Time Prices in March” 2017)
In short, as fossil fuels are phased out in an effort to produce a greener energy grid, the price of energy will drop, removing incentives to invest in renewable energy. Implementing energy storage technology to stockpile energy at times of peak renewable production may provide a market for the excess energy, allowing the energy to be sold later at a non-zero price.
1.2 Energy Storage and Crushed Rock
Generally, energy storage technologies either store energy as work or heat. Work storage is favorable for technologies such as wind and solar photovoltaic (PV) generators whose primary output is electricity, while thermal storage is favorable for technologies such as nuclear reactors and concentrated solar thermal power systems which produce heat. The marginal cost of storing thermal energy is lower than the marginal cost of storing electric energy as work, due in large part to the complexity of the technology involved in storing energy as work, of which flywheels, pumped-hydro, and batteries are examples. In addition to avoiding revenue collapse, thermal energy storage when coupled to light water reactors (LWRs) has the added benefit of allowing nuclear reactors to provide essential reliability services (ESR) and run at maximum capacity, maintaining a low levelized cost of electricity (LCOE) for the high-capital-investment technology.
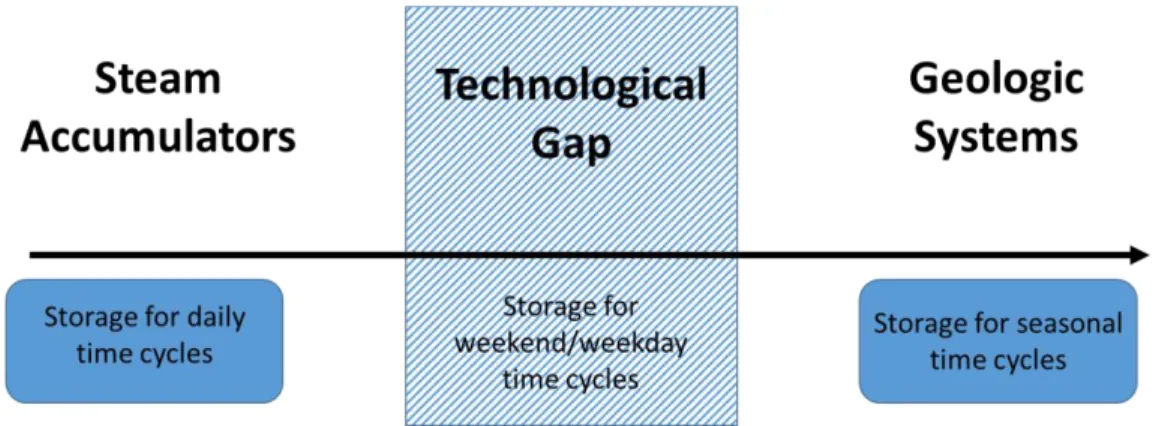
Various thermal storage technologies exist today, all with varying costs, energy capacities, and rate of energy charge and discharge. For instance, steam accumulators, are tanks of pressurized water that are heated by steam to their boiling point. When valves are opened, the water flashes to steam. Steam accumulators are used in some solar thermal plants for heat storage. This technology functions ideally as a buffer in steam plants, allowing for rapid charge and discharge cycles on the order of about a day’s worth of energy, but would not be suitable for larger storage capacities given a high marginal cost of energy storage.(Charles Forsberg 2017) Geothermal heat storage systems, on the other hand, may provide seasonal energy storage dependent on its location. Thus, while daily and potentially seasonal variations in energy demand may be met through these technologies, a significant technology gap exists on the scale of multi-day to weekly storage.
Figure 2 - Illustration of Technological Gap in Energy Storage
Crushed rock thermal energy storage (TES) may fill this technology gap, providing energy storage capacities of gigawatt-hours with faster response than geothermal heat storage systems and very limited geographic constraints.(C. W. . Forsberg, Curtis, and Stack 2017) The reasoning for the low marginal cost of energy storage with crushed rock thermal storage is intuitive: the primary material for the system is crushed rock, which is cheap, and the atmospheric operating conditions impose few expensive technological constraints. Figure 3 below illustrates the conceptual model of the crushed rock technology in the heating mode, whereby air is heated in a steam-air heat exchanger before being circulated through a large bed of crushed rock from top to bottom. Heat is recovered by reversing the flow.
Figure 3 – Crushed Rock Thermal Energy Storage in Heating Mode 1.3 Structure of the Thesis
This thesis aims to answer the principal question of to what extent may crushed rock
thermal energy storage provide flexibility in energy supply and mitigate revenue loss in a low-carbon energy grid primarily through the use of both engineering analysis and economic modeling.
Chapter 2 consists of a literature review on drivers towards a lower carbon energy grid and existing energy storage technologies. Chapters 3 and 4 present the engineering analysis and economic models used to evaluate the potential option space for crushed rock TES, respectively. Chapter 5 summarizes the results, and Chapter 6 presents the conclusions.
2. Literature Review
2. 1 Evolving Electricity Markets
The turn of the century has seen a paradigmatic shift away from low capital, high fuel cost, on-demand energy policy towards one centered on greener technologies, increased digitization of the energy grid, and increased consumer awareness of energy supplies. Innovative renewable energy technologies and public awareness of anthropogenic climate change are upending the millennia old energy policy of simply burning more carbon based fuel to meet increased energy demand. As an increasingly larger share of the energy demand is met by intermittent renewable energy resources, the ability to provide adequate energy on demand is jeopardized. If present trends towards increased renewable energy penetration are to continue, the market may have to adapt with regards to monetizing storage and capacity, and energy sources such as nuclear energy may transition from their role as base-load energy providers to one of variable suppliers. Energy policy and legislation will certainly play significant roles in shaping the future of energy, hopefully for the better. This section outlines the structure of existing electricity markets followed by a brief account of drivers towards a low carbon energy grid, and a case for the future of nuclear energy. 2.1.1 Electricity, Capacity, and Auxiliary Services Markets
A structural understanding of energy economics is required before discussing the drivers towards a low carbon energy grid. In short, the electricity market consists of the energy market, the capacity market, and the auxiliary services market.
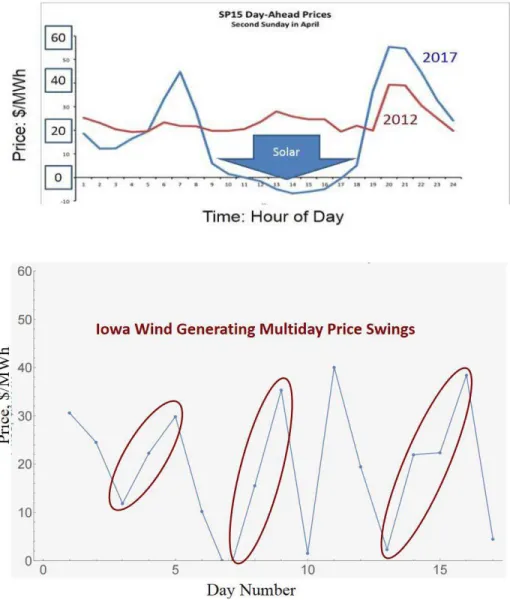
The energy market pays energy producers for the energy that is delivered to the grid, with the price set through a bidding system. That is, producers bid a day ahead for the price they are willing to sell energy for each hour. The highest price bid needed to meet demand for a given hour is then given to all producers who bid at or below that price. Nuclear and renewable energy producers typically bid at $0, reflecting their low marginal costs. Thus, as long as intermittent renewables and nuclear do not fully meet electricity demand, the price is set by fossil fuels and all producers benefit. Absent the need for fossil fuels to meet demand, revenue drops substantially. Bidding at the margin in this way leads to revenue collapse with varying amount of clean energy penetration ranging from just 15% of total electricity demand met by solar to approximately 70% of electricity demand met by nuclear for certain markets (Charles Forsberg et al. 2017). This price
collapse is illustrated in the figures below for both solar energy in California and wind energy in Iowa (Charles Forsberg et al. 2017). Note the difference in time scales with the wind cycle spanning days and solar cycle spanning hours.
Figure 4 - Price Swings Due to Solar and Wind Energy
The capacity market is structured around assuring capacity to meet demand and avoid blackouts. This market is nearly negligible with adequate on-demand energy to meet demand. With heavy renewable penetration, however, capacity can either be assured by bulk storage capacity or the use of fossil plants designed to meet demand on the few hours a year of very high price spikes at times of low renewable production (Charles Forsberg et al. 2017). Alternatively, the electricity grid can make capacity payments ($/kWe) to assure sufficient generating capacity to plants that
can assure supply when needed. Most electricity plants in the United States have chosen to provide capacity payments for assured electricity generation to avoid blackouts rather than see extreme electricity prices at times or higher risks of blackouts.
The auxiliary services market accounts for electricity grid services such as frequency control, maintaining spinning reserve, and black start. According to the 2017 DoE Staff Report on
Electricity Markets and Reliability, essential reliability services (ERS) will become increasing
important with increasing volatility in grid operations (U.S. Department of Energy 2017). Increasing amounts of variable renewable energy sources and distributed energy resources (DER) would increase volatility, and grid operators would face increasingly difficult challenges with respect to maintaining grid reliability and resilience. A few energy storage technologies may be able to provide these essential reliability services (ERS). However, the current revenue of these markets is only a few percent of the cost of electricity.
2.2 Drivers towards a low-carbon energy grid
2.2.1 Changing supply and demand side technologies
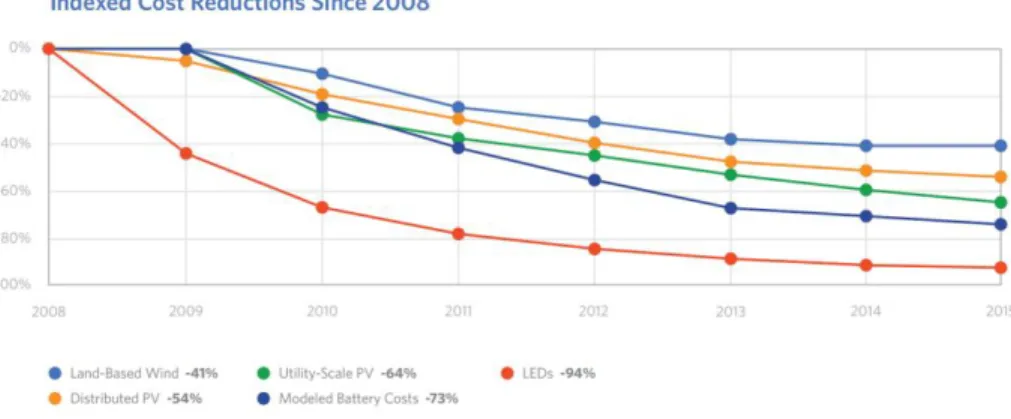
Both technologies producing and consuming energy have drastically progressed over the past few decades, both enabling more low-carbon energy production and increasing electric demand, particularly in the transportation sector. As shown in the 2016 MIT Energy Initiative’s
Utility of the Future report, the price of key technologies for the decarbonization of the energy grid
have dropped drastically since 2008, allowing in part for 213 terawatt-hours of added global renewable energy resources in 2015 alone (Ignacio Perez-Arriaga and Christopher Knittel 2016).
Figure 5 - Cost Declines in Key Technologies, 2008-2014; MIT Utility of the Future
In addition to decreasing renewable costs and increased renewable market penetration, the past few decades have seen changing energy demands, particularly in the transportation sector in the form of electric vehicles (EVs). EVs complicate energy market dynamics by functioning as both energy consumers and a distributed energy resource (Ignacio Perez-Arriaga and Christopher Knittel 2016). Increased electrification of the transport sector would complicate demand, likely increasing demand at night when EVs are charging and solar plants are not producing energy. A recent study by the California Energy Commission has shown that EV charging times are likely to peak with the rest of electricity demand in the early evening (“California Plug-In Electric Vehicle Infrastructure Projections: 2017-2025” 2018). Such a confluence presents a threat to grid stability and an opportunity for energy storage technologies to provide value. The figure below illustrates the projected load profile for EVs on a typical weekday in California.
2.2.2 Policies Promoting a Low Carbon Energy Grid
While the prices of green technologies have decreased substantially, the auto-cannibalistic effect of renewable energy deployment, whereby the marginal cost of energy decreases with increasing renewable energy penetration, cheap fossil fuels, and the inertia of carbon based energy production all oppose the transition to a low carbon energy grid. Fortunately, international, national, and state-level policies exist which in part offset these hindrances to a low-carbon grid. Yet, many existing policies disproportionately favor renewable resources to other low carbon energy sources, such as nuclear energy. Legislation holistically promoting greener energy and storage technologies could accelerate the transition to a low carbon energy grid, while mitigating revenue collapse and intermittency concerns at the same time. A few of the existing policies supporting the transition to a low carbon energy grid are presented below.
The Renewable Electricity Production Tax Credit (PTC), administered by the U.S. Internal
Revenue Service, is a federal policy which provides a tax credit to wind generators commencing construction by December 31, 2019 of $0.015 per kWh in 1993 dollars. With adjustment for inflation and the 20% step-down as required by the Consolidated Appropriations Act, 2016, the 2017 calendar year credit was equivalent to $0.019 per kWh (H.R. 2029 Consolidated
Appropriations Act 2016; “Renewable Electricity Production Tax Credit (PTC) | Department of
Energy” 2018). Policies such as the PTC certainly promote the expansion of wind energy, but do not benefit other clean sources of energy production, such as nuclear energy.
The Renewables Portfolio Standard (RPS) is an example of a state level policy.
California’s RPS has a target of 50% of retail sales derived from eligible renewable energy resources in 2030 and all subsequent years (“RPS Homepage” 2018). Nuclear energy is a low-carbon energy resource, but not a renewable energy resource, thus disqualifying it for the RPS.
The Paris Agreement or Paris Climate Accord is an example of an international agreement
intent on curbing carbon emissions worldwide. The Agreement serves as a formal recognition of anthropogenic climate change and a document of good will towards limiting climate change with benchmark goals based on degrees of temperature elevation above pre-industrial levels (“The Paris Agreement - Main Page” 2018). Currently 173 countries have ratified the agreement, with the U.S. State Department having officially announced its withdrawal (Reuters 2017). According to the
(“The U.S. Won’t Actually Leave the Paris Climate Deal Anytime Soon - The New York Times” 2017). Compared to the state and federal level policies in the United States, the Paris Agreement lacks enforcement measures or economic incentives, but rather relies on political capital between the countries. Countries that are party to the agreement are required to regularly report on their emissions and implemented strategies to further reduce carbon emissions, but policy enforcement and regulatory bodies are lacking.
2.3 Economic Prospects for Nuclear Energy Today
The largest barrier to nuclear energy other than fear of historic events and radiation is simply the economics of building new nuclear power plants. Nuclear power plants require huge capital costs that have only increased as a confluence of the intense regulatory state and increasing construction times for nuclear technology, specifically in the United States. Today, nuclear energy is not competitive with fossil fuels in the United States. Severe policies which monetize the negative externalities of CO2 emissions, such as a carbon tax, may upend this paradigm. The
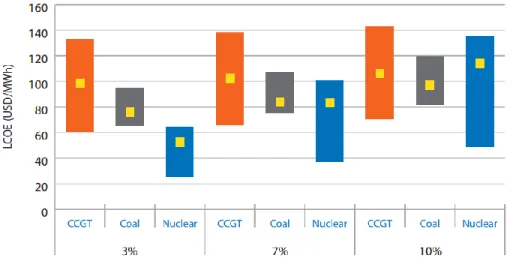
levelized cost of electricity (LCOE) “represents the constant and theoretical cost of every kWh produced by an energy generation system along its useful life,” and is often used to compare the costs of energy producing systems (Talavera et al. 2016). Through using the LCOE, energy systems with high initial capital investments, such as nuclear reactors, can be meaningfully compared to energy production systems with low initial capital requirements and high fuel costs, such as coal plants. Figure 1 below was taken from a report by the International Energy Agency (IEA), in which they demonstrated how economically competitive nuclear energy would be if the externality of CO2 emissions was properly captured at $30/ton of CO2 (Projected Costs of Generating Electricity, 2015).
Figure 7: LCOE between Various Energy Technologies at Varying Discount Rates
The key assumption in the figure above, the economic capture of the negative externality of CO2 emissions has yet to be realized, and even they may have a limited impact. A 2012 study
estimates that a $25 per ton of carbon dioxide tax in 2010 dollars would result in an LCOE for nuclear generation of 169% the cost of natural gas production instead of 202% without the carbon tax (Lucas W. Davis 2012). Unfortunately, even a carbon tax, which has been successfully implemented in Canada at $10 per ton in 2018 and is planned to rise to $50 per ton in 2022, may not make nuclear fission economically viable in the United States (Canada 2017).
Technological innovation, decreasing construction times, and emission constraining policies could make the economics favorable and provide routes for the expansion of nuclear generation. Emission caps in the interest of mitigating climate change could leave nuclear as one of a limited amount of technologies available to provide energy on demand. International cooperation and the support of developing countries, whose energy demands and thus emissions are expected to grow substantially, would likely be required in order for such policies to succeed. Garnering support across such a wide cross section of stakeholders would be difficult, and constraining policies would be economically inefficient. An alternative, technological innovation, may provide the answer for the future of nuclear.
Flexibility in power generation and the ability to provide ERS will become increasingly important as the penetration of renewable energy sources increases. Currently, nuclear reactors,
costs and the stresses induced by ramping reactor powers (U.S. Department of Energy 2017). At the same time, LWRs are the best understood nuclear technology in the United States, having benefited from decades of learning curves and a wealth of network information (Robin Cowan 1990). Coupling high-capital cost energy generation technologies, such as LWRs, to thermal energy storage (TES) could afford nuclear generation the flexibility in operation to provide ERS and become economically competitive in the presence of renewables. This would maximize electricity sales at times of highest prices (see Fig. 4).
2. 4 Energy Storage
2.4.1 Utility of Storage Technologies
Storage technologies have the ability to mitigate intermittency, match supply to demand, provide ERS, and smooth the energy output of nuclear generation in particular, which benefits from operating at its rated capacity. Recent advancements in both renewables and storage technologies have led to an increase in studies concerning the value of energy storage. A report from the Imperial College of London estimates, as expected, that value of energy storage technologies increases with increasing renewable energy penetration, potentially saving 10 billion pounds per year by 2050 in the United Kingdom (Goran Strbac et al. 2012). The report notes as well that the optimal composition of energy storage technologies differs according to regional availability of renewable energy resources, with bulk storage likely providing the most value in Scotland and distributed storage dominating the southern regions(Goran Strbac et al. 2012). Thus, for any given grid, determining the optimal energy storage portfolio and how to reward investors to appropriately reflect the value of storage are two of the most challenging questions which must be answered.
More recently, a group of researchers from the MIT Energy Initiative sought to answer the question of how different energy storage technologies should be compared (Braff, Mueller, and Trancik 2016). In short, the value of any energy storage system depends on their technical properties, such as their separate energy and power costs, intended applications, and regions and times at which they may operate. No single energy storage technology today is optimal across all dimensions, making any standalone comparison of energy storage systems both difficult and counterproductive. Thus, energy storage must be evaluated in concert with energy providers and consumers. Energy generators maximize efficiency by coupling to storage technologies based on
the form of energy stored, opting to store at an equal or higher energy quality. That is, photovoltaic solar (PV solar) and wind generation typically couple to electric storage systems such as batteries, while concentrated solar power (CSP) and nuclear generation could couple to thermal or electric storage systems.
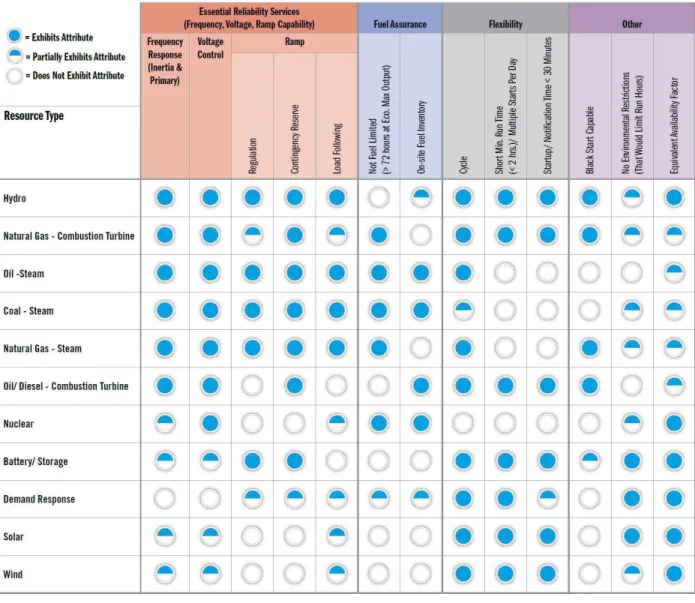
In the specific context of nuclear technology, energy storage could allow for a low-carbon combination of technologies which could provide other essential reliability services. The figure below from the 2017 DoE Staff Report on Electricity Markets and Reliability illustrates the reliability attributes provided by each major energy producing technology as well as batteries and storage. Clearly, no single technology provides every attribute, with hydro generation, which is geographically constrained, coming the closest. However, a combination of nuclear generation and energy storage would at least partially provide each attribute from frequency response to fuel assurance and flexibility.
Figure 8 - Chart of Energy Technology Attributes (U.S. Department of Energy 2017) 2.4.2 Examples of Storage Technologies
A wealth of energy storage options exists today, and the valuation of each technology is complex. A few examples of energy storage technologies, both electric and thermal, are listed below to elucidate the distinguishing features which determine the range of storage utility. Further information on the thermal storage options listed below may be found in the 2017 Light Water Reactor Heat Storage for Peak Power and Increased Revenue Workshop Proceedings (Charles Forsberg et al. 2017).
Lead acid batteries currently dominate the distributed energy storage installations globally,
but lithium-ion batteries are emerging as the favored form of electrical energy storage for electrical vehicles and other distributed applications coupled to renewable energy sources (Ignacio
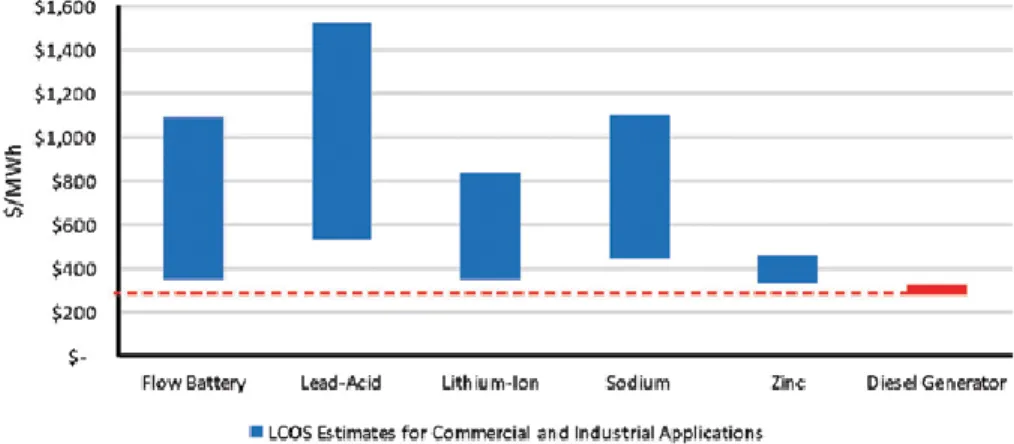
Perez-Arriaga and Christopher Knittel 2016). The cost of lithium-ion battery packs without accounting for electronics has reportedly dropped 14 percent between 2007 and 2014, and has been projected to possibly fall to below $100 per kilowatt-hour electric by 2022 (Ignacio Perez-Arriaga and Christopher Knittel 2016). While these price reductions represent a progression towards more affordable battery storage, they do not indicate that batteries storage will be cheaper than other forms of storage. Crushed rock TES, for example, has an estimated cost less than $10 per kilowatt-hour of thermal energy (C. W. Forsberg, Curtis, and Stack 2017). The figure below illustrates the competitive cost of lithium-ion batteries relative to other battery technologies with a diesel generator for comparison (Ignacio Perez-Arriaga and Christopher Knittel 2016).
Figure 9 - LCOS for Various Technologies in Commercial and Industrial Application in $/MWhe One major advantage of lithium-ion batteries is its energy density relative to other energy storage systems. The current U.S. Advanced Battery Consortium’s (USABC) target for electric vehicle battery pack density is 235 Wh/kg by 2020 (Li et al. 2017). Crushed rock TES may cost very little relative to lithium-ion batteries in regards to energy storage, but exhibits poor properties for energy storage in transportation. Lithium-ion batteries will very likely continue to grow in popularity, especially coupled to electric vehicles and distributed energy resources, such as roof mounted solar panels where minimizing weight or size is important, but may not be ideal for bulk energy storage, where these characteristics are not important.
Many TES options exist today, or are in development. Most of these technologies rely on storing energy and recovering energy by means of a phase change or through conduction and convection.
Steam accumulators store heat as high-temperature, high-pressure water, which is then
flashed to steam to power a turbine generator. Steam accumulators are well-suited for CSP designs where steam is generated in pipes located at the foci of parabolic or Fresnel reflectors (Charles Forsberg et al. 2017). Due to the highly pressurized vessels, steam accumulators may exhibit higher marginal energy storage costs relative to atmospheric systems, and are ideal for rapidly supplying energy. Thus, steam accumulators could increase the short term flexibility of a nuclear plant, but would not be an ideal technology for balancing weekly energy demand. This technology is deployed at some concentrated thermal solar power plants.
Heat storage (oil, salt, etc.) in secondary low-pressure media provides a lower pressure
alternative form of energy storage. This form of sensible heat storage involves heating a secondary fluid, and storing that fluid for later use. Many CSP plants use sensible heat storage in the form of molten salts, which can either be thermoclines or two-tank systems (Charles Forsberg et al. 2017). Sensible heat in solar power towers has been demonstrated up to the GWh scale. Westinghouse is developing a modular sensible heat TES system for nuclear reactors with each unit storing 1 MWh of electricity (Charles Forsberg et al. 2017). Westinghouse’s design utilizes oil as a heat transfer fluid, which is used to heat concrete as a primary heat storage solid.
Cryogenic liquid air storage stores energy by liquefying air, and recovers energy through
the evaporation and expansion of the fluid. If only warm cooling water from the nuclear plant or other low-temperature heat source is used, the estimated round-trip efficiency of a stand-alone system is around 60%, with potentially higher efficiency if steam is used to heat the air to higher temperatures (Charles Forsberg et al. 2017). In theory, cryogenic liquid air storage could couple to most reactor types.
Pressurized counter-current condensing-steam solid heat storage is similar to both steam
accumulators and sensible heat storage, only heat is stored in a packed bed of solid pebbles under pressure before transferring the energy to water as the working fluid. The system is charged through the injection of steam, which condenses to water at high temperature, and discharged by filling the packed bed from the bottom with liquid water. While a pressurized, packed-bed TES
may face relatively high capital costs, it should theoretically exhibit a very high round-trip efficiency (Charles Forsberg et al. 2017).
Nuclear geothermal heat storage may provide enough energy storage to balance seasonal
demand. In short, a nuclear geothermal heat storage system would consist of injecting hot water into a reservoir, heating the rock. Water can then be recirculated to recover the stored heat. While deep rock cannot be insulated, the storage size scales cubically, while the ambient losses to the surroundings scale squarely. Thus, as the scale increases, the ambient losses become decreasingly important. It is significant to note that geothermal heat storage cannot be built anywhere, but rather depends on site geology (Charles Forsberg et al. 2017). Thus, nuclear geothermal heat storage cannot balance energy demand everywhere.
Together these energy storage technologies present a wide option space for storing energy when coupled to a nuclear reactor, but leave a considerable technology gap in providing multi-day energy storage capacity. Geothermal energy storage may be able to meet seasonal and even weekly variations in demand, but requires suitable geological conditions.
Figure 10 - Illustration of Technological Gap in Energy Storage
2.5 Crushed Rock Thermal Energy Storage
Crushed rock TES coupled to a nuclear reactor may fill this technology gap without geological constraints, allowing balancing of multi-day renewable energy cycles as seen with wind
generation in Iowa. Below is a summary of the technological concept followed by existing work related to crushed rock TES.
A hot rock energy storage system [McLauchlan, Appendix C; Forsberg, 2017a] is similar in concept to a packed bed energy storage system except that it operates at atmospheric pressure. A volume of crushed rock with air ducts at the top and bottom is created (Fig. 3.11). To charge the system, air is heated using a steam-to-air heat exchanger delivering heat from the reactor, then the air is circulated through the crushed rock heating the rock. To discharge the system, the airflow is reversed, and cold air is circulated through the crushed rock. The discharged hot air can be used to (1) produce steam for electricity or industry or (2) hot air for collocated industrial furnaces to reduce natural gas consumption.
Figure 11 - Crushed Rock Thermal Energy Storage in Heating Mode
Heat storage systems are only charged at times of very low electricity prices. There is the option with this system to first heat the air with a steam-air heat exchanger and then further heat the air with electric resistance heating. LWR steam peak temperatures are near 300°C—well below the temperature limits of the crushed rock. Higher temperatures improve system efficiency and reduce costs. This can substantially boost rock temperatures and the efficiency of converting hot air back to electricity, and reduce capital costs. Near atmospheric operating conditions increase safety and reduce storage costs.
The economics may allow hourly, daily, and weekly storage. The longer storage times may be possible due to the very low incremental heat storage cost for crushed rock—far lower than any of the previous options that have been discussed. As such this technology can address the weekday weekend storage challenge where energy demand goes down on weekends but the production of wind, solar and nuclear does not if these facilities are operated at their full capacity. It is a storage technology that could potentially receive capacity payments for assured generation of electricity. With proper selection of rock for the expected peak temperatures, this storage system should be able to couple to most other reactors. The possible exception may be very high temperature reactors where finding suitable rock for such high temperatures may be difficult.
2.5.1 Related Work
Much of the engineering knowledge required to construct this large TES system has been developed through similar existing projects. A few companies and research groups have conducted work relating to Hot Rock TES to varying degrees, particularly in the development of thermal energy storage options for concentrated solar power.
Siemens Gamesa has begun a project to install hot rock heat storage in Germany to store
wind energy. Unlike Hot Rock TES coupled to nuclear reactors, the Siemens project plans to use resistance heaters to heat airflow into an 800 cubic meter pile of crushed rock (“Siemens Gamesa Starts Construction Of Heat Rock-Fill Storage For Wind Energy” 2017). While this storage system is designed to provide approximately 30 MWh of electricity, Hot Rock TES coupled to nuclear reactors may provide tens of gigawatt-hours of electricity. The figure below presents a schematic design for the Siemens project.
Figure 12 – Siemens Gamesa System (“Siemens Gamesa Starts Construction Of Heat Rock-Fill Storage For Wind Energy” 2017)
REDLEAF Resources Inc. is an oil shale company based in Utah, which is developing a
large test bed for recovering fuel from a large pile of oil shale(“Red Leaf Resources, Inc. |” 2017). Crushed shale is heated with hot gases to decompose the solid kerogen in the shale to liquid and gaseous fuels. Oil shale volume shrinks as the kerogen decomposes. While this testbed may be representative of the potential size of the Hot Rock TES coupled to nuclear reactors, significant design differences limit the utility of REDLEAF’s findings. The primary distinction comes in the form of thermal cycling and materials of interest. Whereas Hot Rock TES will cycle potentially hundreds of times a year, the REDLEAF oil shale capsule is designed for the sole purpose of recovering fuel and will be heated one time. Thus, the pile will shrink substantially in size throughout the thermal loading as solid kerogen is converted to oil, and the process will not bring light to the effects of repeated thermal loading on a Hot Rock TES using granite.
Crushed Rock Thermal Storage for Concentrated Solar Plants has gained traction as a field
Backstro¨m, and Dinter 2017; Jemmal, Zari, and Maaroufi 2016; Barton 2013; Ha¨nchen, Bru¨ckner, and Steinfeld 2011). Unlike photovoltaic (PV) solar energy, concentrated solar power (CSP) produces power primarily in the form of heat by concentrating sunlight. Thus, thermal energy storage is attractive to CSP systems for many of the same reasons as with nuclear.
Researchers at the University of Stellenbosch and Solar Thermal Energy Research Group (STERG) in South Africa have gone as far as to construct an experimental testbed of a rock bed TES system with which to validate their smaller scale experimental correlations for temperature distributions and pressure drops throughout the system. An image of the prototype testbed is pictured below.
Figure 13 – STERG Group Experimental Rock Bed (Laubscher SolarPACES)
Much of the work conducted by the STERG and other universities in Europe and Africa has focused on developing models for the heat transfer within rock beds using air as the working fluid and evaluating rock types for system usability.
Barton, a researcher in Australia extensively simulated the heat transfer within a rock bed, accounting for the variation of fluid density with temperature and critically comparing potential engineering designs. Results suggested that selection of a heat exchange coefficient between air and rock particles, which depends on the mass-flow rate of air rather than the fluid density, simplifies calculations. From an efficiency standpoint, it is beneficial to charge the rock bed with
downward airflow and discharge with upwards flow, rather than charge and discharge both via upward flow(Barton 2013). This comparative advantage increases with increasing bed depth and decreasing mass flow rates. Barton has determined that the storage efficiency for the two-way system can be as high as 95% (Barton 2013).
Hanchen et al. conducted a similar heat transfer analysis for a rock bed using crushed steatite (a compact form of talc) and charging to temperatures up to 800 °C with daily 6-hour charge and 6-hour discharge cycles. The authors found that the system reached a cyclic steady state after about twenty daily cycles. From an engineering perspective, the highest overall efficiency was found with the smallest rock particles. As well, there seems to be a trade-off between the capacity factor and overall efficiency with high air mass-flow rates and low storage heights leading to the high capacity factors but decreased overall efficiencies (Ha¨nchen, Bru¨ckner, and Steinfeld 2011).
Researchers from the Moroccan Foundation for Advanced Science Innovation and Research (MAScIR), Mohammed V University, and the University of Stellenbosch have conducted research on various rock types for use in rock bed thermal energy storage. Jemmal et al. extensively studied the characteristics of two varieties of Moroccan gneiss rock up to temperatures as high as 1000 °C. The authors concluded that both types of the rock have good thermal stability up to 550 °C (Jemmal, Zari, and Maaroufi 2016). Allen et al. determined that, in general, non-foliated rock is preferable to foliated rock, and that dolerite withstood the effects of thermal cycling better than granite (Allen et al. 2014). As well, the authors determined that some types of sedimentary rock may be suitable for use in a rock bed thermal energy storage system (Allen et al. 2014).
Swiss Adiabatic Compressed Air Storage represents another field of study with many
common concerns as for crushed rock TES. A pilot project in the Swiss Alps, contracted by the Swiss Federal Office of Energy, is assessing the suitability of caverns for compressed air storage with thermal energy storage to take advantage of renewable energy fueled energy arbitrage opportunities at low cost. One of the chief objectives of the pilot project is to understand the behavior of rock under cyclic charging and discharging operations as well as its suitability to house thermal energy storage (Giw Zanganeh 2016). The pilot plant currently exists, and the answers
that this project may provide are certainly relevant to crushed rock thermal energy storage. However, data gathered from the pilot plant are proprietary.
2.5.2 Considerations for Coupling Crushed Rock TES to Nuclear Reactors
Reactor Constraints
Nuclear reactors are a high capital, low variable cost energy producer. Operating reactors at the maximum operating capacity thus maximizes their lifetime value. That is, operating a reactor at half capacity effectively halves its lifetime value. Likewise, startup and shutdown processes increase operational costs, and should be avoided where possible. These constraints carry significant implications for coupling reactors to any form of thermal energy storage. Primarily, a minimum amount of steam must drive the primary steam turbine providing energy to the grid in order to avoid turbine startup and shutdown costs, as well as delays. This minimum value of steam to generation depends heavily on the specific reactor in question, but likely ranges from 30-70%, with new plants easily designed to operate at 30% of full load (Charles Forsberg et al. 2017). That is, the minimum value of steam generation is a product of design goals rather than technological constraints. Additionally, steam turbine efficiency decreases with decreasing loads. Thus, determining the optimal amount of steam flow to thermal energy storage systems will depend on the price of electricity, the efficiency of the turbine as a function of generation, and minimum generation constraints.
Reactor designs will also determine operating parameters such as the outlet temperature. Crushed rock TES may be suited for pressurized light water reactors (LWRs) as well as higher temperature reactors, as indicated by the range of thermal stability for rock types demonstrated by groups studying crushed rock TES for CSP. The rock type selected for use in crushed rock TES should depend on local availability to minimize costs and thermal stability for the expected temperature range and thermal cycling. Possible inlet temperatures to the crushed rock TES system could range from 300°C for LWRs to approximately 700°C for HGTRs and FHRs (Neil Todreas and Mujid Kazimi 2011).
When sending steam from the reactor to the hot rock, the steam is sent to a steam-air heat exchanger where the steam is condensed while air is heated. When going in the reverse direction there are two options. First, the steam-air heat exchanger may operate in reverse with the hot air producing excess steam from the reactor prior to the turbine hall. Second, a separate and customized steam air heat exchanger could be used. Design decisions will depend on priorities, namely capital costs and efficiencies. The first option incurs a lower capital cost than the second since the same equipment is used in both directions, but the second option allows for each exchanger to be optimized for its function. There would also be a significant size difference between the two exchangers, with the steam-air heat exchanger being roughly three times as large as the air-steam heat exchanger. This sizing difference would occur since large amounts of steam, perhaps as high as 70%, would be diverted to storage at times of low electricity prices, but peaking power from the thermal storage would be limited to 10-25% of the turbine capacity.
Energy Storage Independence and Integration
Energy storage systems may couple to nuclear reactors with varying degrees of independence. On one extreme, a storage system may couple to a completely independent turbine generator. Alternatively, the system could feed steam into the reactor turbine or feedwater heaters. The decision of whether to construct a separate turbine and generator or use existing machinery depends on existing equipment and desired electric output to the grid. Existing reactors may be able to increase the maximum electric output by 5-10% of the base-load power, whereas independent generators are not constrained to operate near base-load. Disadvantages to integrating storage systems with generators include limits to maximum peak power of approximately 10% above base-load power for existing turbines or 25% for new turbines, with an accompanying loss in turbine efficiency either at base-load or when peaking (Charles Forsberg et al. 2017). That is, a turbine optimized for output at 125% the rated capacity of a reactor will suffer an efficiency loss when operating at the reactor’s rated capacity.
Diverting Steam for Process Heat
Precedent exists for the feasibility of splitting steam from nuclear production for multiple purposes. In countries such as Russia, Switzerland and Canada, nuclear plants have long provided variable electricity to the grid and steam to industry or district heating. This has not been the custom in the United States. In 2005, Fort Calhoun Nuclear Power Plant owners investigated
diverting steam to supply process heat to Cargill for processing corn. The project involved cost analyses, engineering assessments, and conversations with the Nuclear Regulatory Commission (NRC), which concluded the diversion would have no significant impact on safety(Charles Forsberg et al. 2017).
Estimating the Cost of Turbine Halls
Data also exists for estimating the cost of constructing oversized turbine halls. A report from Idaho National Labs indicates that the capital costs, including labor, of a complete turbine hall in terms of 2006 costs amounts to roughly $500 per kilowatt of capacity (“Power Cycles for the Generation of Electricity from a Next Generation Nuclear Plant” 2010). Constructing a marginally larger turbine hall would likely cost hundreds of dollars per kilowatt of capacity, with most components remaining unchanged, save for the actual turbine and generator. The decision to feed heat from crushed rock TES to an existing turbine or feed water heater, expand an existing turbine, or construct a new generator entirely will depend on existing construction, the cost of turbine hall modifications, the cost of constructing a new turbine, and desired generator output.
3. Engineering Modeling and Option Space Estimations
Modeling technologies on the expected scale of the crushed rock TS system is crucial to demonstrating the viability of the concept prior to embarking on a costly engineering project. While economic models, which are further discussed in the following chapter, have the ability to illustrate economic competitiveness of various technologies, they rely heavily on technological parameters as well as capital and variable cost predictions, which are in turn validated through rigorous engineering analyses. Thus, the thermodynamic and economic models are closely linked in the evaluation of theoretical technologies and ultimately the decision whether or not to bring them to fruition. This chapter aims to estimate relevant parameters for the design of a crushed rock TES system, such as pressure drops and charging time, in order to outline the option space.
Prior to forming and presenting any model estimates, the driving motivations and potential biases must be considered. That is, models are by their very nature simplifications of complex, natural systems which are never truly closed, and model-makers have the ability to skew results through their choice of simplifications. Thus, as Naomi Oreskes, a Harvard Professor of the History of Science, has written: “models can be confirmed by the demonstration of agreement between observation and prediction, but confirmation is inherently partial” (Naomi Oreskes, Kristin Shrader-Frechette, and Kenneth Belitz 1994). For the purposes of this project, the thermodynamic model exists to provide insight to the technical limitations of the technology as well as order-of-magnitude cost estimates for various conditions. Simplifications made in the thermodynamic model presented in this thesis are recognized along with approximations as to how they may skew results. For example, neglecting conduction as a mode of heat transfer through the rock pile would result in an overestimate of the temperature of air extracted.
This chapter is organized into a sections on (1) the nomenclature used throughout the chapter; (2) general principles in modeling single-phase heat transfer in packed beds; (3) examples of experimentally vetted correlations for friction factors and heat transfer coefficients in irregular rock beds; (4) unique considerations for crushed rock TES borne out of system requirements; and (4) parametric estimates for a crushed rock TES system.
3. 1 Nomenclature
Table 1 below lists the nomenclature used throughout the chapter. The Biot number is a dimensionless quantity like the Reynolds and Prandtl numbers, but is less commonly used. In short, the Biot number represents the relative heat transfer resistances inside of and at the surface of a body. A Biot number much smaller than one allows for the assumption of uniform temperature within a body, whereas larger Biot numbers result in more complicated heat transfer problems.
Table 1 – Nomenclature for Engineering Estimates
Bi Biot number T Air temperature [°C]
cp Air specific heat capacity [J/kg K] t Time [s]
cR Particle specific heat capacity [J/kg K] Vp Volume of a particle, [m3] D Equivalent particle diameter [m] Vt Total bed volume [m3] Dv Volume equivalent Diameter [m] vs Superficial flow speed [m/s] h Surface area heat transfer coefficient [W/m2 K] α Void fraction
hv Volumetric heat transfer coefficient µ Air viscosity [kg/m s]
f Friction factor ρ Air density [kg/m3]
k Air thermal conductivity [W/m K] ρp Particle density [kg/m3] kp Particle thermal conductivity [W/m K] Δp Pressure drop [Pa]
H Height of the rock pile [m] Δt Time interval [s]
m Air mass flow rate [kg/s] Δx Segment length [m]
G Air mass flux [kg/m2 s] τ Time constant [s]
NTU Number of transfer units A Surface area [m2]
Nu Nusselt Number
Pr Prandtl number
3.2 Modeling Single Phase Flow in Packed Beds
Heat transfer and pressure drops of single phase flow in packed beds are well-established fields of study. Most simply, both heat transfer and pressure drops depend on the particle material, heat transfer fluid, flow parameters, and geometry of the system, but to varying degrees. For the purposes of engineering design, pressure drops set limits on minimum pumping power required to force flow, while heat transfer determines the thermodynamic efficiency and temperature gradient in storing and removing heat from a packed bed. Both pumping power, a driving parameter for capital costs, and thermodynamic efficiencies, which strongly affect turbine efficiencies following output from the system, are primary concerns for the viability of crushed rock TES.
3.2.1 Pressure Drops
Pressure drops in packed beds are due to both frictional interactions between the heat transfer fluid and the change in gravitational potential energy as shown below in Eq. 1:
∆𝑃𝑇𝑜𝑡𝑎𝑙 = ∆𝑃𝑓𝑟𝑖𝑐𝑡𝑖𝑜𝑛 + ∆𝑃𝑔𝑟𝑎𝑣𝑖𝑡𝑦+ ∆𝑃𝑓𝑜𝑟𝑚+ ∆𝑃𝑎𝑐𝑐𝑒𝑙𝑒𝑟𝑎𝑡𝑖𝑜𝑛 ( 1 ) The form term accounts for pressure losses due to flow formation at both the inlet and the outlet. The acceleration term accounts for pressure variations due to a change fluid density that occur with changes in temperature. The gravitational term depends on the height of the system and the density of the fluid, and thus accounts for buoyancy effects due to the temperature gradient effects on the fluid density. The pressure loss due to friction depends highly on characteristics of the individual particles and the aggregate packed bed including the shape, roughness, and void fraction. Many correlations exist for predicting the pressure loss due to friction, with the most popular being the semi-empirical Ergun equation (Andrei Koekemoer and Adam Luckos 2015):
∆𝑃𝑓𝑟 𝐿 = 150 (1−𝛼)2 𝛼2 𝜇𝑈 (𝜑𝑑𝑝)2+ 1.75 (1−𝛼) 𝛼2 𝜌𝑔𝑈2 𝜑𝑑𝑝 ( 2 ) While the Ergun equation is a well-known model, it was derived from lab experiments utilizing relatively small, spherical particles, and any deviations from the controlled experimental environment result in modeling inaccuracies when translated to real-world systems. For example, beds of rough particles have been shown to produce higher void fractions than beds of smooth particles, and irregular particle size may result in a void fraction gradient with lower porosity towards the bottom of a packed bed, which would significantly increase the pressure drop due to
friction. Ultimately, correlations are only useful to the extent that they have been experimentally verified with the relevant conditions of interest.
3.2.2 Heat Transfer
In addition to the pressure drops, a temperature-time profile must be known in order to estimate the heat removal rate for a fluid at a given mass flow rate. This temperature profile may be estimated using an approximation for a one dimensional system, whereby temperature varies by axial segments using the Effectiveness-NTU method. It is important to note that this estimation accounts only for heat transfer via convection and neglects radiation and conduction entirely (K. G. Allen, T.W. von Backstrom, and D.G. Kroger 2015, 2015). Neglecting radiation and conduction is appropriate due to the relatively small temperature gradient, which is expected to remain below 400 °C. The fluid temperature at each segment can be expressed as:
𝑇(𝑖+1) = 𝑇(𝑖)− (𝑇(𝑖)− 𝑇𝑝,𝑖)(1 − 𝑒−𝑁𝑇𝑈(
∆𝑥
𝐿)) ( 3 ) With T(i+1) representing the air temperature at a segment i+1, and Tp,i representing the rock
temperature at segment i. The number of transfer units (NTU) depends on the volumetric heat transfer coefficient (hv), mass flux (G), length of the particle bed, and specific heat capacity of the
heat transfer fluid (c). The volumetric heat transfer coefficient in turn depends on heat transfer coefficient (h), surface area of particles (ΣAi), void fraction, and total particle volume (ΣVp) as
follows:
ℎ𝑣 = ℎ(1 − 𝛼)∑ 𝑉∑ 𝐴𝑖
𝑝 ( 4 ) The temperature of the rock at the next time interval is then:
𝑇𝑝,𝑖+ = 𝑇𝑝,𝑖(1−2𝜏∆𝑡∆𝑥𝐿𝛽)+𝑇(𝑖)(∆𝑡𝜏 𝐿 ∆𝑥𝛽) 1+2𝜏∆𝑡∆𝑥𝐿𝛽 ( 5 ) With: 𝛽 = 1 − 𝑒−𝑁𝑇𝑈∗𝑥𝐿 and 𝜏 =𝑚𝑝𝑐𝑝 𝑚𝑐 ( 6 ), ( 7 )
Given the thermodynamic properties of the fluid and particle material, the void fraction in the particle bed and heat transfer coefficient must be established. The void fraction is a constant at a value between 0.3 and 0.45 for crushed rock, which depends on geometry of the rocks, and the heat transfer coefficient may be determined from an appropriate correlation for the Nusselt
3.3 Correlations for Modeling Flow in Irregular Rock Beds
3.3.1 Correlations for Friction Factors in Rock Beds
Absent the use of costly computational fluid dynamics (CFD) the construction of a thermodynamic model for crushed rock TES requires correlations validated with representative experimental testing. Fortunately, a research group from the University of Stellenbosch in South Africa has vetted various correlations for pressure drops and heat transfer in rock beds which are representative of crushed rock TES at a much smaller scale. Perhaps most importantly, the group determined that experimental results are required for predictions for pressure drop and the heat transfer coefficient to fall within 15% of the true value. Thus, the findings reported for the usability of various correlations should be considered heuristically as appropriate approximations at small scales may not apply at large scale.
Under isothermal conditions, a smooth sphere correlation valid from 10 < Re < 100000 consistently underestimates the friction factor for rock piles when compared to experimental results. Allen at al. have reported more accurate correlations for the friction factor of air at atmospheric pressure through crushed rock with both counter-current and cross-current flows respectively as (K. G. Allen, T.W. von Backstrom, and D.G. Kroger 2015, 2015):
𝑓𝑣 = ∆𝑝 𝐿(𝜌𝑣𝑠22 ) 𝛼3 (1−𝛼)𝐷𝑣 = 620 𝑅𝑒𝑣+ 13.7 𝑅𝑒𝑣0.08 and 𝑓𝑣 = ∆𝑝 𝐿(𝜌𝑣𝑠22 ) 𝛼3 (1−𝛼)𝐷𝑣 = 600 𝑅𝑒𝑣+ 12.3 𝑅𝑒𝑣0.08 ( 8 ),( 9 ) With the effective volumetric diameter defined as:
𝐷𝑣 = (𝜋6 [𝑛1∑𝑛 𝑉𝑝𝑖
𝑖=1 ])
1 3
( 10 ) And the Reynolds number defined as:
𝑅𝑒𝑣 = µ(1−𝛼)𝜌𝑣𝑠𝐷𝑣 ( 11 ) The dependence on flow direction, either counter-current or cross-current, suggests that in addition to the materials used, the process of constructing a crushed rock TES system can significantly affect performance.
3.3.2 Correlations for Heat Transfer Coefficients in Rock Beds
The results also suggest that, unlike the frictional pressure drop, the heat transfer does not depend strongly on particle shape and flow direction, but rather almost entirely on the thermodynamic properties of the packing material used. Allen et al. used various correlations such as one provided by Wakao et al. to determine the Nusselt number, and thus the heat transfer coefficient for the flow, where:
𝑁𝑢 =ℎ𝐷𝑘 = 2 + 1.1𝑅𝑒𝑝0.6𝑃𝑟1/3 and 𝑅𝑒
𝑝 =𝜌𝑣𝜇𝑠𝐷 ( 12 ), ( 13 ) This correlation, which is appropriate for 15 < Rep < 8500 tracked experimental data well
for a single charge with mass flux of 0.2 kg/m2s and temperatures circa 500 °C.
Barton and Hanchen et al. use the following correlation for the heat transfer coefficient in their calculations for air blown through a rock bed (Barton 2013; Ha¨nchen, Bru¨ckner, and Steinfeld 2011):
ℎ =6(1−𝛼)700 𝐺0.76𝑑0.24
( 14 ) The utility of these correlations is limited to conditions under which they were experimentally validated.
3.4 Specific Considerations for Crushed Rock TES
Of course, the small rock bed used to experimentally validate these correlations is not perfectly representative of a 30-meter-tall crushed rock pile running multiple cycles with significant latent periods between charging and discharging. The isothermal conditions used in determining the correlations presented do not account for the crushed rock TES system’s expected buoyancy effect due to the temperature gradient, and as a result underestimate the total pressure drop. As well, the friction factor was reported to increase over the course of multiple cycles and remain constant thereafter. This change in friction factor was likely due to the movement of small particles within the pile, effectively altering the void fraction throughout the pile.
Some deviations from the small scale experimentally determined correlations may, however, be anticipated and engineered against. For instance, Zanganeh et al. reported that the