CRUD RESISTANT FUEL CLADDING MATERIALS By
Ekaterina Paramonova
SUBMITTED TO THE DEPARTMENT OF NUCLEAR SCIENCE AND ENGINEERING
ARCHINES
MASSACHUSETTS INSf5 OF TECHNOLOGYJUL 162013
LIBRAIE
IN PARTIAL FULFILLMENT OF THE REQUIREMENTS FOR THE DEGREE OF BACHELOR OF SCIENCE IN NUCLEAR SCIENCE AND ENGINEERING
AT THE
MASSACHUSETTS INSTITUTE OF TECHNOLOGY JUNE 2013
Ekaterina Paramonova. All Rights Reserved.
The author hereby grants to MIT permission to reproduce and to distribute publicly paper and electronic copies of this thesis document in whole or in part.
Signature of Author: I
Department of Nucl r
Certified by:
Ekaterina Paramonova Science and Engineering May 17, 2013
Dr. Michael Short
Research Scientist at the Department of Nuclear Science and Engineering Thesis Supervisor
Accepted by:
#rofessor Dennis Whyte Professor of Nuclear Science and Engineering Chairman, NSE Committee for Undergraduate Students
CRUD RESISTANT FUEL CLADDING MATERIALS By
Ekaterina Paramonova
Submitted to the Department of Nuclear Science and Engineering on May 17, 2013 In Partial Fulfillment of the Requirements for the Degree of
Bachelor of Science in Nuclear Science and Engineering
ABSTRACT
CRUD is a term commonly used to describe deposited corrosion products that form on the surface of fuel cladding rods during the operation of Pressurized Water Reactors (PWR). CRUD has deleterious effects on reactor operation and currently, there is no effective way to mitigate its formation. The Electric Power Research Institute (EPRI) CRUD Resistant Fuel Cladding project has the objective to study the effect of different surface modifications of Zircaloy cladding on the formation of CRUD, and ultimately minimize its effects. This modification will alter the surface chemistry and therefore the CRUD formation rate. The objective of this study was to construct a pool boiling facility at atmospheric pressure and sub-cooled boiling conditions, and test a series
of samples in simulated PWR water with a high concentration of nanoparticulate CRUD
precursors. After testing, ZrC was the only material out of six that did not develop dark, circular spots, which are hypothesized to be the beginnings of CRUD boiling chimneys. Further testing will be needed to confirm that it is indeed more CRUD resistant, even under realistic PWR
conditions in a parallel testing facility. Thesis Supervisor: Dr. Michael Short
Introduction
Nuclear reactors operate at extreme pressures, temperatures, and its materials are subject to intense radiation fields. In order to be economically competitive with other energy sources, like natural gas, oil, and coal, nuclear reactors need to perform reliably, minimizing unforeseen issues that cause a power de-rating or unscheduled shutdown. A light water reactor (LWR) must operate at a stable, high power level, undergo minimal material corrosion, release minimal radioactivity to its water coolant, and incur low maintenance costs. One of the problems preventing reliable operation at many existing plants is the formation of CRUD.
CRUD Characteristics and its Origin
CRUD is a commonly used term in the nuclear industry that stands for Chalk River Unidentified Deposits [25], after the location of its first discovery. CRUD refers to the build-up of porous corrosion deposits on fuel rods. CRUD in PWRs is typically comprised of black or grey nanoscale particles that attach to the fuel rod surface. It is composed of Fe, Ni, Cr, and Co oxides from primary system metals that dissolve or are eroded into the primary coolant and deposit on the fuel elements [10].
Effects of CRUD on the Fuel and Nuclear Plant
CRUD causes several significant problems at power plants. It sometimes insulates the fuel rods, altering the heat removal capabilities [4]. CRUD also alters the neutron flux in the reactor due to the boron that it absorbs, which leads to Axial Offset Anomalies (AOA) in the power level. It also poses safety concerns to the plant workers and maintenance workers due to radioactivity buildup on the reactor internals [19]. To minimize these problems, either the
amount of CRUD corrosion products in the coolant should be minimized or its deposition should be made unfavorable [3].
Also, CRUD does not deposit uniformly. It tends to deposit closer to the top of the core, resulting in an AOA [3]. AOA leads to difficulties in operating the plant, unpredicted burnup patterns, and may force the plant to operate at lower power [6]. CRUD may remain attached even after regular fuel cleaning after shutdown, and sometimes remains on the fuel rods for the next fuel cycle [9].
Gaps in Knowledge Today
Although problems associated with CRUD have existed for years, there are no adequate solutions to reliably prevent its growth. Little is known about why it deposits on a
microscopic/atomistic level, or why it is sometimes so adhesive. The Electric Power Research Institute (EPRI), an organization working to solve problems at existing nuclear plants, has identified CRUD as a key problem for PWR operation. Some sources say CRUD is a result of
growing bubble and concentrates the left over solutes at the bubble's edges [9]. Other sources say that it is related to the surface energy of the fuel rod surface and the adsorption energy of CRUD, which leads to the first layer bonding [26].
In laboratory settings, CRUD deposition has been well studied in non-irradiated settings where the pH, heat flux, flow rate, and particle type and size could be controlled [5]. However, not much research has been done under irradiation, which can lead to different material and deposition behaviors [3]. Some experimental results also do not fully replicate the
thermodynamic conditions of the reactor, which are critical in CRUD formation. A Possible Solution
One approach to slowing or stopping CRUD growth could be to change the surface composition of the fuel rods. By changing the surface chemistry of the fuel rods themselves, it could be made more difficult for initial CRUD adsorption to take place. An emphasis is placed on surface chemistry changes that are compatible with Zr-based fuel cladding; therefore, several promising candidates are ZrN, ZrC, and ZrB2, all of which can be imposed on the existing ZrO2
cladding surface via an industrially scalable process. Other potential solutions include materials like A1203, MgO, and diamond like carbon (DLC), which have extreme adsorption and surface
energies [21]. However, it is not currently known which material coatings or surface
modifications possess the best combination of CRUD resistance and manufacturability. The surface energies for various materials can be seen in Table 1.
Surface Ni-ion Adsorption
Energy [J/m2 Energy (eV)
ZrO2 (111 and monoclinic) 0.08(111) 2.45(111)
ZrC (001, 111) 0.16(001) 3.71(001)
ZrN (001) 0.22 3.29
ZrB2
TiO 2 (110) 0.35 4.42
Diamond Like Carbon (DLC) 0.04
MgO (001) 1.19 1.45
Si02 (001) --
--A1203 (0001) 2.51 1.76
Table 1: Samples to be tested and their properties [Short]. Calculations performed by Wenbin Li (MIT) and Xiaofeng Qian (MIT).
This study attempts to simulate the formation of CRUD on candidate materials in a pool boiling facility at atmospheric pressure, sub-cooled boiling temperatures, and simulated PWR water chemistry. After some time of boiling at these conditions, the samples were removed. CRUD sites were analyzed with Scanning Electron Microscopy (SEM) to visually understand the characteristics of the CRUD-surface bond. Later, Atomic Force Microscopy (AFM) will be used
in force spectroscopy mode to directly measure the strength of the CRUD bond to the sample surface.
So far, zirconium carbide, ZrC, has shown no CRUD particle bonding to the surface when observed under an SEM. Of all of the materials tested, only ZrC did not form proto-boiling chimneys. Further long-term testing is required to confirm this behavior, and correlate it with AFM force spectroscopy measurements.
Background
Where and How CRUD Forms
CRUD originates as corrosion products from reactor internals, mainly in the steam generator [6]. Steam generators typically comprise about 80% of the reactor's internal surface area, thus most CRUD is principally formed from oxides originating from the steam generator. Most PWR internal tubes are made of stainless steel or nickel-based alloys, and generate a passive oxide layer that serves to lessen corrosion. However, during the course of the reactor life, the metals undergo slow corrosion through dissolution, activation, and transport. The corroded particles released from this process are the precursors for CRUD formation [19].
The CRUD particles are picked up by the coolant and brought into the core, where they deposit on the fuel rods. In PWRs, CRUD tends to deposit at the top of the core where more sub-cooled boiling takes place.
CRUD Phases and Composition
CRUD is mostly ions or solid particles of nickel, iron, and chromium oxides that form nonstoichiometric nickel ferrite, nickel metal, and nickel oxide [3]. They sometimes form a
dense, highly-adhesive inner layer and a porous outer layer on the fuel rods. Nickel and iron may also activate to form radionuclides, like 58Cr and 5 8Co, resulting in the increased radioactivity
levels in the reactor.
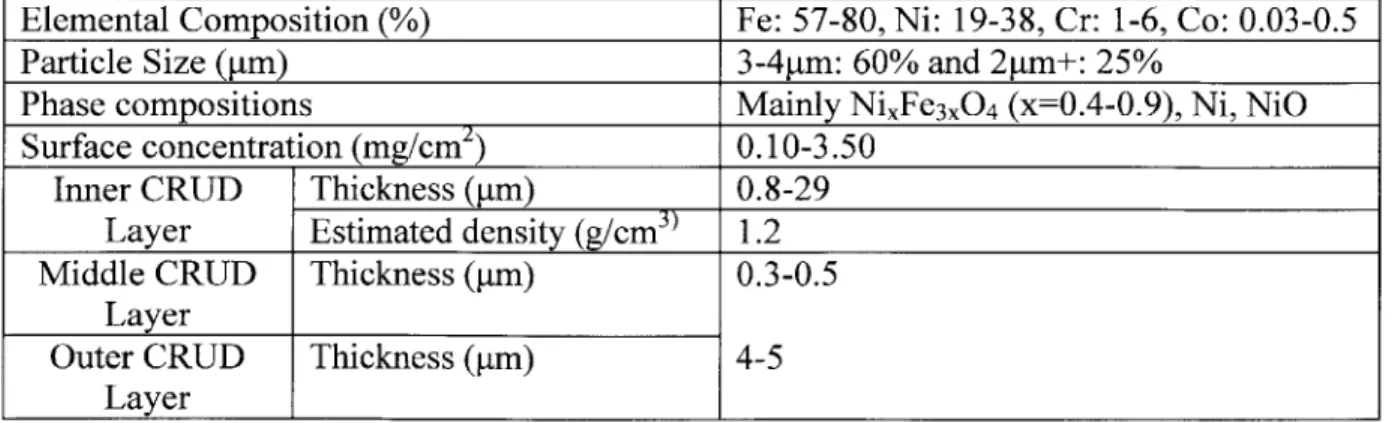
Table 1 and Figures 1-5 give the characteristics of typical CRUD composition, size, and structure. In most cases, CRUD is composed mainly of nickel and iron oxides, with zinc oxides if zinc is present in the coolant, and chromium oxides if significant Cr levels are present in the steam generator alloy.
Elemental Composition (%) Fe: 57-80, Ni: 19-38, Cr: 1-6, Co: 0.03-0.5
Particle Size (tm) 3-4pm: 60% and 2pm+: 25%
Phase compositions Mainly NixFe3xO4 (x=0.4-0.9), Ni, NiO
Surface concentration (mg/cm2) 0.10-3.50
Inner CRUD Thickness (pm) 0.8-29 Layer Estimated density (g/cm3) 1.2 Middle CRUD Thickness (tm) 0.3-0.5
Layer
Outer CRUD Thickness ([tm) 4-5 Layer
100 pm 100 pm
I m
Figure 1: CRUD sample particle at various magnifications [20].
Ii
I
4dI
0IM
.E.. I l.. 0I - soFigure 2: CRUD sample size distribution (a) and TEM photo of Pt (1-10 nm) particles attached to the CRUD particle (b) [8].
EqLwalm-A daux-Ler s)nm)
U)\I
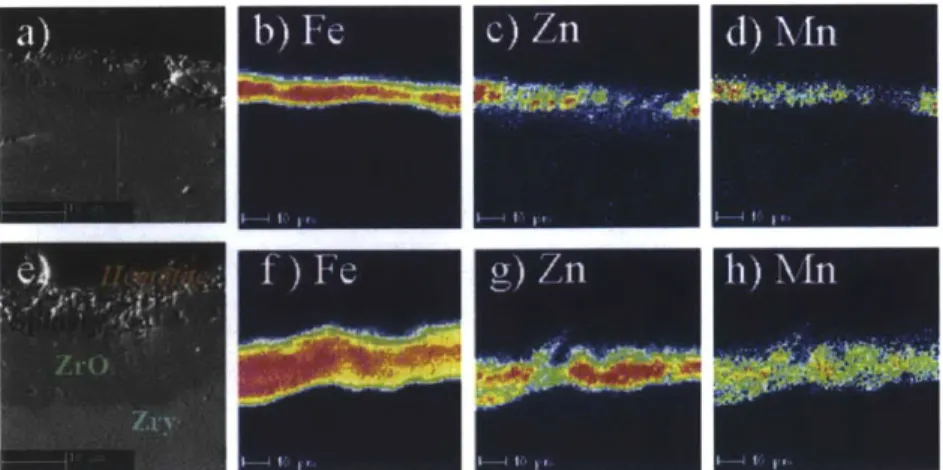
Figure 3: Elemental diag
iU 1O C S I
I
amrams of the CRUD layer deposited on the clad
a mou. ab.O..
- ---
---FO Zo M ft Cr Ca Ci
Figure 4: Elemental composition middle, and bottom [8].
of CRUD at different axial heights in the core: top,
Figure 5: CRUD sample particle cross section, showing the inner, middle, and outer layers. The middle layer contains ZrO2 [11], which accounts for its lighter color in the
backscattered SEM image.
The most common particle found on PWR fuel rods after ultrasonic cleaning was nickel ferrite crystals, or NiFe204 [24]. These have octahedral crystal structures, as a result of being the
corrosion products of the stainless steel and nickel based alloys [24]. Nickel oxide, or NiO, was also found in needle shape form.
Another needle shaped particle found in CRUD is Ni2FeBO5, or bonaccordite. The main
ions in PWR water are Li and B and deposit as the unstable compound Li2B407 during sub
cooled boiling. Some Li2B407 then reacts with NiO and NiOFe2O3 at critical water conditions to
form the quasi-stable compound Ni2FeB0 5, or bonaccordite, [20] and settles on the fuel rod
surface together with the unstable compound Li2B40 7 [22]. During reactor operation, both
CRUD compounds are on the surface of the fuel rods and prevent cooling. Since Li2B407 is
unstable, after reactor shutdown, the compound falls apart and goes into the coolant, leaving Ni2FeBO5 [22].
How to Prevent CRUD Growth
There are two approaches to mitigate the negative effects of CRUD- either minimize the amount of CRUD corrosion products in the coolant or make its deposition unfavorable. Given these two approaches, it is more reasonable to attempt to prevent CRUD growth than to prevent any CRUD corrosion particle creation, which will happen regardless of the conditions in the reactor.
Operating PWR plants try to minimize CRUD in several ways- pH control, hydrogen dissolution, and zinc injection [17]. The optimal pH is 7.2 +/- 0.2 at 300C, which is the solubility pH for nickel ferrite, the main CRUD constituent. Boron concentrations are kept at 1200-1800 ppm to control reactivity, while lithium concentrations at >=2.2 ppm to maintain this optimal pH level [16]. Recent studies, however, have shown that even higher pH of 7.4 was necessary to minimize corrosion, corresponding to a Li concentration of 3.5 ppm Li concentration [15]. The tradeoff is that higher Li concentrations may result in increased Alloy 600 stress corrosion cracking and Zircaloy corrosion [16].
A second way to control CRUD is with hydrogen concentration. Hydrogen affects corrosion and crack propagation rates by reducing the electrochemical potential [23]. Typically, hydrogen levels are kept to 25-35 mL/kg [15].
Another way to control CRUD growth is by altering the zinc concentration in the coolant. Zinc concentrations are usually kept at 5 ppb, which decreases the first fuel cycle dose rate by 15%. The reason that zinc has this effect is that it bonds to the Alloy 600 surface, preventing iron and nickel from leaving the Alloy 600. However, the effects of zinc concentrations have not been fully studied yet and are questionable. The zinc film may lead to similar lower fuel-heat
Approaches for CRUD Cleaning
The fuel assemblies may be cleaned when the reactor is shut down for refueling or maintenance. The CRUD on the upper parts of the fuel assembly sometimes adheres so securely that it remains attached even after regular chemical treatments that usually remove CRUD after
shutdown [9]. CRUD is difficult to remove, so the fuel rods may need to go through mechanical, chemical, or ultrasonic cleaning [16].
Because of CRUD's tenacity, mechanical removal requires a first round of nylon brushing and then silicon carbine stone scrumming [10]. Chemical cleaning is then used to dissolve the CRUD from the surface. Ultrasonic cleaning uses an electromagnetic transducer, or speaker, that creates bubbles, which cavitate and lift the CRUD particles off of the surface [27] where they are collected by a filtration system.
If the bond between the CRUD and surface was to be made weaker, then the fuel rod cleaning will be easier. This study may find materials that weaken the CRUD-clad bond.
Experimental Methods Experimental Setup
Figure 6 shows the pool boiling experimental setup. The chamber on the far left is filled
with PWR water, which has a pH of 7-7.5 and consists of distilled water, 1500ppm boric acid, 5ppm LiOH, and 10ppm each of Fe304 NiO nanoparticles. The nanoparticles are the simulated
CRUD particles. The tape heaters that control the temperature of the chamber water and the
heater underneath the aluminum plate that the sample is epoxied onto are controlled and monitored by the control systems in the middle of Figure 6. The Data acquisition is done by an in-house written Visual Basic program on the far right. It outputs an excel sheet with the water bath temperature and pH as well as the sample temperature.
Figure 6: Experimental set up with the pool boiling facility on the far left, the temperature and pH controls in the middle, and the data acquisition and processing
A photo of the chamber internals when the chamber body is removed can be seen in Figure 7 and an exploded view of the chamber is in Figure 8.
Figure 7: Top view of the test chamber with side walls removed.
Bath Water Thermometer PH Meter
Top Plate with
opening for sample
Sample Thermometer Top Rubber Spacer with
opening for sample
4 x 1/8" bolts Heat Transfer Al Plate
Rubber Spacer
Heater Middle Plate Rubber Spacer Bottom Plate
**[Hold the components Support
sanwiched in
between with the 4 bolts.]
Figure 8)a): Exploded diagram of the chamber internals with the side walls hidden.
Figure 8)b): A Diamond-Like Carbon (DLC) sample.
The samples, like the one in Figure 8)b), are approximately 1 cm2 in area and are
epoxied on to the Heat Transfer Aluminum Plate surface, which is exposed by the opening in the Top Plate and Rubber Spacer, using a thermal potting epoxy. The sample temperature probe is also epoxied next to the sample to record the sample's temperature throughout the test, so it can be kept at above the boiling point and result in sub-cooled boiling. The rest of the Heat Transfer Aluminum plate is covered epoxy to insulate it and force all of the heat that the heater generates to go through the sample, which has a far higher thermal conductivity compared to the epoxy.
The Bath Water Thermometer monitors the ambient water temperature to make sure that it does not rise above boiling so that sub-cooled boiling can happen on the sample. The pH meter records the pH of the water to ensure that it remains near the operating range of a real PWR. Experimental Procedure
Prior to every test, it is important that to wash down the chamber internals to remove any remnants from previous tests of Fe304 or NiO nanoparticles. The sample and its temperature
probe are then epoxied onto the heat transfer plate. A 150W disk heater heats the sample from underneath the heater plate.
The chamber is filled up with about 1.5L of simulated PWR water, with a consistency as described earlier. The water is then heated up with the outside tape heaters that are wrapped around the chamber until the inside water temperature reaches a set point of 80'C. The tape heater is then turned off and the sample disk heater is turned on to heat the sample to a set point of above 100, usually 100-103 C. After an hour, the heater is turned off and the sample is removed to be analyzed.
Post-Test Analysis
The samples are then analyzed using a Focused Ion Bean Scanning Electron Microscope (FIB SEM) to look at the sample-CRUD particle interface and see if there is or is not a visible bond. A beam of gallium ions is perpendicularly focused on the surface of the sample and cuts an indentation in the surface. An electron beam then interacts with the cut surface, releasing
secondary electrons and ions that then form an image of the surface [28]. The FIB SEM can reach resolutions of 10-20nm.
Figure 9: Diagram showing the mechanism of the FIB SEM [28].
Figure 10: Sample FIB SEM image of corrosion under a seawater drop [12].
In the near future, the samples will be analyzed using Atomic Force Microscopy (AFM). An AFM tip has a 0.5-5 micron size NiO or Fe304 particle on its end that is attached to a
cantilever spring of 0.6 N/m [2]. The AFM tip will be pressed down onto the CRUD sample and then lifted. As it is lifted, depending on the adhesion of the CRUD particle to the sample surface, more force may need to be applied to lift the AFM tip up. This force can then be used to get an understanding on the bonding strength of the particle with the surface. This method was used by Larson and his colleagues to determine the interaction force between a SiO2 sphere and TiO2 crystal in a pH from 3-9[14].
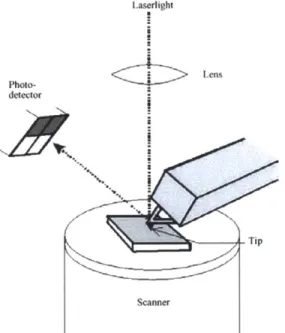
The general configuration of the AFM is shown in Figure 11)a). Its mechanism is shown in Figure 11)b). A sample Force curve that can be used to give insight to the adhesion of the
CRUD particle to the sample surface is in Figure 11)c). The adhesion force is a direct difference of the integrals under the two curves in Figure 11)c).
Laserlight
Photo- Lens
detector
D
Scanner
Figure 11)a): Diagram of the AFM. A laser is pointed at the cantilever tip with a Ni/Fe304 particle mounted to the tip, which is pressed against the CRUD particle on the sample [2].
Figure 11)b): As the AFM tip deflects as it is pressed against the CRUD particle on the sample.
When the tip is pulled up, the tip bends in the other direction because the tip NiO/Fe3O4 particle is adhesive to the CRUD sample. This deflection is recorded by the photo-detector, and resulting in a
J. POhl, C. Stahl, K. Albe Beistein J. Nanotechnol. 3:1-11, 2012. 4 3 I4.z V. al -1 -2 Fs mad -0.1 0.0 0.1 0.2 0.3 0.4 0.5 0.6 Mildi mdslma rn)
Figure 11)c): Force curve showing applied cantilever force to distance as it is pressed down and then pulled up [13].
Results
Visual Analysis of CRUD Spots
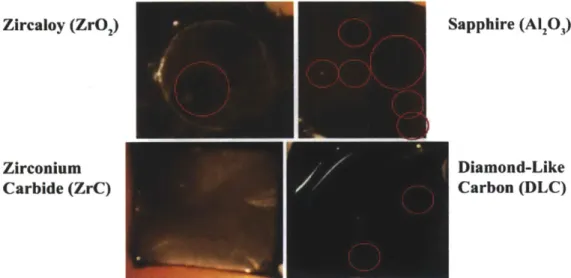
The sample-CRUD bond was observed directly with a FIB/SEM for ZrC, Zircaloy (with a ZrO2 coating), and A1203. Figure 12 depicts the results of the tests. The images show the
surface of each material at a low magnification, depicting how the CRUD deposits on the surface on a macroscopic level, close-up single CRUD particles, and then the CRUD particle-surface interface. In the optical micrographs in Figure 12, circular spots can be seen on all materials except ZrC. These spots were co-located with bubble formation sites, suggesting that the CRUD that formed around them is due to sub-cooled boiling, and not to CRUD precursors drying on the sample surfaces after each test.
Zircaloy (ZrO2) Zirconium Carbide (ZrC) Sapphire (Al203) Diamond-Like Carbon (DLC)
Figure 12: Comparison of four tested samples- Zircaloy, ZrC, A1203, Diamond Like Carbon,
Zircaloy Results
One of the samples that was tested was the Zircaloy with a native ZrO2 coating. This material is most representative of existing fuel cladding, and therefore would theoretically
generate the most similar CRUD-clad bond as found in reactors. The sample developed proto-boiling chimneys, visible as round spots of CRUD, at locations co-incident with bubbles observed on the surface during heating. The CRUD seems to have tenaciously bonded to the surface of the sample. The results are shown at various magnifications in Figure 13.
Figures 13 a-d): The post-test surface on the Zircaloy sample with ZrO2 coating.
13)a) A x100 magnification FIB/SEM image of the Zircaloy surface.
It can be seen from Figure 13)a) that the NiO and Fe30 4 nanoparticles formed clumps,
not necessarily all CRUD particles, and deposited on the surface of the Zircaloy sample. The clumps are of various sizes and it is not clear from a top-down view at a x100 magnification if they are bonded to the Zircaloy surface or not. Figures 13 c-e) provide closer magnifications of the deposited particles.
alp..WrW5 Stp ihtn TN
.~-a.-IO WidAt-.A2 pm Pli.i la.. -Ue .. . Am 5..s + File Nm -ZrO2-MI-SEM-80002.if
The deposited nanoparticles are of various sizes and shapes- some of the clumps are spherical and others are irregular. The nanoparticles seem to form cohesive volumes.
54 h.~ M=L P ~. W 1.dW. ft1w..M-1
13)c) A cutaway through a "tenacious" particle on the Zircaloy surface at x10,000 magnification. The cluster of nanoparticles that was seen to be resting on the surface of the Zircaloy sample seems to have penetrated or bonded to the sample's surface. Note that the well in the surface of the Zircaloy at the bottom of the image is from the focused ion beam cutting through the cluster and into the surface of the sample. On the inside of the cluster are long, vertical
microstructures that are aligned with the direction of heat conduction through the CRUD cluster. If nanoparticles would have formed a cluster in water without any heat, it would be expected that the structure of the cluster would be comprised of an agglomeration of 10-20nm spherical nanoparticles. What Figure 13)c) shows is different. The nanoparticles have morphed their shape, forming long, vertical shapes and bonding together. The bottom tip of the
hypothesized CRUD particle appears to penetrate the surface of the Zircaloy sample.
13)d) Zoomed-in CRUD-Zircaloy penetration interface at x100,000 magnification. The boundary line of the bottom part of the CRUD particle matches well with the
boundary line of the Zircaloy, which means that a new interface has formed. The interface can be distinguished as a white line. The CRUD seems to have formed a bond to the Zircaloy.
ZrC Results
The next sample that was analyzed using the FIB/SEM was ZrC. The sample did not develop boiling chimneys and the CRUD does not form an interface with the surface of the sample. The results are shown at various magnifications in Figure 14.
Figures 14 a-d): The post-test surface on the ZrC sample
14)a) ZrC at magnification x50 showing no boiling chimneys.
The ZrC surface at low magnification does not seem to have circular shapes that would suggest boiling chimney locations. The surface is covered with dots of particles that seem to be distributed evenly across the entire surface. After the test was complete, the water was drained and the sample left to dry, so that the particles left in the water droplet settled onto the sample surface. This process occurred without heating, so there should be no interaction between the residual particles that are then observed on the sample.
.. .I. ........
14)b) ZrC at magnification x5,000 showing the CRUD particles in a surface crevice. The surface of ZrC had some cracks and uneven places, as it was not 100% dense. Some of the NiO and Fe304 nanoparticle clusters collected inside of the crevices and some rested on
the surface of the sample.
1-4c FZing a clsterZPCCm.D2CII 14)c) ZrC at magnification x20,OOO showing a cluster.
This CRUD cluster is spherical in shape and does not exhibit the long, vertical
microstructures as the Zircaloy CRUD cluster had. The bottom of the cluster does not penetrate the surface of the ZrC sample, and it does not seem to have much of a unified interface with it.
EW &bI? kAV WD. 00,.. BI FIN =abM 0 n
-4 Wkkh,.DVI. . A =A -SA I .A Fill MI C.CRW-INO. Fd.FU.E 14)d) ZrC at magnification x75,000 showing the CRUD-ZrC interface.
The nanoparticle cluster, which may be CRUD or just a settled cluster, does not seem to have any interaction with the sample surface. There is no real boundary line between the cluster and sample, as there was with the Zircaloy sample. Also, not that the microstructure of the cluster consists of small, relatively evenly sized and shaped particles, most likely the NiO and Fe304 nanoparticles that are not sintered together, as they were in the long, vertical shapes in the
ALQ3 Results
Another sample analyzed using the FIB/SEM was the A1203. The sample developed
boiling chimneys, but the particle-cluster to surface boundaries have not been investigated yet. The results are shown at various magnifications in Figure 15.
Figure 15 a-b): CRUD on the A1203 sample.
Ma
4x EHT=6.00Wk WD= 6,0mm Sional aI- fin InLene SE BLo k i C ei. a orr .OnOn 1 ob Width - 3MI mm Pixel Size = 3.501 pm TA A = seo File Nmam = A1203-BigViewl.ii
15)a) A1203 at magnification x84 with the proto-boiling chimney circled.
As the samples were tested, the heat was forced to go through the sample surface, since the rest of the heated plate was sealed off by epoxy. The sample surface boiled while being kept at the boiling temperature, while the rest of the plate that the heat was going through was kept at a sub-cooled temperature. When the bubbles left the surface or popped on it, they left circular residues, as seen in the circled part of Figure 15)a). These are believed to be proto-boiling chimneys, most likely comprised of CRUD particles. The rest of the particles on the surface could possibly be "background noise" in that they are simply nanoparticles that settled onto the sample surface as it dried after the test. They cannot be wiped off because then there is a risk of wiping off the boiling chimney residue, which is the evidence that needs to be studied.
M.q 4 KEX EHT = 6.0V WD --. 0 mm SIASE2 MLack Mags = Ye WO 1a FM
I - - Width -76.80 pm PixlSie - .7n nm TMAWg = &o- File Nume = A203-ChimnGY2400)i f
15)b) Al2O3 at magnification x4,000 showing the CRUD particles.
Again, the settled particles are of various shapes and sizes. From the top view, it is not clear as to what kind of interaction the particles have with the sample surface. Further
investigation of the interface between the CRUD particles and the A1203 surface is needed to
Discussion
Out of the five samples studied so far: Zircaloy, ZrC, A1203, TiO2, and DLC, only ZrC
did not develop CRUD boiling spots and does seem to have bonded CRUD particles. At this point it is the best tentative CRUD-resistant material.
Several more tests should be performed on the tested samples to learn more about the properties of the amalgamated clusters, which may be CRUD, and their bonding characteristics with the sample surface. At this stage, it is uncertain whether or not the composition of the
amalgamated particles is similar to that of real PWR CRUD particles. X-ray diffraction tests could reveal the compound composition of the particles. After determining the composition of CRUD in the pool boiling assembly, the composition could be compared to the chemical composition to CRUD from PWRs. Depending on the similarity, the pool boiling facility PWR water composition could be altered to try to match true CRUD composition. In these tests, there are about 100 times more nanoparticles in the water than there are in regular PWR water, with the objective of which was to increase the chances of having the particles deposit on the sample
surfaces. If plant CRUD precursor concentrations were used, then the tests would probably need to be run for longer periods of time to allow more particles to deposit on the surface.
Once the AFM tips are manufactured, the CRUD-to-sample bond strengths of all of the samples will be tested. The rest of the samples- Diamond Like Carbon, TiO2, and SiO2 will be also be tested using the FIB SEM and AFM, and compared to the results of the ZrC and Zircaloy samples. The materials with the lowest bond strength will be strong candidates for CRUD-resistant materials.
As seen in all of the low-magnification images of the tested samples, there were clusters of nanoparticles that were evenly dispersed on the surface, which act like background noise to the "signal" of the proto-boiling chimneys. In the effort to account for this background and to disregard clusters that are just resting on the sample surface, a control test is in progress. The test compares an SiO2 sample with a dried drop of PWR water on it to a regular boil-tested sample.
This test will check the hypothesis of whether or not the seemingly "unbounded" CRUD
particles as seen on the Zircaloy samples are actually not attached as they are in the dried sample. The pool boiling facility used in this experiment is only capable of operating at
atmospheric pressure and a sample surface temperature of around 101-105*C. Industry reactors operate at significantly higher pressures and temperatures, up to 15.5MPa and 350C. The next test for the samples will be done in a PWR testing loop, which is currently under construction. These tests will better approximate conditions in a real PWR, and provide more realistic results for how the samples would develop CRUD in a PWR. With a higher pressure, the bubbles will not grow to be as big as at atmospheric pressure, which means that each bubble will cover less surface area on the sample. This smaller size will allow for more bubbles to emerge on the sample surface, leading to more of the bubble nucleation sites. As seen in Figure 5, the boiling chimneys are 10-15 microns apart. The bubble site on the A1203 sample in Figure 15)a) is about 500 microns in diameter. Therefore, the bubbling sites in real reactors show that it is possible to be closer than the bubbles that are currently forming in the pool boiling facility. The PWR testing loop test should be able to drive the bubble size to be more like those seen in PWRs.
The PWR testing loop should also be able to allow for testing in more realistic
temperatures, of around 350*C on the "fuel cladding" sample surface. At a higher temperature, the bubbling will be more intensive, and the bubbles will not have the opportunity to grow to be as large as they would at the lower temperature they are being tested at right now.
Another parameter that few experiments account for are the effects of radiation. In
radiation fields, solubilities of compounds are different from what they are without radiation, due to hydrolysis of the water in the coolant. Radiation also induces structural material damage, which could change the way CRUD bonds to the fuel cladding. The sample-CRUD interface may therefore be strengthened in a radiation field. It would be useful to perform this test in a reactor
loop, like in the MIT reactor, and see how the nanoparticles deposit on the sample surface as compared to out-of-reactor tests.
Conclusion
A pool boiling facility was constructed to test materials that may be more CRUD resistant than Zircaloy, the fuel cladding the nuclear industry currently uses. Five samples were tested at atmospheric pressure where the sample was heated in a way to simulate sub-cooled boiling.
ZrC did not develop the dark CRUD spots after 1 hour boiling tests. Further testing will be needed to confirm that ZrC is indeed more CRUD resistant, even under higher pressures in a new testing facility under parallel development. This therefore it is tentatively the best contender for CRUD resistance at this stage.
Additional tests that will give a better understanding of the nanoparticle cluster-sample interactions are AFM testing to learn the bond strength between the cluster/CRUD particles and the sample. Another test that will help understand the composition of the clusters is X-ray diffraction to determine the chemical fractions of the clusters. Further studies that will help grow more PWR-realistic CRUD are include testing the same materials at a higher pressure,
Bibliography
[1] Bergmann, C. et al. "The Role of Coolant Chemistry in PWR Radiation Field Build-up." EPRI NP 4247, 1985.
[2] Butt, H., Cappella, B., and Kallp, M. "Force measurements with the atomic force microscope: Technique, interpretation and applications." Surface Science Reports. Vol. 59, Issue 1-6. pp 1-152. Oct 2005.
[3] Chen, Jiaxin. "On the Interaction between Fuel Crud and Water Chemistry in Nuclear Power Plants." Swedish Nuclear Power Inspectorate (SKI) Report. 00:5. Sweden. Jan 2000. ISSN 1104-1374.
[4] Cinosi, N., Haq, I., Bluck, M., and Walker, S.P. "The effective thermal conductivity of CRUD and heat transfer from CRUD-coated PWR fuel." Nuclear Engineering and Design. Elsevier. Volume 241. pp. 792-798. 2011.
[5] "CASL: The Consortium for Advanced Simulation of Light Water Reactors." CASL Project Summary Slides. US Department of Energy. CASL-U-2011-0137-000. Aug 1, 2011. [6] Decossin, E. and Bremnes, 0. "Axial Offset Anomaly Modeling Studies on EDF Cores."
Proceedings of the 16 th International Conference on Nuclear Engineering. May 11-15,
2008. Orlando, FL, USA. ICONE16-48286.
[7] Franz, C. and Muller, D. «Analyzing focal adhesion structure by atomic force microscopy." J Cell Science. Vol 118, 5315-23. 2005.
[8] Gunther-Leopold, I. Krois, M., Waldis, J., et al. "Investigation of fuel crud by means of ICP-MS and TEM." ATALANTE 2012. International Conference on Nuclear Chemistry for Sustainable Fuel Cycles. Prosedia Chemistry. pp 673-678. 2012.
[9] Hawkes, Joshua. "The Simulation and Study of Conditions Leading to Axial Offset Anomaly in Pressurized Water Reactors." Georgia Institute of Technology. December, 2004.
[10] Hazelton, R. "Characteristics of Fuel Crud and its Impact on Storage, Handling and
Shipment of Spent Fuel," PNL-6273, Pacific Northwest Laboratory, Richland, WA. 1987. [11] Henshaw, J., McGurk, J., Sima, H., et al. "A model of chemistry and thermal hydraulics in
PWR fuel crud deposits." Journal of Nuclear Materials. Vol. 353, Issue 1-2. pp 1-11. July 2006.
[13] Lange, M., van Vorden, D., and Moller, Rolf. "A measurement of the hysteresis loop in force-spectroscopy curves using a tuning-form atomic force microscope." Beilstein K. Nanotechnol. pp 207-212. Mar 8 2012.
[14] Larson, I., Drummond, J., Chan, D., and Grieser, F. "Direct Force Measurements between Dissimilar Metal Oxides." J. Phys. Chem. 1995. Vol. 99. pp 2114-2118. Nov. 15, 1994.
[15] Nordmann, F. "Aspects on Chemistry in French Nuclear Power Plants". 14th International
Conference on the Properties of Water and Steam (ICPWS). Kyoto, Japan. Aug 2004. [16] Nordman,F. "PWR and BWR chemistry optimization." Nuclear Engineering International.
pp 24-29. Dec 2011.
[17] Nordmann F, Odar S, Venz H, et al. ANT International Chemistry Update and best Practices. Nuclear Plant Chemistry Conference, NPC 2010. Quebec. Oct 2010.
[18] Orlov, A. Degueldre, C., Wiese, H., et al. "Corrosion product deposits on boiling-water reactor cladding: Experimental and theoretical investigation of magnetic properties." Journal of Nuclear Materials. Nuclear Materials IV. Vol. 416, Issues 1-2. pp 117-124. Sept. 2011.
[19] Reiss, R. and Lundgren, K. "CRUD in PWR/VVER and BWR Primary Circuits." LCC-2 Special Topic Report. Advanced Nuclear Technology International. Sweden. Oct 2006. [20] Sawicki, Jerzy. "Evidence of Ni2FeBO5 and m-ZrO2 precipitates in fuel rod deposits in
AOA-affected high boiling duty PWR core." Journal of Nuclear Materials. Vol. 374, Issue 1-2. pp 248-269. 29 Feb 2008.
[21] Short, Michael. "Progress Report: CRUD-Resistant Materials." EPRI. Feb 15, 2013. Stokes, D., Morrissey, F., and Lich, BH. "A New Approach to Studying Biological and Soft Materials Using Focused Ion Beam Scanning Electron Microscopy (FIB SEM). Journal of Physics Conference Series 26. Institute of Physics Publishing. pp 50-53. 2006. [22] Uchida, S., Yamato, A., and Suzuki, H. "Deposition of boron on fuel rod surface under
sub-cooled boiling conditions- An approach toward understanding AOA occurrence." Nuclear Engineering and Design. Elsevier. Volume 241. pp. 2398-2410. 2011. [23] Wood, C. "Developments in Nuclear Power Plant Water Chemistry." Electric Power
Research Institute. International Conference of Water Chemistry of Nuclear Reactor Systems, 8. British Nuclear Energy Society. CA, USA. pp 1-6. 2000.
[24] Yeon, Jei-Won, Choi, In-Kyu, Park, Kyun-Kyoung-Kyun, et al. "Chemical analysis of fuel CRUD obtained from Korean nuclear power plants." Journal of Nuclear Materials. Elsevier. Vol. 404, Issue 2. pp. 160-164. 15 September 2010.
[25] U.S.NRC. Glossary "Crud". December 10, 2012. <http://www.nrc.gov/reading-rm/basic-ref/glossary/crud.html>.
[26] Short, M. P. "Method for Improving Deposition (CRUD) Resistance of Nuclear Fuel Cladding and Components." U. S. Provisional Patent, No. 61-600128, 2011. [27] Dalrymple, W. "Crystal Clean." Nuclear Engineering International. Dec. 2012.
[28] Stokes, DJ., Morissey, F., and Lich, DH. "A New Approach to Studying Biological and Soft Materials Using Focused lo Beam Scanning Electron Microscopy (FIB SEM)." Journal of Physics: Conference Series 26. Institute of Physics Publishing. pp 50-53. 2006. [29] Byers, W. "Crud-resistant nuclear fuel cladding." Westinghouse Electric Company. Patent:
![Table 1: Samples to be tested and their properties [Short]. Calculations performed by Wenbin Li (MIT) and Xiaofeng Qian (MIT).](https://thumb-eu.123doks.com/thumbv2/123doknet/14525078.532247/4.918.183.714.619.852/table-samples-tested-properties-calculations-performed-wenbin-xiaofeng.webp)
![Figure 1: CRUD sample particle at various magnifications [20].](https://thumb-eu.123doks.com/thumbv2/123doknet/14525078.532247/7.918.218.668.110.474/figure-crud-sample-particle-at-various-magnifications.webp)


![Figure 10: Sample FIB SEM image of corrosion under a seawater drop [12].](https://thumb-eu.123doks.com/thumbv2/123doknet/14525078.532247/14.918.234.663.480.844/figure-sample-fib-sem-image-corrosion-under-seawater.webp)
![Figure 11)c): Force curve showing applied cantilever force to distance as it is pressed down and then pulled up [13].](https://thumb-eu.123doks.com/thumbv2/123doknet/14525078.532247/16.918.244.672.114.394/figure-force-showing-applied-cantilever-distance-pressed-pulled.webp)