HAL Id: hal-00330740
https://hal.archives-ouvertes.fr/hal-00330740
Submitted on 15 Oct 2008HAL is a multi-disciplinary open access
archive for the deposit and dissemination of sci-entific research documents, whether they are pub-lished or not. The documents may come from teaching and research institutions in France or abroad, or from public or private research centers.
L’archive ouverte pluridisciplinaire HAL, est destinée au dépôt et à la diffusion de documents scientifiques de niveau recherche, publiés ou non, émanant des établissements d’enseignement et de recherche français ou étrangers, des laboratoires publics ou privés.
East Asian Monsoon and paleoclimatic data analysis: a
vegetation point of view
Joel Guiot, W. Haibin, J. Wenying, L. Yunli
To cite this version:
Joel Guiot, W. Haibin, J. Wenying, L. Yunli. East Asian Monsoon and paleoclimatic data analysis: a vegetation point of view. Climate of the Past Discussions, European Geosciences Union (EGU), 2008, 4 (1), pp.213-231. �hal-00330740�
CPD
4, 213–231, 2008East Asian monsoon and paleovegetation J. Guiot et al. Title Page Abstract Introduction Conclusions References Tables Figures ◭ ◮ ◭ ◮ Back Close
Full Screen / Esc
Printer-friendly Version Interactive Discussion
Clim. Past Discuss., 4, 213–231, 2008 www.clim-past-discuss.net/4/213/2008/
© Author(s) 2008. This work is distributed under the Creative Commons Attribution 3.0 License.
Climate of the Past Discussions
Climate of the Past Discussions is the access reviewed discussion forum of Climate of the Past
East Asian Monsoon and paleoclimatic
data analysis: a vegetation point of view
J. Guiot1, W. Haibin2,3, J. Wenying4, and L. Yunli5
1
CEREGE, CNRS/Universit ´e Paul C ´ezanne UMR 6635, BP 80, 13545 Aix-en-Provence cedex, France
2
SKLL, Institute of Earth Environment, Chinese Academy of Sciences, Xian 710075, China
3
Institut des Sciences de l’Environnement, UQAM, Montr ´eal PQ, H3C 3P8 Canada
4
Institute of Geology and Geophysics, Chinese Academy of Sciences, P.O. Box 634, 100029 Beijing, China
5
Institute of Botany, Chinese Academy of Sciences, 100093, Beijing, China
Received: 10 December 2007 – Accepted: 22 January 2008 – Published: 20 February 2008 Correspondence to: J. Guiot (guiot@cerege.fr)
CPD
4, 213–231, 2008East Asian monsoon and paleovegetation J. Guiot et al. Title Page Abstract Introduction Conclusions References Tables Figures ◭ ◮ ◭ ◮ Back Close
Full Screen / Esc
Printer-friendly Version Interactive Discussion
Abstract
First we review several syntheses of paleodata (pollen, lake-levels) showing the climate variations in China and Mongolia from the last glacial maximum to Present and in particular the precipitation increase at mid Holocene related to enhanced monsoon. All these results concur to a much enhanced monsoon on most of China during the
5
first half of the Holocene. Second we present, in some details, a temporal study of a core (Lake Bayanchagan, Inner Mongolia) located in an arid region at the edge of the present East Asian Monsoon (EAM) influence and then sensitive to climatic change. This study involves pollen data together with other macro-remains and stable isotope curve to obtain a robust climate reconstruction. This studies shows a long wet period
10
between 11 000 and 5000 years BP divided in two parts, a warmer one from 11 000 and 8000 (marked by large evapotranspiration) and a cooler one more favourable to forest expansion. Third, we present a spatial study based on pollen data only and covering all China and Mongolia at 6000 years BP, but using a mechanistic modelling approach, in an inverse mode. It has the advantage to take into account environmental
15
context different from the present one (lower atmospheric CO2, different seasonality).
This study shows temperature generally cooler than present one in southern China, but a significant warming was found over Mongolia, and a slightly higher in Northeast China. Precipitation was generally higher than today in southern, Northeast China, and northern Mongolia, but lower or similar to today in Northwest China and North China.
20
Enhanced EAM was then found in the southern half of China and in Northeast China.
1 Introduction
The past 21 000 years are a very interesting time period period as it contains two ex-treme states of the climate. The Last Glacial maximum (LGM, 21 000 years BP.) is a cold and generally dry period driven by enlarged ice sheets and low atmospheric
25
CPD
4, 213–231, 2008East Asian monsoon and paleovegetation J. Guiot et al. Title Page Abstract Introduction Conclusions References Tables Figures ◭ ◮ ◭ ◮ Back Close
Full Screen / Esc
Printer-friendly Version Interactive Discussion
the present one, is considered as orbital forced period with perihelion in northern summer/autumn and greater-than-present axial tilt (Berger, 1978) but free of ma-jor ice-sheet and relatively high CO2 (taking as reference the pre-industrial present
time). These two periods have been chosen as key time periods by the Palaeoclimate Modelling Intercompraison Project, PMIP (Joussaume and Taylor, 1995). The
mid-5
Holocene, with its high summer insolation, is a period of high land-sea contrast and consequently enhanced monsoon (Braconnot et al.,2002). It is of particular interest for climate modellers to test their simulations through palaeodata from the monsoonal regions.
The East Asian monsoon (EAM) is one of the most active components of the global
10
climate system, influencing a large area of China and its surrounding countries. In China and surrounding countries, a megathermal period was reconstructed from 8500 to 3000 14C yr ago (Shi et al., 1993). However, many recent studies have shown that Holocene climatic changes were asynchronous across China (An,2000;An et al.,
2006;He et al.,2004). The Holocene optimum was defined as EAM precipitation
max-15
imum, occurring ca. 10 000–800014C yr ago in northeastern China, 10 000–700014C yr ago in north-central and northern east-central China, 7000–500014C yr ago in cen-tral China, and ca. 3000 14C yr ago in southern China (An, 2000). The reason for debate on Holocene climatic variations is that complexity of the EAM, and different re-sponses of environmental proxies to climatic changes (Wei and Gasse,1999;Wang
20
et al.,2003). Therefore, more precisely dated palaeo-records and improved quantita-tive reconstruction are required to provide quantitaquantita-tive insights into the processes of climatic changes, and their links to the EAM.
A paleoclimatic study on a core sampled in Lake Bayanchagan (Inner Mongolia) has been proposed by Jiang et al. (2006) using pollen data. This region is particularly
25
sensitive to climate variations as it is located at the edge of the present EAM. Their results suggest that this region was dominated by steppe vegetation throughout the Holocene, except for the period 9200 to 6700 cal yr BP, when forest patches were relatively common. This period can then be correlated to enhanced EAM. Nevertheless
CPD
4, 213–231, 2008East Asian monsoon and paleovegetation J. Guiot et al. Title Page Abstract Introduction Conclusions References Tables Figures ◭ ◮ ◭ ◮ Back Close
Full Screen / Esc
Printer-friendly Version Interactive Discussion
a multiproxy analysis need to be done to reinforce this conclusion. We will synthesise in the first part of this paper an statistical approach based, in addition to pollen, on isotopic data and concentration of a green algae species (Jiang et al., 20081). This study will focus on the timing of this enhanced EAM period.
This approach based on detailed time series in a sensitive region will be completed
5
by a spatial analysis based also on pollen data but done with the newest tools involving a process model able to relate vegetation and climatic variations (Wu et al.,2007; Luo et al., 20082). The strong feature of this approach is to be able to take into account the large differences existing between present and mid-Holocene conditions as (i) cli-mate seasonality, possibly resulting in lack of modern analogues, or (ii) atmospheric
10
CO2 close to pre-industrial concentration but significantly lower than the present one. This spatial analysis will be first replaced in the context of previously published data syntheses at the sub-continental scale.
2 Data syntheses
An interesting story has been depicted byRen and Beug(2002) in the northern half of
15
China (north of Yangtze river) for the whole Holocene. Forests generally expanded in the early Holocene times, reaching their maximum at 6 or 4 ka BP, with a maximum in Central China, and then regressed during the late Holocene. An exception was found for northeast China where the maximum development of forest occurred during the last 4000 or 2000 years. They concluded that, if the EAM enhancement seems to be
20
1
Jiang, W., Guiot, J., Wu, H., Chu, G., Yuan, B., Hatt ´e, C., and Guo, Z.: Reconstruction of Holocene summer monsoon history using d18O of carbonate, Pediastrum and pollen records from lake sediments in northern China, Global and Planetary Change, submitted, 2008.
2
Luo, Y., Wu, H., Jiang, W., Guiot, J., and Sun, X.: Climatic changes in China at the Last Glacial Maximum and mid-Holocene: reconstruction from pollen data using inverse vegetation modelling, in preparation, 2008.
CPD
4, 213–231, 2008East Asian monsoon and paleovegetation J. Guiot et al. Title Page Abstract Introduction Conclusions References Tables Figures ◭ ◮ ◭ ◮ Back Close
Full Screen / Esc
Printer-friendly Version Interactive Discussion
responsible of the forest expansion at the beginning of the Holocene, disturbance by human activities may be responsible of the forest decline after 6 ka BP.
This picture was completed by the study ofYu et al. (1998) who analysed the veg-etation variations at the biome level for the whole China, but restricted at the 6 ka BP period. In eastern China at 6 ka BP, forest shifted northwards, with broadleaved
5
evergreen forest extended about 300 km and temperate deciduous forest about 500– 600 km beyond their present northern limit. In northwestern China, the area of desert and steppe vegetation was reduced as compared to present. They concluded that these shifts were likely a response to enhanced Asian monsoon.
Lake levels data are less susceptible to be influenced by human disturbances. Yu
10
et al. (2003) proposed a story of the lake levels since the Last Glacial Maximum (LGM, about 1814C ka BP). This compilation showed LGM conditions much drier than today in eastern China but somewhat wetter in western China. These east-west differen-tial patterns of climate conditions were completely different from the modern dry-wet conditions with a north-south opposition. During the Holocene, at the mid-Holocene,
15
both regions were wetter than present. Modern dry conditions returned after 5–4 ka BP depending on the region. Then if humans played a role in the forest decline in the Late Holocene, they simply accentuated a climatic trend. Atmopheric general circu-lation models (AGCM) coupled with land surface process model showed that the dry conditions in eastern China resulted from less summer precipitation due to the Pacific
20
Subtropical High occupying eastern China and the decline in the summer monsoon. More at north, in Mongolia,Tarasov et al.(1999) reconstructed, from pollen, warmer and wetter at 6 ka BP conditions for the northern part of the country, in agreement with higher lake levels. In the central part of the country, warmer and drier conditions prevailed (inferred from pollen, no lake data being available). But these dry conditions
25
CPD
4, 213–231, 2008East Asian monsoon and paleovegetation J. Guiot et al. Title Page Abstract Introduction Conclusions References Tables Figures ◭ ◮ ◭ ◮ Back Close
Full Screen / Esc
Printer-friendly Version Interactive Discussion
3 A multi-proxy technique to reconstruct climate time variability in Inner Mon-golia
The syntheses presented above are based either on pollen data or lake lavels data. A multi-proxy approach is now presented to reinforce and precise these results (Jiang et al., 20081). It is based on a record taken from Lake Bayanchagan (115.21◦E, 41.65◦N,
5
1355 m a.s.l.) in Inner Mongolia, which is today almost completely dry due to anthro-pogenic water use, with only small patches of shallow water maintained by summer rain. It is situated at the current northern edge of the summer monsoon. The mean annual temperature in the area is about 3◦C, and total annual precipitation is 300–
400 mm. About 70% of the precipitation occurs during the summer. The data used are
10
pollen taxa counted for 90 pollen assemblages and 2066 surface samples. The taxa are grouped into 17 plant functional types (e.g. boreal evergreen conifers, steppics, grass, temperate summergreen trees, etc...) to reduce the number of variables and also to consider together taxa which respond in the same way to climatic variations. These plant functional types (PFT) are used to reconstruct climate by the modern
ana-15
logue method (PFT- MAT) proposed byDavis et al.(2003) andJiang et al.(2006). The climatic variables considered are the temperature of the coldest month (MTCO), the temperature of the warmest month (MTWA), the annual precipitation (MAP), the ratio actual evapotranspiration over potential evapotranspiration (α). These variables are calculated by linear interpolation from meteorological stations (Jiang et al.,2006) and
20
αis obtained from monthly temperature, precipitation and sunshine variables using the Priestley-Taylor equation (Prentice et al.,1992).
To these proxies, are added total pollen concentrations, Pediastrum (a green algae that indicate shallow lake water) concentrations and δ18O of authigenic carbonate, i.e. on the <40 µm fraction (Jiang et al., 20081). These three proxies show a similar
25
general pattern during the Holocene. Before 11 000 cal yr BP, there is no Pediastrum in the lake. Pollen concentrations are lower than 2×10⁵ grains/ml. All δ18O values of authigenic carbonate are between −3 and −1‰ VPDB. Similar values are found after
CPD
4, 213–231, 2008East Asian monsoon and paleovegetation J. Guiot et al. Title Page Abstract Introduction Conclusions References Tables Figures ◭ ◮ ◭ ◮ Back Close
Full Screen / Esc
Printer-friendly Version Interactive Discussion
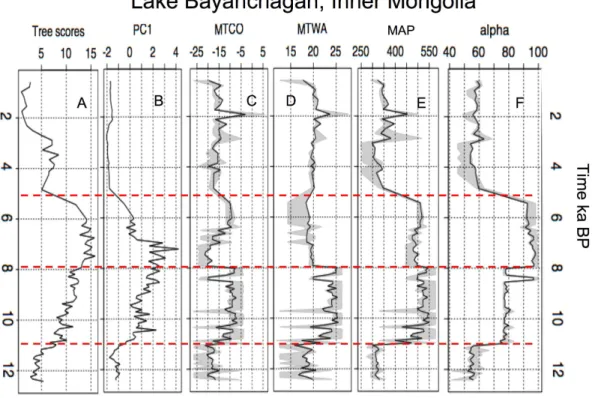
5 ka BP and in between, there is high concentrations of pollen and Pediastrum and low δ18O values. As Jiang et al. (2008)1 have shown that these three variables are controlled by balance between precipitation and evaporation, they can be synthetized a common signal, given here by their first principal component (Fig. 1).
Jiang et al. (2008)1 have used PFT-MAT constrained by the first principal
compo-5
nent PC1 (Fig. 1b) as an indicator of α, a variable directly related to the water stress. This constrained analysis has already been proposed with different proxies bySeret
et al. (1992);Guiot et al.(1993);Cheddadi et al.(1996);Magny et al.(2001); Jiang et al. (2008)1. For each fossil pollen spectrum, analogues were selected from the mod-ern pollen spectra dataset subject to a broad consistency requirement according to α
10
values. If we note the difference δα between α of the analogue and the modern αo at the lake (56%), only the analogues i with a δαi compatible with PC1 at time t, denoted Ct, were retained. This compatibility is defined as follows:
Ct>2 and δαi >10% Ct< −2 and δαi < −10%
15
−2 6 Ct62 and − 10% 6 δαi 610% (1)
Figure1shows the results obtained for the Lake Bayanchagan core: the reconstructed climatic variables are compared with the constraint PC1 and the scores of the arbo-real pollen taxa. This enables one to question the direct relationship often proposed between an increase in tree components of pollen assemblages and a warmer and
20
wetter climate (Shi et al.,1993;Liu et al.,2002;Xiao et al.,2004). So, the highest tree scores of trees during the Holocene in Lake Bayanchagan occurred between 8000 and 5500 cal yr BP (Fig. 1a). However, the peak period of trees was not in phase with the warmest and wettest climate reconstructed between 11 000 and 8000 cal yr BP (Fig.1c–e), suggesting that a single climatic variable is not the triggering factor.
25
In contrast, variations in tree components and α were consistent (Fig. 1a and f). α is an integrated measure of annual amount of growth-limiting drought stress on plants related to both temperature and precipitation, and is one of primary factors influencing
CPD
4, 213–231, 2008East Asian monsoon and paleovegetation J. Guiot et al. Title Page Abstract Introduction Conclusions References Tables Figures ◭ ◮ ◭ ◮ Back Close
Full Screen / Esc
Printer-friendly Version Interactive Discussion
vegetation distributions (Prentice et al.,1992). The similarity in tree components and α variations inferred from our study indicates that it is also the main controlling factor for growth of trees over the Holocene in Inner Mongolia. α does not reach its maximum before 8 ka BP even if MAP is maximum because evaporation is too strong. The water stress is minimum only when temperature has decreased by a few degrees. The most
5
favourable period for forest development is then between 8 ka and 5 ka BP.
The MAP record during the Holocene at Lake Bayanchagan is similar to δ18O records of stalagmite calcite from Dongge Cave and Shanbao Cave in EAM regions (Dykoski et al.,2005;Shao et al.,2006). Shifts in δ18O values of the stalagmite from the cave largely reflect changes in δ18O values of meteoric precipitation at the site,
10
which in turn relates to changes in the amount of precipitation. The δ18O results show that monsoon precipitation increased dramatically at the start of the Holocene (∼11 500 cal yr BP) and remained high for ∼6000 cal yr BP (Dykoski et al.,2005). This timing is consistent with other paleoclimatic records in EAM regions (Zhou et al.,2004,
2005). Both the Lake Bayanchagan data and stalagmite δ18O records from Dongge
15
Cave and Shanbao Cave show the termination of monsoon precipitation maximum was abrupt between 6000 and 4400 cal yr BP.
The second warm and humid period at Lake Bayanchagan centered at 6000 cal yr BP. This event was characterized by increased MTCO, decreased MTWA and high precipitation (Fig.1c–e). These results agree with a marked increase in winter
tem-20
peratures across eastern China at 6000 cal yr BP estimated from pollen data (Yu et al.,
1998) and simulated by climatic model (Yu et al., 2003). The short-term cold event between 8500 and 8300 cal yr BP was characterized by decreases in both winter and summer temperature (Fig. 1c–d). Even if such event has been recorded in several places and in particular in the GRIP and GISP2 records (Alley et al.,1997;Rohling and
25
Palike,2005), it cannot be considered as significant in our reconstruction, as several such peaks are reconstructed during the Holocene.
CPD
4, 213–231, 2008East Asian monsoon and paleovegetation J. Guiot et al. Title Page Abstract Introduction Conclusions References Tables Figures ◭ ◮ ◭ ◮ Back Close
Full Screen / Esc
Printer-friendly Version Interactive Discussion
4 A inverse modelling technique to reconstruct climate spatial variability in China
Multi-proxy approach is a way to produce robust paleoclimatic information but, as it is based on modern data using a statistical approach, it does not solve all the problems. The reconstruction methods are built upon the assumption that plant-climate
interac-5
tions remain the same through time, and implicitly assume that these interactions are independent of changes in atmospheric CO2. This assumption may lead to a consid-erable bias, as polar ice core records show that the atmospheric CO2 concentration
has fluctuated significantly over the past (EPICA, 2004). At the same time, a num-ber of physiological and palaeoecological studies (Farquhar,1997;Jolly and Haxeltine,
10
1997;Cowling and Sykes,1999) have shown that plant-climate interactions are sensi-tive to atmospheric CO2 concentration. Therefore, the use of mechanistic vegetation
models has been proposed to deal with these problems (Guiot et al.,2000). Wu et al.
(2007) have improved the approach based on the BIOME4 model to provide better spatial and quantitative climate estimates from pollen records and correct for CO2bias
15
to pollen-based climate reconstructions in Eurasia and Africa. The same method is quickly presented here for Eastern Asian data.
4.1 Data and method
The pollen data used have been compiled by the BIOME6000 project (Prentice and
Jolly,2000) for three key periods: 0 k, 6 k and 21 ka BP to classify pollen assemblages
20
into a set of vegetation types. For the study described here, a subset containing 601 sample sites for 0 ka BP and 116 sites for 6 ka BP from China and Mongolia were used (MCPD, 2000, 2001; Tarasov et al.,1998). The selection of the 6 ka BP samples is based following the BIOME6000 convention. Among them, 84 sites have a good age control, i.e. either with at least two dates encompassing 6 ka BP at less than than 2000
25
years distance.
CPD
4, 213–231, 2008East Asian monsoon and paleovegetation J. Guiot et al. Title Page Abstract Introduction Conclusions References Tables Figures ◭ ◮ ◭ ◮ Back Close
Full Screen / Esc
Printer-friendly Version Interactive Discussion
scheme that simulates the response of plants to changed atmospheric CO2 and by accounting for the effects of CO2on net assimilation, stomatal conductance, leaf area
index and ecosystem water balance. It is driven by monthly temperature, precipitation, sunshine, by absolute minimum temperature, CO2 concentration and soil texture. The principle of the model inversion is to estimate the input to BIOME4, the monthly
cli-5
mate, given that we know some information related to the output of the model, biome scores derived from pollen in our case (Prentice et al., 1996). This inversion, which uses a Monte-Carlo-Markov-Chain algorithm to explore possible combinations of cli-mate parameters, allows an assessment of the probability of different anomalies, and therefore the investigation of different scenarios which may result in similar vegetation
10
pattern. The procedure is described inWu et al. (2007). As Guiot et al.(2000), they showed that several solutions were possible for the LGM climate in Western Europe where a mixture of steppes and tundra existed. As these biomes have no clear ana-logues today, reconstructions based on statistical methods will tend to choose the least poor match or fail to find a real match. With the inverse modelling,Wu et al. (2007)
15
showed that a climate significantly warmer than inferred with modern CO2levels was
the most probable. The overestimation of MTCO anomalies was about 10◦C. Moreover
uncertainties were also underestimated with the statistical methods. 4.2 Validation
We present here an analysis of Chinese mid-Holocene data (Luo et al., 20082). In
20
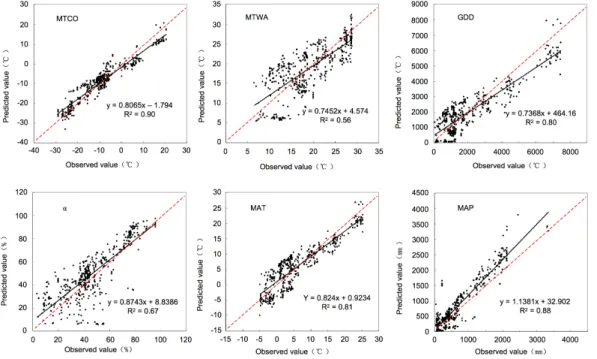
a first step, the ability of this inversion scheme to reproduce the modern climate of China is evaluated, using the 601 modern spectra available. The statistical squared correlations (R2) between actual and reconstructed climate variables at the sample sites are presented in Fig.2. These R2are very large, generally above 0.67, except for MTWA which then does not appear to be a key factor to explain the modern vegetation
25
distribution in China. The straight line between estimates and observations is expected to have an intercept of 0 and a slope of 1. The slope is slightly biased for MTWA, GDD and MAP. The intercepts are biased for MTCO, MTWA and MAT, showing a tendency
CPD
4, 213–231, 2008East Asian monsoon and paleovegetation J. Guiot et al. Title Page Abstract Introduction Conclusions References Tables Figures ◭ ◮ ◭ ◮ Back Close
Full Screen / Esc
Printer-friendly Version Interactive Discussion
to overestimate the cold climates. There is also large error in estimating MAP and α in cold desert sites of the Tibet Plateau, where α below 60% are frequently estimated below 20%, i.e. values typical of warmer deserts.
4.3 The 6000 yr BP climate
For the 6 ka BP period, the atmopsheric CO2concentration is set to 270 ppmv (EPICA,
5
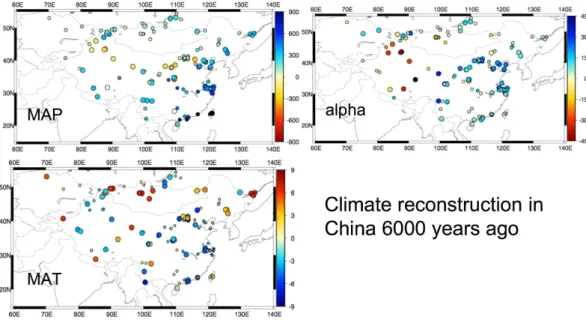
2004). The results (MAP, MAT, α) are presented as maps of anomalies versus present climate (Fig.3). Large circles indicate significant differences from the modern values. The results show that, in most of the sites at 6 ka BP, the changes in precipitation and α were significantly different from modern values, while most of temperature changes are not. This is due to the larger uncertainty on the reconstructed temperature, which
10
indicates a larger tolerance range of the vegetation to thermal variables while hydrolog-ical variables were more limiting factors. Annual temperature were generally lower than present one in southern China, but a significant warming was found over Mongolia, and a slight warming in northeast China.
Hydrological variables have a much more coherent distribution. MAP was generally
15
higher than today in southern, northeast China, and northern Mongolia, but lower or similar to today in Northwest China and North China. α was considerably higher than today in North China, and slightly higher than present in northeast China. In contrast, drier conditions are shown in northwest China and Mongolia.
Lake Bayanchagan is situated in a zone where most of the sites had a positive
20
anomaly of MAP whereas a few ones had a negative one. This is broadly consis-tent with the reconstruction of Fig. 1e where MAP was found 200 mm higher than at present. The anomaly of α for this zone is significantly positive, between +15 and 30% in agreement with Fig.1f where α was found 30% higher than at present. For these two variables, Lake Bayanchagan reconstruction provide values at the upper limit of the
in-25
verse modelling. MAT appears also higher than at present, in good agreement with the reconstruction of Fig. 1c–d. The reconstructions based on the inverse modelling are then approximately consistent with the Lake Bayanchagan, at least for the majority of
CPD
4, 213–231, 2008East Asian monsoon and paleovegetation J. Guiot et al. Title Page Abstract Introduction Conclusions References Tables Figures ◭ ◮ ◭ ◮ Back Close
Full Screen / Esc
Printer-friendly Version Interactive Discussion
surrounding sites, but the multiproxy statistical approach infers values at the wetter limit of the inverse modelling. When compared toTarasov et al. (1999), Fig. 3shows also wetter and warmer conditions on northern Mongolia and warmer and drier conditions In the central part of the country.
5 Conclusions
5
Various syntheses have been done on Chinese paleodata using various methods. All converges to reconstruct intensification of EAM in China at 6 ka BP, especially on East-ern part of China. NorthEast-ern China cores indicate an intensified monsoon between 10 and 5 ka BP. After 8 ka BP, a cooler climate induced a less strong water stress, favour-ing the largest extend of the forest. This two-step division of mid-Holocene has been
10
possible thanks to a multi-proxy approach enabling more robust inference. Neverthe-less, all approach involving modern analogues has its own limit when extrapolation is done on periods with characteristics very different from the present reference period. Then the use of mechanistic models in an inverse mode enables one to control the effect of external variables, such as atmospheric CO2.
15
The results based on inverse modelling are coherent with the previous syntheses. they show that a pattern of higher precipitation is clear on eastern half of China. On western part of China, the situation is less contrasted with higher precipitation on south-west and lower on northweast. The eastern China situation is related to enhanced summer monsoon associated with the Pacific Subtropical High bringing warm and most
20
marine air from the West Pacific Ocean to eastern China. The situation of southwest-ern China can be related to the Indian summer monsoon bringing most marine air from the Indian Ocean to southern Tibetan Plateau and southern China lowlands. North-western regions are sheltered from these monsoon changes by the Tibetan Plateau and are dominated by the Westerlies and Asian winter monsoon. Increased land-sea
25
contrast due to higher summer insolation at mid-Holocene will then influence more strongly eastern China.
CPD
4, 213–231, 2008East Asian monsoon and paleovegetation J. Guiot et al. Title Page Abstract Introduction Conclusions References Tables Figures ◭ ◮ ◭ ◮ Back Close
Full Screen / Esc
Printer-friendly Version Interactive Discussion Acknowledgements. This research has been partly funded by a grant of the French Ministry
of Research to two authors, the 5th PCRD EU project MOTIF (EVK2-CT-2002-00153), by the European Science Foundation, EUROCLIMATE/DECVEG and the French ANR PICC.
References
Alley, R. B., Mayewski, P. A., Sowers, T., Stuiver, M., Taylor, K. C., and Clark, P. U.: Holocene
5
climatic instability: A prominent, widespread event 8200 yr ago, Geology, 25, 483–486, 1997.
220
An, C., Feng, Z.-D., and Barton, L.: Dry or humid? Mid-Holocene humidity changes in arid and semi-arid China, Quat. Sci. Rev., 25, 351–361, 2006. 215
An, Z. S.: The history and variability of the East Asian paleomonsoon climate,
Quaternary-10
Science-Reviews, 19, 171–187, chinese Acad Sci, State Key Lab Loess & Quaternary Geol, Xian 710054, Peoples R China English, 2000. 215
Berger, A.: Long-term variations of caloric insolation resulting from the earth’s orbital elements, Quat. Res., 9, 139–167, 1978. 215
Braconnot, P., Loutre, M. F., Dong, B., Joussaume, S., and Valdes, P.: How the simulated
15
change in monsoon at 6 ka BP is related to the simulation of the modern climate: results from the Paleoclimate Modeling Intercomparison Project, Climate Dynam., 19, 107–121, 2002. 215
Cheddadi, R., Yu, G., Guiot, J., Harrison, S. P., and Prentice, I. C.: The climate of Europe 6000 years ago, Climate Dynam., 13, 1–9, 1996. 219
20
Cowling, S. and Sykes, M.: Physiological significance of low atmospheric CO2 for plant-climate interactions, Quat. Res., 52, 237–242, 1999.221
Davis, B. A. S., Brewer, S., Stevenson, A. C., Guiot, J., et al.: The temperature of Europe during the Holocene reconstructed from pollen data, Quat. Sci. Rev., 22, 1701–1716, 2003. 218
Dykoski, C. A., Edwards, R. L., Cheng, H., Yuan, D. X., Cai, Y. J., Zhang, M. L., Lin, Y. S.,
25
Qing, J. M., An, Z. S., and Revenaugh, J.: A high-resolution, absolute-dated Holocene and deglacial Asian monsoon record from Dongge Cave, China, Earth Planet. Sci. Lett., 233, 71–86, 2005. 220
EPICA: Eight Glacial cycles from an Antarctic ice core, Nature, 429, 623–628, 2004. 221,223
Farquhar, G. D.: Carbon dioxide and vegetation, Science, 278, 1411–1411, 1997.221 30
CPD
4, 213–231, 2008East Asian monsoon and paleovegetation J. Guiot et al. Title Page Abstract Introduction Conclusions References Tables Figures ◭ ◮ ◭ ◮ Back Close
Full Screen / Esc
Printer-friendly Version Interactive Discussion
Guiot, J., Beaulieu de, J. L., Cheddadi, R., David, F., Ponel, P., and Reille, M.: The climate in Western Europe during the last Glacial/Interglacial cycle derived from pollen and insect remains, Palaeogeography, Palaeoclimatology, Palaeoecology, 103, 73–93, 1993. 219
Guiot, J., Torre, F., Jolly, D., Peyron, O., Boreux, J. J., and Cheddadi, R.: Inverse vegetation modeling by Monte Carlo sampling to reconstruct palaeoclimates under changed
precipita-5
tion seasonality and CO2conditions: application to glacial climate in Mediterranean region, Ecological Modelling, 127, 119–140, 2000.221,222
He, Y., Theakstone, W., Zhang, Z., Zhang, D., Yao, T., Chen, T., Shen, Y., and Pang, H.: Asynchronous Holocene climatic change across China, Quat. Res., 61, 52–63, 2004. 215
Jiang, W., Guo, Z., Sun, X., Wu, H., Chu, G., Yuan, B., Hatt ´e, C., and Guiot, J.:
Reconstruc-10
tion of climate and vegetation changes of Lake Bayanchagan (Inner Mongolia): Holocene variability of the East Asian monsoon, Quat. Res., 65, 411–420, 2006. 215,218
Jolly, D. and Haxeltine, A.: Effect of low glacial atmospheric CO2 on tropical African montane vegetation, Science, 276, 786–788, 1997. 221
Joussaume, S. and Taylor, K.: Status of the PMIP, Proceedings of the First International AMIP
15
Scientific Conference, WMO, Geneva, 425–430, 1995. 215
Liu, H. Y., Xu, L. H., and Cui, H. T.: Holocene history of desertification along the woodland-steppe border in northern China, Quat. Res., 57, 259–270, 2002.219
Magny, M., Guiot, J., and Schoellammer, P.: Quantitative reconstruction of Younger Dryas to mid-Holocene paleoclimates at Le Locle, Swiss Jura, using pollen and lake-level data, Quat.
20
Res., 56, 170–180, 2001.219
MCPD: (Members of China Quaternary Pollen Database) Pollen-based Biome Reconstruction at Middle Holocene (6 ka BP) and Last Glacial Maximum (18 ka BP) in China, J. Integrative Plant Biology, 42, 1201–1209, 2000. 221
MCPD: (Members of China Quaternary Pollen Database) Simulation of China Biome
Recon-25
struction Based on Pollen Data from Surface Sediment Samples, J. Integrative Plant Biology, 43, 201–209, 2001.221
Prentice, I. C. and Jolly, D.: Mid-Holocene and glacial-maximum vegetation geography of the northern continents and Africa, J. Biogeography, 27(3), 507–519, 2000. 221
Prentice, I. C., Cramer, W., Harrison, S. P., Leemans, R., Monserud, R. A., and Solomon, A. M.:
30
A global biome model based on plant physiology and dominance, soil properties and climate, J. Biogeography, 19, 117–134, 1992. 218,220
CPD
4, 213–231, 2008East Asian monsoon and paleovegetation J. Guiot et al. Title Page Abstract Introduction Conclusions References Tables Figures ◭ ◮ ◭ ◮ Back Close
Full Screen / Esc
Printer-friendly Version Interactive Discussion
palaeoecological data: A general method and its application to European pollen data at 0 and 6 ka, Climate Dynam., 12, 185–194, 1996. 222
Ren, G. Y. and Beug, H. J.: Mapping Holocene pollen data and vegetation of China, Quat. Sci. Rev., 21, 1395–1422, 2002.216
Rohling, E. J. and Palike, H.: Centennial-scale climate cooling with a sudden cold event around
5
8,200 years ago, Nature, 434, 975–979, 2005.220
Seret, G., Guiot, J., Wansard, G., Beaulieu, J. L. D., and Reille, M.: Tentative Palaeoclimatic Reconstruction Linking Pollen and Sedimentology in La Grande Pile (Vosges, France), Quat. Sci. Rev., 11, 425–430, 1992. 219
Shao, X., Wang, Y., Cheng, H., Kong, X., Wu, J., and Lawrence, E.: Long-term trend and
10
abrupt events of the Holocene Asian monsoon inferred from a stalagmite δ18O record from Shennongjia in Central China, Chinese Sci. B., 51, 221–228, 2006. 220
Shi, Y. F., Kong, Z. Z., Wang, S. M., Tang, L. Y., Wang, F. B., Yao, T. D., Zhao, X. T., Zhang, P. Y., and Shi, S. H.: Mid-Holocene Climates and Environments in China, Global Planet. Change, 7, 219–233, 1993. 215,219
15
Tarasov, P. E., Webb, T. I., Andreev, A. A., Afanas’ Eva, N. B., Berezina, N. A., Bezusko, L. G., Blyakharchuk, T. A., Bolikhovskaya, N. S., Cheddadi, R., Chernavskaya, M. M., Chernova, G. M., Dorofeyuk, N. I., Dirksen, V. G., Elina, G. A., Filimonova, L. V., Glebov, F. Z., Guiot, J., Gunova, V. S., Harrison, S. P., Jolly, D., Khomutova, V. I., Kvavadze, E. V., Osipova, I. M., Panova, N. K., Prentice, I. C., Saarse, L., Sevastyanov, D. V., Volkova, V. S., and
20
Zernitskaya, V. P.: Present-day and mid-Holocene biomes reconstructed from pollen and plant macrofossil data from the former Soviet Union and Mongolia : Global change – BIOME 6000, J. Biogeography, 25, 1029–1053, 1998.221
Tarasov, P. E., Guiot, J., Cheddadi, R., Andreev, a. A., Bezusko, L. G., Blyakharchuk, T. A., Dorofeyuk, N. I., Filimonova, L. V., Volkova, V. S., and Zernitskaya, V. P.: Climate in Northern
25
Eurasia 6000 Years Ago Reconstructed From Pollen Data, Earth Planet. Sci. Lett., 171, 635– 645, 1999.217,224
Wang, B., Clemens, S., and Liu, P.: Contrasting the Indian and East Asian monsoons: implica-tions on geologic timescales, Mar. Geology, 201, 5–21, 2003. 215
Wei, K. and Gasse, F.: Oxygen Isotopes in Lacustrine Carbonates of West China Revisited:
30
Implications for Post Glacial Changes in Summer Monsoon Circulation, Quat. Sci. Rev., 18, 1315–1334, 1999. 215
CPD
4, 213–231, 2008East Asian monsoon and paleovegetation J. Guiot et al. Title Page Abstract Introduction Conclusions References Tables Figures ◭ ◮ ◭ ◮ Back Close
Full Screen / Esc
Printer-friendly Version Interactive Discussion
Last Glacial Maximum and mid-Holocene: reconstruction from pollen data using inverse vegetation modelling, Climate Dynam., 29, 211–229, 2007. 216,221,222
Xiao, J. L., Xu, Q. H., Nakamura, T., Yang, X. L., Liang, W. D., and Inouchi, Y.: Holocene vegetation variation in the Daihai Lake region of north-central China: a direct indication of the Asian monsoon climatic history, Quat. Sci. Rev., 23, 1669–1679, 2004. 219
5
Yu, G., Prentice, I. C., Harrison, S. P., and Sun, X. J.: Pollen-based biome reconstructions for China at 0 and 6000 years, J. Biogeography, 25, 1055–1069, 1998. 217,220
Yu, G., Xue, B., Liu, J., and Chen, X.: LGM lake records from China and an analysis of climate dynamics using a modelling approach, Global Planet. Change, 38, 223–256, 2003.217,220
Zhou, W. J., Yu, X. F., Jull, A. J. T., Burr, G., Xiao, J. Y., Lu, X. F., and Xian, F.: High-resolution
10
evidence from southern China of an early Holocene optimum and a mid-Holocene dry event during the past 18,000 years, Quat. Res., 62, 39–48, 2004. 220
Zhou, W. J., Xie, S. C., Meyers, P. A., and Zheng, Y. H.: Reconstruction of late glacial and Holocene climate evolution in southern China from geolipids and pollen in the Dingnan peat sequence, Organic Geochemistry, 36, 1272–1284, 2005. 220
CPD
4, 213–231, 2008East Asian monsoon and paleovegetation J. Guiot et al. Title Page Abstract Introduction Conclusions References Tables Figures ◭ ◮ ◭ ◮ Back Close
Full Screen / Esc
Printer-friendly Version Interactive Discussion
Fig. 1. Comparison of a few proxies ans the climatic reconstructions in Lake Bayanchagan (Inner Mongolia, China). (A) tree scores, i.e. sum of the square root of the arboreal taxa percentages; (B) first principal component of the three proxies (total pollen concentrations,
Pediastrum concentrations and δ18O of authigenic carbonate); (C) mean temperature of the coldest month reconstruction; (D) mean temperature of the warmest month reconstruction; (E) total annual precipitation; (F) α, the ratio between actual and equilibrium evapotranspiration. The climate reconstructions are represented with the uncertainties, given by the range of the analogues. After Jiang et al. (2008)1.
CPD
4, 213–231, 2008East Asian monsoon and paleovegetation J. Guiot et al. Title Page Abstract Introduction Conclusions References Tables Figures ◭ ◮ ◭ ◮ Back Close
Full Screen / Esc
Printer-friendly Version Interactive Discussion
Fig. 2.Validation of the inverse BIOME4 modelling on the 601 samples of the modern database of China and Eurasia. The six reconstructed variables are compared to the observed climate: MTCO (mean temperature of the coldest month reconstruction), (MTWA) mean temperature of the warmest month reconstruction, (GDD) growing degree days abve 5C, (α), the ratio between actual and equilibrium evapotranspiration, (MAT) mean annual temperature, (MAP) total annual precipitation.
CPD
4, 213–231, 2008East Asian monsoon and paleovegetation J. Guiot et al. Title Page Abstract Introduction Conclusions References Tables Figures ◭ ◮ ◭ ◮ Back Close
Full Screen / Esc
Printer-friendly Version Interactive Discussion
Fig. 3.Reconstruction of the climate in China 6000 years ago using inverse modelling method: (α), the ratio between actual and equilibrium evapotranspiration, (MAT) mean annual tempera-ture, (MAP) total annual precipitation.