MITLibraries
Document Services
Room 14-0551. 77 Massachusetts Avenue Cambridge, MA 02139 Ph: .617.253.5668 Fax: 617.253.1690 Email: docs@mit.eduhttp://libraries. mit. edu/docs
DISCLAIMER OF
QUALITY
Due to the condition of the original material, there are unavoidable
flaws in this reproduction. We have made every effort possible to
provide you with the best copy available. If you are dissatisfied with
this product and find it unusable, please contact Document Services as
soon as possible.
Thank you..
Some pages in the original document contain pictures,
graphics, or text that is illegible.
The Determinants of REIT Franchise Value
A Reprise
by
Rossana Santos-Wuest
M. Arch., Yale University, 1989 B.S. Arch., University of Virginia, 1984
Submitted to the Department of Architecture In Partial Fulfillment of the Requirements for the Degree of
Master of Science in Real Estate Development at the Massachusetts Institute of Technology September, 2000
The author hereby grants MIT permission to reproduce and to distribute publicly this paper and electronic copies of this thesis document in whole or part.
Copyright 2000 Rossana Santos-Wuest All Rights Reserved
Signature of Author Department of Architecture August 14, 2000
' -' '"; Certified by W.'od McGrath
Lecturer, Department of Urban Studies and Planning
Accepted by William C. Wheaton Chairman, Interdepartmental Degree Program
Determinants of REIT Franchise Value - A Reprise
by
Rossana (Cherie) Santos-Wuest Submitted to the Department of Architecture
On August 14, 2000 in partial fulfillment of the requirements for The Degree of Master of Science in Real Estate Development
'THESIS ABSTRACT
This paper re-examines the determinants of REIT franchise values, which were defined and studied in a previous MIT thesis by Jim Young for a representative group of apartment and office REITs in 1998'. Franchise value was specifically defined as the Premium-to-Net Asset Vaue (NAV) at which most REITs trade.
In broader terms, franchise value is often defined as the present value which management is expected to add in terms of net revenue growth to shareholders. A more specific definition of franchise value was presented in the previous thesis, and a model constructed, in which the internal and external structural components were quantified, to determine their impact on
franchise value. The same econometric model is applied today to pooled data from '97 and '99,
against the backdrop of a different market environment, to verify which components continue to play a significant role on a REIT's franchise value over a broader market cycle.
Independent variables are developed as proxies for the components of the franchise value, and are regressed against alternate specifications of franchise value (the dependent variable). The dependent variables used in this study are the REITs' Premium-to-Net Asset Vaue (NAV) and Price to Funds From Operations (FFO) multiple for the sample of office and apartment REITs. The results show that regional economic concentrations, measures of balance sheet strength, visibility, management experience and conflict of interest mitigations are statistically significant factors which contribute to franchise value.
More significantly, this thesis discovered that the relationship between the alternate specification of the dependent variable, the Price-to-FFO multiple, and the independent variables is more conclusive than it is for the Premium-to-NAV specification of the dependent variable. This suggests that perhaps over time, the more objective measure of the Price-to-FFO multiple produces a better measure of franchise value than does the more commonly used Premium-to-NAV (which is a more subjective measure of a REIT's portfolio value, and depends on a multitude of assumptions for which there is little consensus at the present time).
Thesis Supervisor: W. Tod McGrath
Acknowledgements
I would like to thank the following people who have been instrumental in assisting me in the completion of this thesis:
Jim Young - whose groundwork, good grace, and generosity helped me to forge
through all stages of this thesis;
Matt Ostrower - whose patience and consideration was boundless during the data
collection process;
Yaniv Teper - whose personal and professional support taught me the value of MIT
alumni membership; and
Mark Wuest - whose critical input and constant encouragement carried me through
TABLE OF CONTENTS THESIS ABSTRACT ... ... 1... ACKNOWLEDGEMENTS ... 2 TABLE OF EXHIBITS ... 4 TABLE OF APPENDICES ... 4 1.0 INTRODUCTION ... 5
1.1 CONTEXT OF REIT MARKETS, Y2K ... 6
1.2 RESEARCH ISSUE ... 1...0...
1.3 CHANGES IN INVESTOR PERCEPTION OF PUBLIC REAL ESTATE VALUES ... 11
2.0 RESEARCH METHODOLOGY ... 13
2.1 1998 THESIS ... 1...3...
2.2 CAPITAL MARKETS RESEARCH ... 14
2.3 LITERATURE REVIEW ... 1...5...
3.0 STATISTICAL COMPONENTS OF FRANCHISE VALUE EXAMINATION ...17
3.1 STATISTICAL SAMPLE ... 1...7...
3.2 DEPENDENT VARIABLES ... 18
3.3 INDEPENDENT VARIABLES ... ... ... ... 20
4.0 REGRESSION RESULTS ... 31
4.1 1997-1999 REGRESSIONS AGAINST PRICE-TO-FFO MULTIPLE - REVIEW OF STATISTICALLY SIGNIFICANT VARIABLES ... 34
4.2 1997-1999 REGRESSIONS AGAINST PRICE-TO-FFO MULTIPLE - REVIEW OF NON-STATISTICALLY SIGNIFICANT VARIABLES ... 38
4.3 VARIABLES NOT INCLUDED IN THE FINAL ANALYSIS ... 40
5.0 CONCLUSIONS ... 42
5.1 FINDINGS / CONCLUSIONS ... 42
5.2 ADDITIONAL STUDIES SUGGESTED BY THESE CONCLUSIONS ... 45
Table of Exhibits Exhibit 1: Exhibit 2: Exhibit 3: Exhibit 4: Exhibit 5: Appendix 1: Appendix 2: Appendix 3: Appendix 4: Appendix Appendix Appendix Appendix Appendix Appendix Appendix Appendix
Premium-to-NAV and Price-to-FFO Multiples ... 18
Independent Variable Descriptive Statistics . ...21
Summary of Regression R-Squared Values ... 31
Summary of '97-'99 Regression Results ... 33
Overview of Statistical Results for Comparison ... 43
Table of Appendices 1999 Premium-to-NAV Calculation ... 48
1999 Price-to-FFO Multiple Calculation ... 49
Independent Variables Database ... 50
Apartment REIT Regional Concentration ... 52
Office REIT Regional Concentration ... 53
'97-'99 Regression Results/NAV Premium & Orig. Variables ...54
'97-'99 Regression Results/NAV Premium & Orig.+ New Variables ...55
'99 Regression Results/Price-to-FFO Multiple & Orig. Variables ... 56
'99 Regression Results/Price-to-FFO Multiple & Orig.+ New Variables ...57
'97-'99 Regression Results/Price-to-FFO Mult. & Orig. Variables ... 58
'97-'99 Regression Results/Price-to-FFO Mult. & Orig.+ New Variables ... 59
Hartzell, Shulman, Wurtzebach Economic Region Definition ...60
Capital Deployment Consensus Calculation ... 62 5a: 5b: 6a: 6a: 7a: 7b: 8: 9:
1.0 Introduction
The purpose of this paper is to re-examine the determinants of REIT franchise values, which were defined and studied in a previous MIT thesis by Jim Young for a representative group of apartment and office REITs in 19982. Franchise value was defined as the Premium-to-Net Asset Vaue (NAV), at which most REITs trade. In broader terms, franchise value is the additional value, as reflected by its stock price, that management is expected to add in terms of net revenue growth to shareholders.
In this paper, franchise value will be measured in two ways. The first is according to the previous specification of premium/discount to NAV, which is the value of the company in relation to net asset value of the company's property holdings. Net asset value is defined as the "liquidation value" assigned to a REIT's real estate holdings and is an arguably an imprecise figure, because it is based on assumptions of cap rates, growth rates, discount rates, projected earnings and other economic forecasts. The second is the Price-to-FFO multiple, which purports to be a relative
measure of the REIT's earning power, based on actual income from properties, joint ventures and fees. The Price-to-FFO multiple is not tied to the value of any
particular portfolio asset(s) in any way. To the extent that a REIT is a going concern that can buy, sell and invest in real estate products in the marketplace, and not a closed-end fund, the Price-to-FFO multiple is deemed to be an alternative
measure of franchise value.
This 2000 thesis will refresh the relevant data as of 4th quarter 1999 and try to
empirically explain the premium or discount to which REITs trade relative to their NAV as well as their Price-to-FFO multiples. Several new explanatory variables will be added to ones used in the previous model as a way of investigating other
aspects of the market that may inform the pricing levels of REITs today.
Data from 1997 and 1999 will be merged, in an effort to "normalize" results from data gathered from both "bull" and "bear" markets. This thesis will also test the model with new variables against the 1999 data alone. These studies will seek to determine whether the model, which was applied successfully when REITs were
trading at substantial premiums to their NAVs, is as statistically compelling, under much different market climates, as well as over a longer term.
1.1 Context of REIT Markets, Y2K
The previous thesis on REIT Franchise Value in 1998 was conducted during a
period in which REIT stock values were trading at 20 to 30% premiums to
NAV3. At the time, there were 210 REITs with an equity market capitalization
of $140.5 billion.4 Among the group of 42 Apartment and Office REITs
included in this study 2 years ago, the mean premium was 17.2% to their
Net Asset Values (NAVs).5 Two years later (as of December 31, 1999), the
equity market capitalization of REITs has diminished to $124.3 billion6, and
the 36 remaining REITs7 in the study were trading at a mean discount of
20% to their NAVs. There has been a recent upturn in the REIT equity market as of the 2nd quarter of 2000; however there is much speculation as to its significance and duration. As such, it will not be addressed in this thesis.
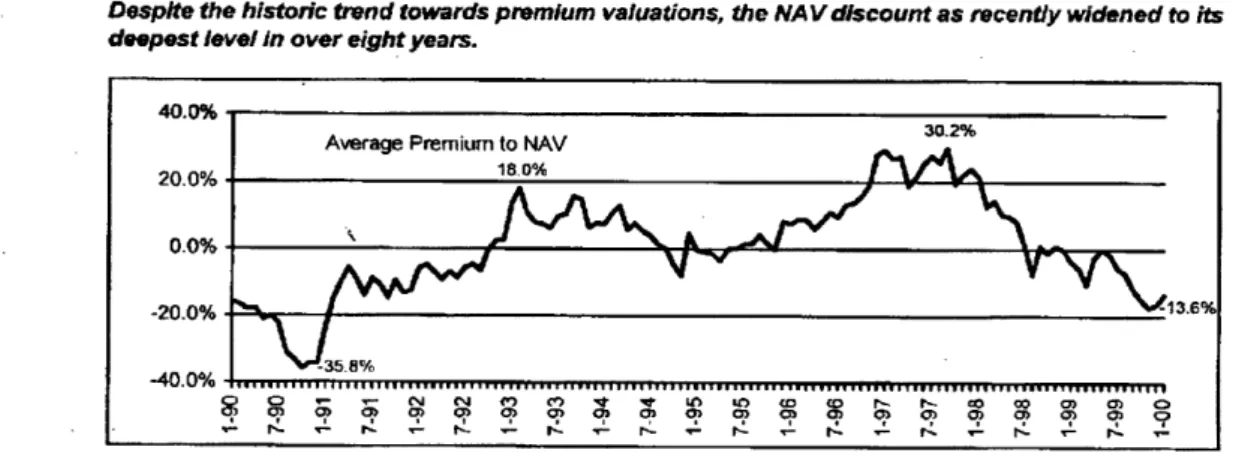
Relative Pricing: REITs versus Real Estate, Bonds and Stocks
Despite the historic trend towards premium valuations, the NAVdiscount as recently widened to its
deepest level in over eight years.
40.0%
Average Premium to NAV 30.2%
20.0% 180%
0.0% 6
--20.0% ' 13.
-40.S0%o
6:8cn' a T T ~ 6 o,
Figure 1.1 Relative Pricing of REIT returns to NAV
REIT prices started plummeting in the first quarter of '98, an event that was
escalated by the Russian debt crisis and its effects on the credit markets8,
among other variables. Until quite recently, REIT stock values have been trading at substantial discounts to NAV, and although public real estate
markets have recovered some ground in the first half of 2000, these have not reached the same levels nor have they seen the same growth as that seen between '97 and '98. This scene has been played against the backdrop of the steady growth in the nation's economy and continued strong
fundamentals in most real estate markets.
Many analysts have attributed this drop in stock valuation to revised growth expectations for the companies. However, there is also some ad hoc
evidence that entire industry has been affected as a result of
macro-economic issues, such as the Russia's default, the Asian crisis and Brazil's threatened devaluation and the combined effects of these events on credit
markets.9 In addition, the exponential stock valuation growth of the
high-tech equity markets, as evidenced by the surge in the NASDAQ composite index over the past year, has also contributed to the malaise in the Real Estate markets. Nor has the Real Estate industry been singled out-weekly articles in the Wall Street Journal lament the flow of funds from more established "old economy" stocks to riskier and less well-known "new economy" stocks that have seen stock valuations shoot through the stratosphere.
In addition, there has been an ongoing trend of REIT consolidation since 1995 as companies merge in an effort to expand growth prospects in new
areas and to create synergies through greater economies of scale0. Among
the REITs studied, several have consolidated. These are:
* Avalon Communities Trust (AVS) and Bay Apt. Communities (BYA)
consolidated into Avalon Bay (AVB);
* Merry Land Investments Inc. was acquired by Equity Residential Trust
(EQR) in early '99;
* Cornerstone Properties (CPP) was acquired by Equity Office Properties
(EOP) early in 2000 (Cornerstone data is included in this study, as the
acquisition was not yet complete as of 4th quarter 1999 and the data
* Security Capital Pacific Trust (PTR) and Security Capital Atlantic Inc. (SCA) merged into Archstone Communities Trust (ASN) in '99; and
* Walden Residential Properties Inc. (WDN) was acquired by Olympus in
March '00.
The increasing liquidity of the private Real Estate markets combined with the inherent inflexibility of the REIT tax structure have also contributed to de-REITings. Some examples of these within the previous thesis' study pool include"1:
* Berkshire Realty Company Inc. (BRI)
* Irvine Apt. Communities Inc. (IAC)
Others that have deREITed and have not been included in the study are:
* Starwood Hotels (converted from paired share to C-Corp in Jan '99)
* Sunstone Hotel (SSI)
* Wyndham Hospitality
Today, REIT growth and acquisitions have leveled off-in part as result of most companies' inability or lack of desire to raise funds in the public
markets, given their discounted valuations, and in part as a result of evolving expectations by investors. Many analysts note that REIT stock prices did start lagging behind the general market early in 1998 (allegedly betraying
investor disaffection1 2), however, this was only part of the story. The
Russian crisis' effects on the CMBS and REIT debt markets has largely curtailed the availability of debt, unsecured or otherwise, and has had an effect as well on the REIT equity sector's growth from development and
Figure I
Morgan Stanley REIT Index (RMS) vs. the S&P 500 - Total Returns
Data: 7/95 through 2/00) .-tg 25. 1995 = 100
Fig. 1.2 MSDW REIT Index vs. the S&P 5000 - Total Returns
Following the global financial panic and ensuing devaluation of REIT stock prices, public market investors reassessed the desirability of investing further in these stocks, which may explain why REIT equity shares have not
rebounded in value along with the broader equity markets. In fact,
unsecured REIT debt issuance for the first five months of 2000 totaled about $1.4 billion, down sharply from approx. $6.3 and $5.9 billion for the same periods in 1999 and 1998, respectively.14 The implications of this are that
REIT managers have found the proportion of debt in their capital structure and/or relative cost of debt too high, which is partly due to other corporate sectors that have borrowed record sums in 1999 and the first half of 2000, which has further driven up the cost of debt.
As a result, REITs have grown adept at finding alternate financing methods that increase FFO/share without tapping the public markets. While there
have been issuances to meet ongoing capital needs, REITs by and large have
been using joint ventures, property sales and preferred equity to finance growth. One example of this would be recent efforts by JDN Realty Corp.,
which, in 1999, sold several of its "non-premium" properties in the context of
a fairly liquid real estate market.15 "What we want to try to get away from are levering up and (making) new equity issuances," says Charles Talbert, director of investor relations for JDN. "Both of those, debt and equity, have
been prohibitively expensive over a year and a half because investors have cut off REITs from raising equity and issuing additional debt...to become
self-funding is a way to eliminate going to the volatile capital markets."16 The
company's asset-recycling program initially resulted in a drop in stock price, but analysts thereafter gave the company a positive prognosis as a result of these efforts.
REITs have also done off-balance sheet financing for development. Typically a REIT contributes limited equity to a joint partnership venture to facilitate development. This process is not well-disclosed and difficult to measure, as
some REITs have chosen to reveal these financial transaction in their 10Qs,
while many do not. Also, the amount of debt and its resultant effect on "consolidated " financial statements are not clearly revealed.
Other strategies include tax deferral through property "swaps", as used by Summit Properties, which employs 1031 exchanges (swap of properties) or
3rd party exchanges, which result in tax-deferred capital gains on their
property acquisitions.
1.2 Research Issue
The purpose of this research is: (a) to verify whether the same components of "franchise value" remain statistically significant in determining REIT equity valuations over time and against current pricing; and (b) to determine
whether other measures of franchise value, (e.g. FFO Multiple, AFFO Multiple, Net Income multiple, etc.) have a stronger relationship to the presumed components of franchise value, and (c) to posit other possible explanations for new valuations given today's equity market climate. A few new variables will be introduced to test these theories, within the scope of their
contribution (or detraction) to REIT's franchise value. These additional variables will focus on components that measure REIT growth, as well as the REIT management's ability to create value in the current business
environment. Other variables which measure broader market forces (such as public sentiment, the performance of high-tech equity stocks over fixed
income stocks, etc.) were discussed and considered for study as well, but were deemed as being difficult to measure within the context of this thesis, and do not directly contribute to a REIT's measure of franchise value.
1.3 Changes in Investor Perception of Public Real Estate Values
Some possible explanations for trail-off in REIT stock values may be due to changes in investors' perceptions of the space markets. As vacancies drop, investors may think that the markets have entered a development phase (as opposed to the overbuilt or slow absorption phases). During this phase, occupancy, rents and prices are unlikely to rise in magnitude as they did in earlier phases, as new properties begin to come online. Investors are forward looking and anticipate that the added supply would limit future
income growth, as development typically lags behind vacancy rates.'7
.% Millions of sq. ft. 140 120 100 80 60 40 20 n 1967 1972 1977 1982 1987 1990
: Vacancy Rate - Construction --- Employment Growth
FIGURE 1.3 Office employment growth, vacancy rate, and
construction, 1967-1990.
These data are aggregated from 30 metropolitan areas.
Source: Employment, adjusted U.S. government figures courtesy of Regional Financial
Associates, Bala-Cynwyd, PA; vacancy and construction, CB Commercial.
Related to this anticipation is the lingering memory in investor's minds of the overbuilding in '80s and its long-term effects on the market. Finally, there is the unknown factor in investors' minds regarding the impending space
requirements of a new economy, which promises greater mobility and flexibility in the work arena, and possibly less required office space. As mentioned earlier, fundamental changes in stock market investor
attitudes have also caused a shift in the equity markets from the real estate sectors to higher growth stocks. This may in part be influenced by the evolving structure of ownership of commercial property--from traditional partnerships between developers and institutional investors, who typically hold properties long-term--to stock market investors, who expect greater liquidity and have shorter investment horizons. These investors expect higher yields and faster growth, as do fund managers, who are judged on quarterly performances. All this sets the stage for greater volatility of REIT
share prices, compared to direct property prices.18
It is also possible that investors now realize that the real estate industry is mature industry and not a traditional growth stock. Again, many claim that investors are flocking to higher expected total returns provided by other growth stocks in equity sector. Prospects for rapid growth in real estate values--that is, in the total amount of real estate acquired or built--are much lower than prospects for growth in other industries. As expected growth is deemed by many in the industry as the primary driver of the (anemic) performance of the REIT stocks over the past two years, the new variables added in this thesis will focus on those components of REIT franchise value (e.g. capital deployment levels, reduction in vacancy levels, number of recent equity issuances, management turnover, etc...) which influence growth in company size, revenues and per-share operating performance.
2.0 Research Methodology
2.1 1998 Thesis
The previous study defined the components of REIT "Franchise value" as the "premiums to net asset value at which most REITs currently trade."9 These
premiums were then quantified and empirically examined to statistically explain the components of such franchise value. Numerous independent variables were chosen to represent proxies for the components of franchise value, and were statistically measured to evaluate their impact on the
dependent variables of REIT stock premiums (Stock price/NAV - 1). With a
few additional variables added to existing ones used in the previous model, a similar format and methodology will be used in this study to try to compare the results of regressions in a meaningful way across the two years spanning
a peak and trough in REIT share pricing.
Franchise Value Components
Franchise Value, as defined in this thesis, is based on 3 basic categories and
their respective criteria20:
* Internal/External Structural - Business strategy focus, Regional &
Product type, Asset Diversification, Growth opportunities (expanded to include capital deployment levels and changes in vacancy levels), Balance sheet strength (expanded to include firms' ability/proclivity to offer new stock issuances) Visibility, and Low overhead;
* Human Resources - Visionary leadership, Experienced management
(including any changes in management which may signal a shift in direction in management), Organizational structure (UPREIT yes/no), Organizational culture; and
* Governance - Conflicts of interest, Incentive based compensation
2.2 Capital Markets Research
Research into the changes in the Capital Markets that ultimately impacted REITs was conducted during the course of studies for Prof. Tim Riddiough's
Real Estate Capital Markets class at MIT. The evolution of events leading to
the global credit crisis due to Russia's default, management incentives to add value to each company, the return of private pension fund investors to the real estate capital markets, as well as methods of calculating the growth and strength of REITs in an evolving public market were among specific issues that were discussed and analyzed in the course. Some offshoots of these studies produced new variables for this thesis:
* Price-to-FFO Multiple - In the previous study, the FFO multiple (stock
price per share/FFO per share) was considered as an alternate dependent variable, but was discounted for its lack of correlation to NAV, especially in the office sector. The use of this number as an alternate specification for dependent variable will be reassessed in this study.
* Price-to-AFFO Multiple - The Price-to-AFFO multiple will also considered
in this study as an alternate dependent specification. AFFO attempts to correct the FFO's definitional shortcomings by addressing the omission of depreciating assets, recurring capital items such as leasing
commissions, and the vagaries of floating rate debt and principal
payments. In general, it has become used more often for its capacity to indicate future operating cashflows for the company.
* Price-to-Net-Income Multiple - Additionally, the Price-to-Net-Income
multiple is studied as a possible dependent variable to measure company valuation through earnings growth. Its strengths and weaknesses will be discussed more comprehensively below.
All data for NAV and independent variables are culled from similar sources as
10K filings, Proxy statements and internet market links, various real estate analysts' reports and models, NAREIT and SNL data, were used to populate the variable database. As much as possible, a single, standardized source was used for all data involving quantitative valuation of earnings, returns and pricing.
2.3 Literature Review
Literature pertaining to REIT franchise value and pricing are addressed in several articles cited below. Other empirical research articles and studies are
cited in the previous thesis.2
Empirical Research
Hartzell, Heckman and Miles, "Diversification Categories in Investment
Real Estate," AREUEA Journal 14, pp. 230-254, 1986 and Hartzell,
Shulman and Wurtzebach, "Refining the Analysis of Regional
Diversification of Income-Producing Real Estate, " Journal of Real Estate Research 2, pp. 85-89, 1987. These articles propose the categories and relative benefits of regional and property type diversification within real estate. The eight product and geographic boundary categories are incorporated into a variable to determine whether these diversification measurements are significant to franchise value in this thesis.
Publications from Independent Research Firms
Green Street Advisors, Inc. article on "REIT Pricing-An Update of Our
Pricing Model'", 1/20/00. This updated model breaks pricing into two
major components: the first is NAV derived by marking to market value of real estate and other balance sheet items; the second is non-empirical value added or subtracted due to the ability of management working in current business environment to create value and/or structural or balance sheet features that may detract from value. While the Green Street
article is critical of NAV as pricing measure by itself, it does validate the use of NAV as an estimate of firm value, which is forward looking in that it
incorporates future risks and internal growth prospects. To address its limitations, the Green St. model subjectively incorporates many of the qualitative governance and conflicts of interest variables used in this
Regression study.
Green Street Advisors, Inc. article on "The High Cost of Owning Real
Estate", 9/29/99. Although it acknowledges the improvement of FFO and
AFFO figures compared to NAV, this article is nevertheless critical of these measurements and proposes Adjusted Net Income as a gauge which "comes closer to the economic truth" about performance measures. It
posits that Net Income appropriately captures the appreciation of real estate through higher revenues and the costs of realizing this appreciation through depreciation. A summary of its merits and weaknesses is
presented below:2 2
* Flaws include: Short (40-year) depreciation schedule does not apply to most buildings; owners with older properties have artificially low
book value for properties due to this abbreviated schedule; Net Income straightlines rents and includes gains on sales, as does its cousin, FFO.
* Strengths include: Recognizes that real estate depreciates. By adding back all real estate depreciation in the computation of FFO, the REIT industry is guilty of ignoring this very real, and very material, expense. The depreciation of the buildings and improvements that shows up in
net income is, conceptually, a very close cousin to the "cap ex"
(capital expenditure) reserves applied by most credible analysts when they compute AFFO/CAD. Thus, from a theoretical context, Net Income is a much better performance measure than FFO, because it
better matches revenues and expenses, as well as projects growth in
3.0 Statistical Components of Franchise Value Examination
3.1 Statistical Sample
Of the 42 REITs included in the prior study, only 36 REITs remain in the
current study "pool" after the de-REITs and acquisitions of the past two years. 2 REITs have been substituted in this study: Avalon Bay (AVB), the result of the merger between Avalon Properties and Bay Apartment
Communities; and Archstone (ASN), which forged the merger between Security Capital Pacific Trust (PTR) and Security Capital Atlantic Inc. (SCA). Merry Land Investments Inc. (MRY), acquired by Equity Residential (EQR) and Walden Residential Properties Inc. (WDN), acquired by Olympus in early 2000, have been dropped from the study. Two companies have deREITed: Berkshire Realty Company Inc. (BRI) and Irvine Apartment Communities Inc. (IAC). These companies have been removed from the study as well. The total sampling of 36 is smaller than the original sampling, though it is considered sufficient to provide statistical data for the office and apartment sectors. The sampling of original 42 REITs were office and apartment REITs existing in '98 and are considered representative sample of public REITs in
those sectors. Today there are a total of 48 apartment and office REITs24,
however, for the sake of comparison of data across time, we have not included those REITs which were not included in the original sampling. In conducting this study, the identified characteristics of the REITs will be regressed against the dependent variable specified (NAV premium, Price-to-FFO multiple, price to APrice-to-FFO multiple or price to Net Income multiple) as a group, with statistical findings summarized. The data from the 1997 study and the 1999 study will be "cross-pooled" into one statistical data set to verify whether the variables have the same or similar impact on the
alternative specifications for the dependent variables over the two-year cycle between 12/31/97 and 12/31/99.
3.2 Dependent variables
Premium-to-NAV as of 12/31/99. Portfolio net asset valuation is imprecise in that it is based on different assumptions applied by several analysts. To minimize inherent variances in the individual calculations, a mean NAV,
composed of the average net asset value from 6 different analysts, is used to calculate the premiums/discounts. Data is for December 31, 1999 out of
research reports from six sources, as shown in Exhibit below25.
Exhibit 1
Premium-to-NAV and Price-to-FFO Multiples as of December 31, 1999
Office and Apartment REITS Ticker NAV Price to
Prem FFO Mult
Associated Estates Realty Corporation AEC 74.36% 5.56
Apartment Investment and Management Company AIV 96.82% 10.18
Amli Residential Properties Trust AML 83.22% 8.18
Arden Realty Inc. ARI 74.00% 7.72
Archstone Communities Trust ASN 84.33% 10.66
Avalon Bay AVB 82.86% 10.78
Brandywine Realty Trust BDN 73.57% 7.06
Bedford Property Investors, Inc. BED 73.55% 8.07
BRE Properties, Inc. BRE 81.57% 9.93
Boston Properties, Inc. BXP 84.16% 11.36
Mack-Cali Realty Corporation CLI 73.98% 8.29
Cornerstone Properties, Inc. CPP 73.98% 9.40
Camden Property Trust CPT 80.71% 8.90
CarrAmerica Realty Corporation CRE 81.43% 8.54
Duke-Weeks Realty Corp. DRE 68.53% 9.26
Equity Office Properties Trust EOP 86.12% 10.19
Equity Residential Properties Trust EQR 82.75% 9.93
Essex Property Trust, Inc. ESS 88.58% 10.63
Gables Residential Trust GBP 84.55% 8.84
Great Lakes REIT, Inc. GL 74.26% 3.03
Highwoods Properties, Inc. HIW 68.57% 7.24
Home Properties of New York, Inc. HME 79.23% 10.14
Koger Equity, Inc. KE 68.01% 7.28
Kilroy Realty Corporation KRC 81.18% 9.17
Mid-America Apartment Communities, Inc. MAA 78.75% 8.75
Parkway Properties, Inc. PKY 86.41% 8.64
Prentiss Properties Trust Inc. PP 73.58% 7.45
Post Properties, Inc. PPS 86.05% 10.58
Reckson Associates Realty Corporation RA 78.25% 9.30
SL Green Realty Corp. SLG 75.07% 10.28
Summit Properties, Inc. SMT 74.44% 8.30
Spieker Properties, Inc. SPK 83.76% 10.92
Charles E. Smith Residential Realty, Inc. SRW 87.15% 11.17
Cornerstone Realty Income Trust Inc. TCR 75.17% 8.17
Town and Country Trust TCT 107.23% 9.15
2000 est. Price-to-FFO Multiple-This had been considered as an alternate
specification to a dependent variable in the previous thesis, but was discounted due to its lack of correlation to NAV, particularly in the office sector. We revisited this variable once more to determine if there is a better correlation to NAV or if this specification of the dependent variable perhaps does a better job of explaining the variance in share prices across REITS. The correlations of Apartment FFO and Office FFO multiples to NAV premium
were 53.3% and at 63.5%, respectively, which were no stronger than the
previous thesis' correlations. However, there appears to be more reliance (and consensus data relating to FFO per share) on this measurement
available today (see Consensus data for this variable, Exhibit 1, calculations in Appendix 2); therefore the Price-to-FFO multiple will be tested as an alternate dependent variable.
2000 est. price to AFFO Multiple-Consideration was given to using price to
AFFO multiple as a dependent variable. AFFO correlations to NAV premium for apartment and office REITs were 66.2% and 72.4% respectively, higher than those for FFO. Despite this higher correlation, the disparate sources and large gaps in AFFO data collected from 1997 and 1999 raised some question as to the reliability of these correlations and the data in general. Their lack of standardization in its calculation is problematic as well, thus, it was discounted as a viable specification of the dependent variable.
1999 Price to Net Income Multiple -- Net Income multiple was briefly
considered as a dependent variable to measure earnings growth, but discounted due to lack of consensus for its use in industry. In fact, only Green Street Advisors advocates the use of Adjusted Net Income as a performance measure.
3.3 Independent variables
The following Exhibit 2 provides a statistical summary of the objective and subjective variables which have been used to test the definition of franchise
value.26 The objective components were easier to access, as they consist of
information available to investors and analysts. Some are more challenging to find, and required consensus data. For instance, in collecting the
Acquisition and Development figures which analysts build into their earnings (FFO) models to identify company growth prospects, I found a wide range of estimated data for each company. Some analysts consider the development figures alone, as they do not believe that there will be much accretive value to acquisitions over the coming year, given the current high cost of both capital and properties. Others are bullish on external growth as supported by acquisition and development figures, but look at other factors such as
management and specific local markets to calculate their NAVs. Most lament the unclear direction provided them by the companies themselves, and
estimate the acquisition and development figures based on previous activity and their (the analysts') own sense of how the companies will grow. For this particular data, I have collected data from the analysts' models directly,
making adjustments for varying accounting practices27 to arrive at a
consensus number for most of the REITs in the study group. In certain cases, where there was missing data, the mean for the variable was used for the regression runs.
The more subjective components of franchise value, such as management variables, required creation of proxy values or other types of measurement. Exhibit 2 lists and provides descriptive statistics for the Independent variable database, also seen in Appendix 3. A brief description of the Independent variables, along with assumptions and expectation for each variable are as follows:
Exhibit 2
Independent Variable Descriptive Statistics Independent Variable Description
Business Strategy
Herfindahl Geographical Concentration Herfindahl Product Type Index Change in Occupancy Levels Regional Growth Opportunities
New England Mid Atalntic Old South Industrial Midwest Farm Belt Mineral Extraction Southern California Northern California Balance Sheet Strength
Debt to Total Asset Value Debt to Market Cap
Percentage Variable Rate Debt EBITDA to Interest Expense Ratio 2000E Capital Deployment Ratio 2000E Capital Deployment Level New Stock Issuances (Equity & Debt) Dividend Payout to '00 FFO Ratio
Visibility
Analyst Coverage (millions)
Number of Institutional Owners (millions)
% of Institutional Owners
Average Weekly Shares Traded (millions) Average Trading Volume (% of Market Cap) Total Market Cap (Millions)
Low Overhead
G&A as Percentage of NOI Experienced Management
Average Earnings Surprise Average Tenure of Top 6 Executives Visionary Leadership
Vision Test Disclosure
Disclosure Level Conflicts of Interest
O.P. Units Outstanding Total Inside Ownership Executive Inside Ownership Indicator (Dummy) Variables
Focus (1= Office)
Inhouse Property Management Development Capability de-REITed (1=yes)
Change in Management ('99 only) Rated Debt
Evidence of Nepotism Structure
State of Incorporation Independent Board Chair
Variable Name GEOGRAP INDEX_2 CHGVAC NEWENG MIDATL OLDSOU INDMID FARM MINEXT SOCAL NOCAL DEBT-AV PERDEBT VARDEBT EBITINT DEPCAP50 A&DLEVL NEWSTOC PAYOUT NOANAL OWNINSTN INSTOWN TRADENO TRADEVOL TOTALCAP GANOI SURPRISE AVGYRS VISION DISCLOSE UPVALUEP OWNIMP BENTOP6 FOCUS SLFMGMT DEVCAP DEREIT CHGMGMT INVGRAD NEP STRUCTURE MDCORP INDYCHR All REITS
Mean Std. Dev. Min. Max.
15.3% 100.0% 52.8% 25.2% 50.0% 100.0% 88.5% 17.7% -11.1% 7.1% -0.4% 2.9% 0.0% 23.3% 2.0% 5.3% 0.0% 100.0% 22.5% 32.8% 0.0% 91.4% 22.4% 29.2% 0.0% 96.0% 10.8% 22.5% 0.0% 8.0% 0.8% 2.0% 0.0% 45.8% 12.2% 15.0% 0.0% 100.0% 14.7% 25.8% 0.0% 72.2% 10.2% 17.1% 29.0% 72.2% 46.8% 9.3% 24.4% 72.3% 4 9.1% 9.3% 3.2% 74.9% 25.1% 16.2% 167.5% 623.1% 344.6% 86.5% -41.9% 3090.1% 164.8% 544.8% -5.3% 12.6% 2.6% 3.7% 0.0% 1900.0% 519.4% 479.8% 28.6% 184.4% 76.1% 24.7% 2 19 9 5 17 264 111 55 15.7% 98.2% 57.2% 20.6% 117 2711 644 534 0.4% 2.3% 1.3% 0.4% 497 12632 2895 2784 1.1% 20.3% 6.2% 3.6% -0.8% 3.9% 1.2% 1.1% 3 21 10 6 0 6 2 1 2 6 4 1 -2.6% 31.6% 6.0% 6.9% 1.0% 41.5% 12.2% 8.6% 0.1% 26.1% 7.9% 6.6% All REITs 1= 0= 1=# I 0=# Office Apt 1= 19 0 = 25 Yes No I = 36 0= 0 Yes No 1= 31 0 = 11 Yes No 1 = 2 0 = 34 Yes No 1= 18 0= 17 Yes No 1= 16 0 = 28 Yes No 1= 29 0= 7 UPREIT Trad/Dwn 1 = 28 0 = 8 Other MD 1= 10 0 = 27 Yes No 1= 17 0= 19
Internal/External:
Focused Business Strategy
*
FOCUS. Office/Apt (1=office)GEOGRAP. Herfindahl Index of Geographic and Product type
concentration - tests the hypothesis that a focused business strategy, as defined by geographic concentration, is no longer a significant determinant of franchise value. The value of this index will vary
between 1.0 for non-geographically diversified REITs to .125 for REITs
which are equally diversified across 8 regions. See Appendix 4 for summaries of each REIT's holdings by economic region.
INDEX 2. Herfindahl index of product type concentration -- tests the
hypothesis that, unlike regional diversification, product type
diversification is not viewed favorably in the REIT marketplace. The
variable will be equal to 1.0 for REITs with holdings in only one
product type, such as EQR. For REITs which are equally diversified across six product types, the variable will be .167. REITs with low index score are expected to have lower franchise values.
Growth Opportunities inherent w/in business strategy
DEVCAP. Development capabilities (1=yes) - It has been believed
that the ability not only to acquire, but to develop property, increases a REIT's growth prospects and should thus have a positive impact on franchise value. This may not be as significant today as in the
previous study, as most REITs have not had the access to funding due to increased costs of capital and/or lack of credit availability.
*
SLFMGMT. Inhouse Property Mgmt. (1=yes) - Inhouse propertymanagement capability is a sign of a fully-integrated real estate company, and is deemed to provide economies of scale in maximizing internal profit (growth) potential. Indeed most REITs have this
REIT's Inhouse Property Mgmt capacity and its NAV premium or Price-to-FFO multiple is not expected to be identified.
Regional Growth Opportunities (See Exhibit 2, Appendix 8 for Regions)
- This is measured by the Hartzell, et al., economic region
segmentation scale as a way of determining whether, for a given property type, regional focus or growth opportunities are perceived as adding value to a REIT. A REIT with a high concentration of properties in certain that are experiencing high economic growth in conjunction with high barriers-to-entry (such as New England, Northern and Southern California, the Mid-Atlantic states, etc.), are expected to have stock pricing premiums, or at least lower discount levels.
DE-REIT. De-REITed? (1=yes) This dummy variable posits that
companies which were in process of de-REITing in '98 were known to investors and rewarded in terms of premiums to their NAVs, due to anticipated growth prospects. However, as only two REITs have de-REITed and these two did so in 1999, well after the '97 data was collected, this variable was not used.
CHGVAC. Occupancy Change - The increase in occupancy rates-or
decrease in vacancy rates--between '97 and '99 intuitively should be
negatively correlated to expected future income growth, that is, rents
go up along with stock price as vacancies decrease. However, an argument could be made for this to be positively correlated, that is,
this decrease in vacancy rates (as measured by % change in stock)
would translate to lower stock valuation, if investors anticipate that a development boom would soon ensue. As investors are forward looking, it is expected that the latter will hold sway, with lower vacancy changes correlating to lower stock premium valuation. Changes in occupancy levels are deemed by some investors as a leading indicator of potential development. This variable will be applied to 1999 REITs to see if the negative correlation holds.
Balance Sheet Strength/Access to Capital
PERDEBT. Debt as a % to Total Market Capitalization - One of the key
components of balance sheet strength, it is expected that companies' debt levels at or below 40% have additional borrowing capacity and therefore more growth potential. As debt levels have exceeded 50% for many REITs in the past two years and borrowing capacity has been exhausted for all but a handful of companies, this variable is not
expected to have much impact on REIT pricing, except to perhaps "reward" those with additional capacity for debt (that is, those with lower debt levels) with higher valuations.
DEPCAP50. Additional Borrowing Capacity to Estimated Capital
Deployment Ratio- This variable measures the company's capacity to
reach a 50% debt level-to-total market capitalization level against its
estimated capital deployment (2000E development and acquisitions). The resultant ratio is a gauge of the buffer (in years, roughly) that existing shareholders have before the REIT must "go back to the (equity markets) well" to carry out its business plan. The data is a consensus estimate from between Lehman Bros., Morgan Stanley and Legg Mason analysts. This new study shifts to a 50% debt-to-total market capitalization threshold, more common in today's marketplace, despite higher costs of capital. To achieve consistency across both studies, the 1997 data is adjusted to reflect this higher debt threshold. This adjustment is not expected to have any measurable effect on the
1997 data, as most of the companies at the time had positive
debt/capital deployment ratios and the measurement would be based on relative levels of deployment ratios. However, it makes the 1999 data more relevant, given that it is expected that very few REITs today would fall below the 40% debt levels, which are required to generate positive Debt/Capital Deployment values. It is then expected that those companies which have higher positive ratio values will be rewarded in the marketplace with higher stock valuation.
ADLVL. 2000 Estimated Capital Deployment-One of the new
variables introduced in this study, this variable is the estimated volume of a REIT's acquisitions and development for the coming year (2000E), which are built into analysts' models to project growth of
FFO/earnings for each REIT. These values are taken as a % of total
market capitalization for each company. Though difficult to pinpoint, this figure is the best measure of a company's external growth, and is anticipated to be significant in this year's study. A greater capital deployment capacity is expected to factor into a REIT's franchise value positively.
NEWSTOC. New Stock Issuance -- Another measurement of
deployment capacity is a firm's proclivity to tap the capital markets via new stock issuances. Any new stock issuances-common, preferred or convertible-will be counted. It is assumed that the higher the
number of issuances, the greater the amount of capital available, the greater the ability of the firm to finance growth. Because there are some REITs which did not (or could not) issue new equity or debt, while others have done so regularly, the simple measure of issuance activity is expected to have a positive effect on a company's ability to achieve external growth, and thus increase its franchise value.
INVGRAD. Investment Grade Debt rating (1=yes) - This rating
signifies the ability of a company to access unsecured debt, which can provide additional flexibility for growth opportunities. Having
unsecured debt credit rating should positively impact relative REIT stock value, which was the hypothesis two years ago. Today, this ability to access unsecured debt could be viewed negatively, as firms who have access to and use debt capital, signal slower growth
prospects.
VARDEBT. Variable Rate Debt to Total Debt Ratio - The anticipated decrease in FFO from fluctuating interest rates is expected to have a negative impact on stock pricing.
EBITINT. EBITDA-to-Interest Expense Ratio - The EBITDA-to-Interest
Expense ratio is a coverage level used by analysts to rate a firm's ability to cover its annual interest expense obligations. A higher interest coverage ratio is thus expected to decrease the cost of debt and equity, and should correlate with higher relative REIT stock
pricing.
PAYRATIO. Dividend Payout to Estimated 2000 FFO Ratio - A higher dividend payout ratio leaves the REIT with less cash on hand for growth opportunities. A lower payout ratio is expected to have a positive impact on stock pricing levels.
Visibility
NOANAL. Number of analysts covering stocks - It is expected that increased investor visibility will have a positive impact on franchise value and that REITs with more analyst coverage will be priced accordingly higher.
OWNINSTN and INSTOWN. Number of Institutional Owners and percentage of Inst. Ownership to outstanding shares -- It is expected that REITs with a higher number of institutional holders and higher percentage of Institutional investors should have higher stock values. TRADENO and TRADVOL. Relative Trading Volume - The average
weekly number of shares traded and % of shares traded relative to
market cap is the ultimate measure of liquidity. If this "liquidity premium" does exist, then REITs with higher relative trading volumes should trade at higher levels relative to their NAV.
TOTALCAP. Total Market Capitalization (in billions) -- Following Sam Zell's mantra that "bigger is better", due to larger REITs' ability to access capital and achieve economies of scale in property level negotiation, this variable is a simple test of investor preference for larger companies. Following the hiccup in the NASDAQ this past March, and the net effects across the marketplace as a whole, it is
expected that REITs with the largest capitalization (considered equivalent to "blue chips") would have higher relative stock values.
Low Overhead
GANOI. G&A as a % of NOI - This variable attempts to measure
investor's perception of operating expense at the corporate level, relative to net operating income. It is expected that there should be a positive relationship between low G&A expenses and stock pricing levels.
Human Resources:
Experienced Management with a Proven Track Record
SURPRISE. Average % earnings surprise -- This variable is the gauge
by which REITs meet investor's performance expectations. It is expected that REITs with positive average earnings surprises should trade at higher pricing levels than those which do not meet or exceed expected earnings. The figure is an average for the prior eight fiscal quarters.
NEP. Evidence of nepotism (1= no evidence of family relationships in
management). Many REITs were originally formed from private, family real estate businesses, which sought to capitalize on opportunities provided by the public market. Though many have had significant changes in management due to acquisitions and mergers, there is still evidence of family ties within some companies' management structure. To measure nepotism's effects on stock pricing, an indicator (dummy) variable was used based on the evidence (or lack thereof) of family
relationships within a REIT's Board and management at the executive level. Evidence of such is expected to negatively impact the
company's pricing levels.
CHGMGMT. Change in management since '98 (1=yes) As discussed
evolutionary changes in the past two years. Mergers, acquisitions and even disappearances of these companies from the public forum have resulted from these changes, as companies have tried to adapt to the new (harsher) terrain. This has yielded a turnover in Management for many REITs, which tried, among many things, to boost stock price with the fresh infusion of new "blood" into the top ranks of its company structure. This proxy variable attempts to measure how a change in the top six Executive ranks within a company in the past two years, signaling a change in direction of company management, might indicate higher pricing levels.
Visionary Leadership
VISION. The number of companies which the Chairman or CEO has taken public - This variable attempts to measure whether a Chairman or CEO's entrepreneurial skills, personal charisma, or track record--as indicated by the number of companies he/she has taken public--is significant in determining REIT pricing levels. Visionary leadership in the business arena, as defined in this manner, is expected to have a positive effect on stock pricing levels.
Governance: Disclosure
DISCLOSE. Press release disclosure test (score based on disclosure
material provided to public) -- This variable is a measure of
transparency, based on a six-point criteria of disclosure level within a REIT's quarterly reports (10Qs):
- Complete (though unaudited) income statement
- Complete (though unaudited) balance sheet
Financial details of each new transaction (excluding simple summary)
Reconciliation of Net Income to FFO
- Reconciliation of Net Income to FAD
A baseline "score" of 2 is expected, as all REITs are required by the SEC to submit Income statement and Balance sheet information in their quarterly reports. Those companies which exceed this basic
information in their 10OQs are expected to be rewarded with higher
stock pricing.
Conflicts of Interest
STRUCT. UPREIT Structure (1=yes) - The UPREIT structure has been
hailed as a useful mechanism for reducing taxable income for the company sponsors and other contributors/sellers of property to the
REIT. However, the UPREIT structure has also drawn much criticism in literature for being replete with conflicts of interest-the taxes
triggered by the disposition of properties tied to these Operating Partnership Units (OPUs) create an incentive for the partners/UPREIT management to maintain the status quo by holding onto these assets, thereby missing profitable opportunities for sale of assets. It is
expected that this variable will negatively (though slightly) impact REIT pricing levels.
MDCORP. Maryland Corporation (1=yes) - Because the state of
Maryland supports strict anti-corporate takeover provisions, it is
expected that REITs which seek this protection are those which intend to protect their operating partnership units from unfavorable tax
consequences, and may thus sacrifice shareholder interests in the event of value-enhancing purchase offers from outside entities.
INDYCHR. Separation of Mgmt and Board Leadership (1=Inside Chair)
is separation between Board and management in the company, as evidenced by the existence of separate CEO and Chairman within a company's Board of Directors. It is expected that this separation will have a positive impact on REIT pricing.
OWNIMP. Percentage Insider Ownership, including stock options - The alignment of interest is often reflected in the compensation of
"Insiders", or those within the Executive management or Board. This variable measures the percentage of ownership as a proxy for
protection against conflicts of interest. Data is from SNL Securities and represents the last reported 1999 data.
BENTOP6. Percentage Insider Ownership of the top 6 officers of the
REIT - This variable is a second test of alignment of management and shareholder interest. The percentage of beneficial stock ownership, including operating partnership units, if applicable, of the top six executive positions is derived from 1999 Proxy Statements. It is expected that inside ownership is positively correlated to higher pricing levels.
4.0 Regression results
As stated earlier, the prior data set was expanded to determine whether the
statistical model would be representative of stock valuation during "normal" cycles. In this way it is hoped that the regressions can sift out those significant elements of franchise value as described in this thesis, adjusting for any extraordinary market context influences. A Summary of Regressions results is presented in Exhibit 3.
Exhibit 3
Summary of Adjusted R-Squared Values
NAV Premium - Dependent FFO Multiple- Dependent
Variables Variable
'99 Data Only '97-'99 Data '99 Data Only '97-'99 Data
Orig. (Control) n/a 64.7% n/a 76.6%
Independent Variables
Orig. + New 36.3% 60.9% 60.2% 76.6%
Independent Variables
The regression analyses of the variables described in Chapter 3 resulted in a
statistical model which explains 64.7% of the variance in the Premium-to-net asset
values and 76.6% of the variance in Price-to-FFO multiples, the alternate
specification of dependent variable in the study (see Appendices 5a and 7a). These results are echoed in results of regressions using the original plus the new variables against both the NAV premium and Price-to-FFO multiple, with R-squared "scores" of 60.9% and 76.6%, respectively (See Appendices 5b and 7b). It is by sheer coincidence that the same Adjusted R-squared values of 76.6% resulted from both
regressions on the original (control) variables as well as the original + "new" variables. One explanation would be that the runs are nearly identical, with virtually the same variables removed due to collinearity problems associated with these variables. In addition, only two out of the four new variables introduced were applied to these runs, due to incomplete data for 1997. Of the two, NEWSTOC
proved to be insignificant. The other variable, ADLVL, which measures deployment capacity, replaced DEPCAP50, which was removed due to multi-collinearity
problems. All four new variables were applied to regressions on the 1999 data set, producing much more varied results (see discussion below).
From the results given above, it appears that the strength of the relationship of the independent variables to the franchise value as measured by Premium-to-NAV is not constant over time. The previous thesis yielded an Adjusted R-squared value of
72.9%28, versus 64.7% today. However, the results from the regressions suggests
a much stronger relationship between the variables and the Price-to-FFO multiple as an alternate dependent variable, at a much higher Adj. R-squared value of
76.6% and lower Standard of Error of 1.228%. These results are replicated in the results of the regression using the "original + new" variables against the NAV premium or discount (Adj. R-squared of 60.9%) and the alternate dependent specification of the FFO multiple (again, an Adj. R-squared of 76.6%). The results of the regressions for the '97-'99 merged data using the Premium-to-NAV as a dependent variable is shown in Appendices 5a and 5b.
The results using the same model on the 1999 data were much weaker (36.3% adjusted R-squared using NAV premium as a dependent variable, and 60.2% adjusted R-squared using the FFO multiple as a dependent variable). While these
results suggest that the model perhaps does not present the correct hypotheses on data collected during a bear market, it is interesting to note that the stronger
relationship shown between the variables and the FFO multiple is evident on this study as well. The results of the regressions on the 1999 data set only are shown
in Appendices 6A and 6B.
For the remainder of this thesis, I will focus on the results of the regressions on the expanded '97-'99 data set, using the original, "control" independent variables and the Price-to-FFO multiple as the dependent variable. The slight differences between this run and that including the new variables will be noted in the text and detailed
in the FFO Regression Summary presented in Exhibit 4 and documented in
Appendices 7A and 7B. A discussion of each of the statistically significant variables and of selected non-statistically significant variables from the model follows.
Exhibit 4
Summary of '97-'99 Regression Results Dependent Variable: Price-to-FFO Multiple
Independent Variables: Original (Control)
Variable Dexcription Variable Included Variables Excluded Variables Name Coefficient t-stat Significance Coefficient t-stat Significance
Constant 13.939 23.210 0.000
Focus
Focus (1= Office) FOCUS -1.586 -0.360 0.000
Business Strategy
Herfindahl Geographical Concentration GEOGRAP 0.053 0.827 0.411
Herfindahl Product Type Index INDEX_2 -0.054 0.643 0.522
Development Capability DEVCAP 0.011 0.173 0.863
Regional Growth Opportunities
Mid Atlantic MIDATL 0.024 5.145 0.000
Old South OLDSOU -0.027 -0.350 0.728
Industrial Midwest INDMID 0.029 0.446 0.657
Farm Belt FARM 0.117 2.044 0.045
Mineral Extraction MINEXT -0.007 0.106 0.916
Southern California SOCAL 0.016 3.081 0.003
Northern California NOCAL -0.009 -0.144 0.886
Balance Sheet Strength
Debt to Market Cap PERDEBT -0.146 -12.106 0.000
Percentage Variable Rate Debt VARDEBT 0.012 0.181 0.857
Rated Debt INVGRAD 0.072 0.932 0.355
2000E Capital Deployment Ratio DEPCAP50 -0.064 -1.068 0.29
2000E Capital Deployment Level* A&DLEVL 0.078 1.029 0.307
Dividend Payout to '00 FFO Ratio PAYRATIO -0.005 -0.080 0.936
Visibility
% of Institutional Owners INSTOWN -0.032 -0.483 0.631
Average Trading Volume (% of Market Cap) TRADEVOL 0.097 1.453 0.151
Total Market Cap (Billions) TOTALCAP 0.005 6.957 0.000
Low Overhead
G&A as Percentage of NOI GANOI 0.137 3.555 0.001
Experienced Management
Average Earnings Surprise SURPRISE 0.371 3.521 0.001
Average Tenure of Top 6 Executives AVGYRS 0.072 3.135 0.003
Visionary Leadership
Vision Test VISION -0.665 -5.035 0.000
Disclosure
Disclosure Level DISCLOSE -0.214 -2.791 0.007
Conflicts of Interest
Executive Inside Ownership BENTOP6 -0.041 1.951 0.055
Evidence of Nepotism NEP 0.046 0.588 0.559
Structure STRUCT 0.003 0.043 0.966
% Inside Board PERINSID 0.065 1.016 0.313
State of Incorporation MDCORP -0.051 -0.731 0.467
Independent Board Chair INDYCHR -0.018 -0.288 0.775
Adjusted R-squared = 76.6%
4.1 1997-1999 Regressions Against Price-to-FFO Multiple - Review of Statistically Significant Variables
Focused Business Strategy
FOCUS. Focus (1=Office) - The negative coefficient associated with
this dummy variable indicates that a specific office focus detracts from a REIT's franchise value. This could indicate that apartment REITs have had a greater price appreciation over the two-year period than have office REITs. This would make sense, given the greater stability of commercial housing over a longer time period, and--though perhaps unjustifiably, given the strength of real estate fundamentals in all sectors of late-investors' lingering memories of the last cycle's treatment of office property valuation.
Growth Opportunities Inherent in Business Strategy
Three regions emerged from the group of variables designed to reflect economic opportunities by regional portfolio concentration as having a statistically significant impact on REIT franchise value. All show a positive impact, although of the three, the Mid-Atlantic region, which captures a wide region encompassing New York, New Jersey and the large MSAs covering Fairfield County in Connecticut, Philadelphia and its suburbs, and the
Metropolitan Washington area, shows the strongest significance based on its high t-stat value (see also Exhibit 4, Summary of Regression Results).
MIDATL. Mid-Atlantic - The strong positive coefficient reflects the
dynamic real estate markets in this area during the past two years. This strength is primarily based on the growth of the high tech market (Silicon Alley in NYC and the Dulles Corridor in Washington's suburbs) in particular, and the strength of the financial services sectors
throughout the Mid-Atlantic corridor in general. The growth and expansion possibilities in this region eclipse that of the New England region, which had fairly high significance in the previous thesis.