Detection, Patterns, Consequences, and Remediation of Electronic Homework Copying by
David J. Palazzo
B.S., Mechanical Engineering (1996) United States Military Academy Submitted to the Department of Physics in Partial Fulfullment of the Requirements for the
Degree of Master of Science in Physics at the
Massachusetts Institute of Technology June 2006
© 2006 Massachusetts Institute of Technology All rights reserved
A//
Signature of Author ...w.-..
.:
Department of Physics May 24, 2006Certified
by ...
.
... -... ... David E. Pritchard Cecil and Ida Green Professor of Physics Thesis Supervisor Accepted by .../
:Thoma. Greytak
Associate Department Head 9 Education MASSACHUSiETrTS NSTT
OF TECHNOLOWY
AUG 10 2006
Detection, Patterns, Consequences, and Remediation of Electronic Homework Copying by
David J. Palazzo
Submitted to the Department of Physics
On May 24, 2006 in Partial Fulfullment of the Requirements for the Degree of Master of Science in Physics
The log of all interactions the student makes with an online homework tutor
(MasteringPhysics), including start time, finish time, correct answers, wrong answers, and hints requested allowed the development of an algorithm which assigns a "copying" probability to each problem completed. This algorithm was applied to three successive Newtonian Mechanics classes at MIT: Fall 2003, Fall 2004, and Fall 2005, affording unique insight into the dynamics of physics homework copying, and allowing contrasts between the performance and behavioral patterns of students who copy a lot and students who copy a little or copy none at all.
Observations show that repetitive homework copying is correlated with steeply declining exam performance, and that repetitive copiers are four times more likely to fail to complete the
-required two semester physics sequence on time than students who don't copy. Observations of several behavioral patterns associated with repetitive homework copying are reported - these patterns, combined with data from a self-reported cheating survey of MIT freshman, shed new light on the reasons students copy and steps educators can take to reduce homework copying. Through the implementation of several of these steps, we observe that between Fall 2003 and Fall 2005 detected homework copying dropped by -40%. Although efforts to reduce homework copying may not be an innovation in teaching, our study indicates it may be the best path to
increasing student learning and success.
Thesis Supervisor: David E. Pritchard
Acknowledgements
Three individuals have been invaluable throughout the development and completion of my thesis. Dr. Rasil Warnakulasooriya welcomed me to Professor Pritchard's MIT Physics Education Group, answered my daily litany of questions for almost a year, pointed me toward some fruitful applications of bayesian probability theory, and in general taught me innumerable programming and statistical methods. Dr. Young Jin Lee also provided statistical advice and proofread each of my thesis chapters during the writing process. Finally, Professor Dave
Pritchard supplied the impetus for, and guidance throughout, my thesis. He provided invaluable commentary and suggestions beginning with the analysis of our data and throughout the
transcription process. I hope this work benefits not only future MIT research, but also research efforts in physics education and education in general nationwide.
I would also like to thank Eric Hudson for allowing us to survey the Spring 2006 8.02 Teal students; Alberta Lipson for providing the 1992 Freshman academic dishonesty data; Marilee Jones and Matt McGann for providing admission data for the 2003 - 2005 8.01 students; and Ri Romano for providing academic transcript data for the 2003 - 2005 8.01 students.
Lastly, thank you Leila for your loving support throughout my Army career, and especially during our time in Boston.
Contents
1 Academic Dishonesty: A Fifty Year Review 1.1 Prevalence of Academic Dishonesty
1.2 Factors Associated With Students Engaging in Academic Dishonesty 1.3 Psychological and Social Ideas Forwarded to Explain Cheating Behaviors 1.4 Methods of Cheating Detection
1.5 Literature Review of Cheating Remediation
2 Patterns and Consequences of Web-Based Physics Homework Copying
2.1 Fall 2003 Patterns and Consequences of Web-Based Physics HW Copying 2.2 Fall 2005 Patterns and Consequences of Web-Based Physics HW Copying 2.3 Algorithms Predict 8.01 Final Exam and 8.02 Course Performance
3 Self-Reported Cheating by MIT First Year Students
3.1 Comparison With National Survey Data of College Students 3.2 Longitudinal Comparisons Using Lipson 1993 Survey
3.3 Self-Reported Homework Copying vs. Detected Homework Copying 3.4 Self-Reported Homework Copying and Correlates of Cheating 4 Conclusions
A Self-Reported Cheating Survey Data B Experimentally Recorded Cheating Data
C Plot of Experimentally Recorded Cheating Data vs. Time D Prevalence of 11 Forms of S-R Cheating
E Individual and Situational Factor Data
F 8.02 Electricity and Magnetism Spring 2006 Survey G 8.02 Survey Results and Free Response Answers Bibliography
List of Figures
1-1: S-R cheating (general):
1-2: S-R exam cheating (using crib notes) 1-3: S-R unauthorized collaboration 1-4: Male vs. female S-R cheating 1-5: Academic major vs. S-R cheating
1-6: Low GPA vs. medium GPA S-R cheating 1-7: Low GPA vs. high GPA S-R cheating 1-8: Effect size for cheating vs. year of college
1-9: Year of college vs. S-R cheating 1-10: Size of school vs. S-R cheating 1-11: School type vs. S-R cheating 1-12: Honor codes vs. S-R cheating
1-13: Fraternity membership vs. S-R cheating 1-14: High school vs. collegiate S-R cheating 2-1: Temporal patterns of homework copying
2-2: Electronic homework copying, assignment length, and problem order as completed 2-3: Homework copying vs. problem difficulty and practice problems
2-4: Correlates of electronic homework copying 2-5 Male vs. female electronic homework copying 2-6: Ethnicity and electronic homework copying 2-7: Student age and electronic homework copying 2-8: Academic major and electronic homework copying 2-9: Detected homework copying from Fall 2003 and Fall 2005
2-10: Temporal patterns of homework copying from Fall 2003 and Fall 2005: Assignment vs. copying
2-11: Temporal patterns of homework copying from Fall 2003 and Fall 2005 (cont): Fraction of assignment time remaining vs. copying
2-12: Temporal patterns of homework copying from Fall 2003 and Fall 2005(cont): Late interactions submitted
2-13: Fall 2003 and Fall 2005 homework copying vs. problem order 2-14: Fall 2003 and Fall 2005 homework copying vs. problem difficulty 2-15: Fall 2003 and Fall 2005 homework copying vs. exam preparation 2-16: Fall 2005 in-class quiz performance and homework copying 2-17: Fall 2005 in-class problem solving and homework copying 2-18: Fall 2005 consequences of electronic homework copying 2-19: Fall 2003 and Fall 2005 slope vs. <fraction of problems copied>
3-1: MITF vs. NS perception of the campus prevalence of plagiarism on written assignments 3-2: MITF vs. NS perception of the campus prevalence of cheating During Test/Exams 3-3: MITF vs. NS perception of the campus prevalence of inappropriate sharing in group assignments
3-4: S-R cheating of MITF and NS
3-5: S-R tolerance of cheating for MITF and NS 3-6: S-R cheating of 1992 MITF and 2006 MITF
3-7: 1992 MITF and 2006 MITF that reported no tolerance for test cheating, plagiarism, and homework copying
3-8: S-R electronic HW copying vs. detected HW copying from the Fall 2005 8.01T class 3-9: Prospective academic major vs. 10 forms of S-R cheating
3-10: Prospective major vs. S-R 8.01 HW copying 3-11: Task orientation vs. 10 forms of S-R cheating 3-12: Task orientation vs. S-R 8.01 HW copying 3-13: Total task orientation vs. S-R 8.01 HW copying
3-14: S-R cheating tolerance vs. S-R cheating frequency 3-15: S-R cheating tolerance vs. S-R 8.01 HW copying
List of Tables
1-1 Correlations for 11 forms of cheating with time 1-2: Descriptive statistics for 11 forms of cheating 1-3: Individual factors investigated
1-4: Situational factors investigated
1-5: Summary of individual factors and cheating 1-6: Summary of situational factors and cheating
2-1: Copying group and correlation with problem difficulty.
2-2: Local and cumulative effects of copying and exam performance 2-3: Local and cumulative effects of copying and exam performance 2-4: Male and female copying vs. final exam performance
2-5: Multiregression of demographic variables vs. homework copying
2-6: Multiregression of demographic variables vs. homework copying (Fall 2003 only) 2-7: Fall 2003 slope fit and <fraction of problems copied>
2-8: Fall 2005 slope fit and <fraction of problems copied> 2-9: Summary statistics for slope analysis
2-10: Fall 2003 early term prediction of 8.01 final exam score 2-11: Fall 2005 early term prediction of 8.01 final exam score 2-12: Spring 2004 8.02 final exam prediction
2-13: Spring 2004 8.02 final grade prediction
3-2: Average cheating and tolerance scores for 8 forms of cheating
3-3: Reported average cheating tolerance of test cheating, plagiarism, and homework copying from 1992 MITF and 2006 MITF
3-4: Percentage of S-R Electronic HW copying vs. detected electronic HW copying from the Fall 2005 8.01T class
3-5: Scoring scheme for 10 forms of S-R cheating
3-6: Scoring scheme for S-R 8.01 written and electronic homework copied 3-7: Scoring scheme for seriousness of cheating questions
Collegiate Academic Dishonesty: A Fifty Year Review
As long as there have been graded requirements, there have been cheaters-people who, tempted by the rewards or the convenience of the act, have sought to find an easy solution to a hard question. Two thousand years ago, Imperial Chinese went to great lengths to curb cheating on civil service exams only to find that examinees invented increasingly clever ideas to beat the system [10]. Modem students are, in many ways, similar to the Chinese civil servant. They both cheat(ed) for gain. And, they both use(d) increasingly clever means of cheating. Three thousand years ago, Chinese civil servants would sew crib notes into hidden pockets within their clothing; today's student often relies on technology.
This chapter will review five aspects of the modem cheating literature: I. Forms and prevalence of academic dishonesty
II. Individual and environmental factors associated with students engaging in academic dishonesty
III. Psychological and social theories forwarded to explain cheating behaviors
IV. Methods of cheating detection (specifically multiple-choice exams and term papers) V. Literature Review of Cheating Remediation
This chapter seeks to provide the reader an overall perspective on academic dishonesty. It will attempt to answer the following questions based on the relevant literature:
1.) What are the various forms of cheating? How are they defined? Is cheating increasing? If so, which forms? What might account for these increases?
2.) How do various demographic factors affect academic dishonesty? 3.) Why do students cheat?
4.) What methods have been developed for detecting cheating students? 5.) What methods have researchers tried in order to reduce cheating?
Forms and Prevalence of Academic Dishonesty
This section will summarize data from over 120 cheating studies conducted from 1955 to 2005. Through a comprehensive examination of these studies, we attempt to answer the
following:
1. How is academic dishonesty defined?
2. What methods have researchers used to investigate academic dishonesty? 3. What are the advantages and disadvantages of each method?
4. What do these studies conclude about the prevalence of academic dishonesty? One of the problems associated with researching a topic as broad as "academic
dishonesty" is the lack of a concrete, standard definition. For this review, we define academic dishonesty using Lambert's [78] definition as "any fraudulent action or attempt to use
unauthorized or unacceptable means in any academic work." Lambert goes further to classify four realms of academic dishonesty: cheating by using unauthorized means, fabrication of
information, plagiarism, and facilitating academic dishonesty by helping other students engage in the first three. For purposes of our review, we separate Lambert's classification of academic dishonesty into the following 4 main groups and 11 separate forms of cheating:
I. General Cheating II. Exam Cheating:
General
Copying From Another Student Using Crib Notes
Helping Another Student Cheat III. Plagiarism
General Plagiarism from Exterior Sources Copying Material Without Footnoting Falsifying a Bibliography
IV. Unauthorized Cooperation
Turning in Work Done by Another
Unauthorized Collaboration on an Assignment Homework Copying
Detecting someone during the act of cheating remains a difficult proposition.
Accordingly, very few, if any, students report being caught cheating [122], while we know that most studies report that many more students actually are cheating [95]. To date, researchers have relied on alternate means for data collection other than direct observation of all coursework.
Our review notes three cheating data collection methods used by researchers: self-reported surveys, experimental data collection, and the randomized response technique.
Self-reported surveys (88 studies). Self-reported surveys ask general questions regarding
the frequency and severity of cheating, as well as the underlying causes of cheating. Influential self-reported cheating studies prior to 1990 include Goldsen et al.[44], Bowers (1964), Harp & Taietz [53], Baird [5], Haines et al.[48], Todd-Mancillas and Sisson [132-134], and Micheals & Miethe [97]. Between 1975 and 1990, an average of 1.5 studies was published each year (21 total). Following 1990, the volume of cheating studies has increased to 3 studies per year (45 total). Noteworthy researchers in the last 15 years include Don McCabe, Linda Trevino, Stephen Davis, George Diekhoff, and Valarie Haines. The major claims of the self-reported literature include:
- Academic cheating occurs at rates as high as 95% [19] - Academic cheating is increasing [89]
- Demographic influences on academic cheating remain widely disputed
In the early 1980s, there was the perception among educators that cheating, particularly in college level institutions, was on the rise. In 1979 a Carnegie Council Report warned of the advent "ethical deterioration" in academics. Haines et al. [48] reported in 1990 that the levels of cheating were reaching "epidemic" proportions. In 1993, the U.S. Department of Education issued a monograph reviewing collegiate academic dishonesty. They recognized the inherent variability with regards to the cheating data; especially when comparing data sets sampled decades apart. Maramark and Maline [85] concluded that the current literature suggested cheating in college had become a "chronic problem." However, the data are not that simple to interpret. Large variance exists among all studies, with some researchers noting cheating levels as low as 3% [74] and some as high as 95% [19]. Regardless, the two claims above should disturb educators, parents, students, and society in general.
Reliability withstanding, there are several questions regarding the accuracy of self-reported data. We believe that self-self-reported survey data are questionable if only because these
surveys are asking dishonest students to classify and quantify their dishonesty. Erickson [29] showed that self-reported cheating rates can differ from actual cheating rates by as much as 40%. We, and others, question the inherent reliability of self-reported data although those who employ
it defend the method. Despite this shortcoming, Hollinger [58] believes that the self-reported survey is still the most applicable and insightful tool available to social science researchers, while Cizek [15] believes it is nonetheless "reasonably accurate". A reader should understand the external factors surrounding a survey before digesting its data.
Second, on what basis are researchers concluding that various forms of cheating are increasing? To date, only two purely longitudinal comparisons have been conducted. In 1990, Don McCabe began a series of multi-campus investigations into cheating within college
institutions, conducting a longitudinal measure of changes in reported cheating behaviors against
Bower's 1964 study [89]. McCabe found that some forms of cheating were increasing, namely general cheating, exam cheating, and unauthorized collaboration, while others forms of cheating were stagnant. Haines et al. [48] and Deikhoff et al. [23] conducted the only other known longitudinal study of collegiate cheating. An initial study was conducted in 1984 at an unspecified Southeastern public university. A follow-up study, at the same institution, was conducted in 1994. Diekhoff found no statistical change in exam cheating, but noted statistical increases in overall cheating (+7%, t = -2.08, p<.05) and assignment cheating (+11%, t = -3.42, p<.01).
No author to date has attempted to digest all available data and analyze prevalence rates over time. Whitley [145] conducted a comprehensive review of cheating studies between 1970 and 1995 in an attempt to quantify overall cheating rates and identify contributing demographic factors, but did not correlate the data with time.
Randomized Response Technique (2 studies). In this procedure, respondents first flip a
coin prior to being asked a question. If the result is "heads", the respondent is asked an innocuous question unrelated to cheating; "tails" and the respondent is asked a question
regarding their cheating behavior. Only the respondent knows which question they were asked -the researcher uses -the laws of probability to estimate how many students were asked -the
cheating question and how many responded that they had cheated.
Two studies located relied on the randomized response technique: Nelson and Schaefer [102] and Scheers and Dayton [117]. Scheers and Dayton reported that the randomized response technique shows that self-reported survey data underestimate actual cheating rates by as much as -40%. Scheers and Dayton attribute this to the additional anonymity afforded students with the randomized response technique. Nelson and Schaefer [102] reported that when comparing the question "have you cheated on a college test at least once," 50% of students asked with a self-reported survey admitted they had cheated while only 12% of students asked with the
randomized response technique admitted cheating. No explanation was given for this reversal. The failure of these studies to forward a consensus on the randomized response technique casts severe doubt on its reliability and usefulness.
Experimental Cheating (25 studies). The third data collection method used by
researchers relies on using an experimental setup to measure student cheating. Each experiment was conducted by placing individual students in a compromising situation and measuring how many cheated. All of these 25 studies predate 1990. Ackerman [1] expressed his disapproval of this experimental technique because it involves a "deception" on the part of the investigator. See Appendix A for the complete list of the experimental studies collected. Most studies have large errors due to a small sample size. Overall study variance is high, with some studies reporting as many as 80% [14] of students engaging in cheating and some studies reporting as few as 3% [73] of students cheated. The mean of all 25 studies is 47.3% with a standard deviation of 20.3.
Sample for this Literature Review.
Our objective was to find and gather, if possible, all self-reported studies relevant to undergraduate cheating. The sample was collected using several databases.
Computerized searches were made using Psychological Abstracts, Sociological Abstracts, Dissertation Abstracts, and ERIC (Educational Resources Information Center). Three previous cheating review papers also provided many sources: Whitley [145] Maramark and Maline [85], and Weber [142]. A comprehensive list of cheating literature maintained by the Center for Academic Integrity also assisted in compiling sources. Finally, by examining the bibliographies of each source, I discovered second and third-order sources that were missed by computerized searches. Studies were included if they reported the prevalence of cheating by undergraduate students in the U.S., Canada, Great Britain (U.K.), or Australia. Studies reporting prevalence of high school or graduate student cheating were not included for this analysis, but high school student data will be included in later analyses of factors associated with academic dishonesty. Rarely did a study report data on all 11 forms of academic dishonesty; most studies only concerned Cheating (General) or Exam Cheating (General). A total of 88 self-reported survey studies were used for this analysis, with the earliest study from 1960 and the latest study from 2005. Whitley's [145] review included a total of 46 studies on the prevalence of cheating with the earliest from 1971 and the latest from 1995; 1 study from Whitley's review was not included because it could not be located and 1 was not included because the data were not in analyzable format. An additional 15 studies were found between 1952 and 1970 and 29 more studies were found between 1996 and 2005. A complete list of the included studies can be found in Appendix
2.
Objectives, Procedures, and Analysis.
Our objective is to analyze data on 11 forms of cheating through the collection of published self-reported studies and determine whether each form of cheating is increasing over the previous fifty years. Percentages were recorded for each form of cheating above and plotted
against the year of data collection. If a study did not indicate the year the data were recorded, it was assumed the data were collected the year prior to the date of publication. Pearson
correlation coefficients were calculated for each form of cheating in order to measure how much, and in which direction, each form of cheating had changed over the last fifty years. An
estimated error for each correlation was calculated using a bootstrap technique with 1000 trials; in each trial the data was resampled randomly and the correlation was recalculated. The
bootstrap technique attempts to model the underlying distribution with an empirical distribution obtained through multiple resampling of the original data; Freedman et al. [150] showed the validity of the bootstrap method for estimating confidence intervals and regression errors.
Results.
Table 1 lists the form of cheating, the number of studies that contributed data, the Pearson correlation coefficient (r), the correlation error, the significance of the correlation
(p-value), the slope of the correlation line, and the error of the slope. In 11 trials (the number of behaviors tabulated), the probability of observing p = .002 is p = .022. Therefore, we regard the
increase of S-R Unauthorized Collaboration (p < .002) with time as significant, and the decline of S-R Turned In Work By Another (p < .007) as suggestive. None of the other behaviors tabulated are even suggestively changing with time.
Slope Slope
Cheating Behavior N r Error(+/-) p-value (%/century) Error (+/-)
Self-Reported Cheating (General) 52 0.53 .11 0.0001 .007 .0015
SelfReported Cheating (General)
-w/o Goldsen et al. 51 .07 .21 .70 .001 .003
Self-Reported Exam
Cheating(General) 33 -0.19 .22 0.3 -.004 .0037
Self-Reported Exam Cheating
(Copying from another student) 23 -0.2 .18 0.36 -.0034 .0036
Self-Reported Exam Cheating
(Helping another student cheat) 24 -0.18 .22 0.4 -.0028 .003
Self-Reported Exam Cheating
(Using crib notes) 22 -0.43 .22 0.04 -.003 .0014
Self-Reported Copied Material w/o
Footnoting 14 -0.14 .26 0.6 -.0015 .003
Self-Reported Plagiarism
26 -0.37 .15 0.06 -.0056 .0028
Self-Reported Plagiarism
(Falsifying a Bibliography) 13 0.02 .20 0.95 .0002 .003
Self-Reported Turned in Work by
Another 22 -0.55 .17 0.007 -.0028 .0009
Self-Reported Unauthorized
Collaboration 16 0.69 .12 0.002 .012 .003
Self-Reported Homework Cheating 22 0.27 .22 0.23 .0071 .005
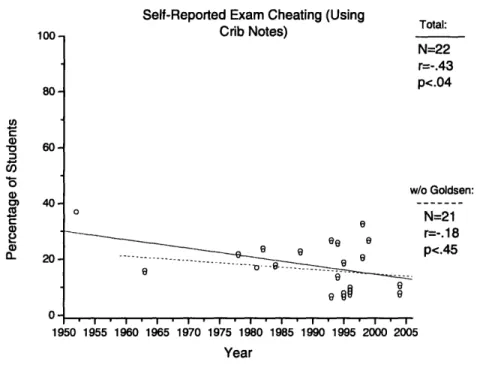
Plots for S-R Cheating (General), Graph 1, S-R Exam Cheating (Using Crib Notes), Graph 2, and S-R Unauthorized Collaboration, Graph 3, are below. See Appendix D for each of the other plots.
Self-Reported Cheating (General)
U80 - 80--c°, 60 c ' 40 n 2 0-o O 0 o O O 0 0 00 0 ° Total: ° O1 N = 52 r =.53 p < .0001 w/o Goldsen: o o 0 N =51 eo r = .07 o p<.70 0 0 I I . I . I . I . I . I . I . I . I . I 1950 1955 1960 1965 1970 1975 1980 1985 1990 1995 2000 2005 Year
Figure 1-1: Self-Reported Cheating (General): The solid line shows that S-R Cheating (General) has increased -1.6x between 1955 and 2005. However, excluding the Goldsen et al. (1960) study, S-R Cheating (General) shows no significant increase between 1965 and 2005 (dashed line).
Self-Reported Exam Cheating (Using
Crib Notes) Total:
N=22 r=-.43 p<.04 w/o Goldsen: e N=21 0 e ee e
6--
..
o-- 6,---.
eB0
=-.145 p<.45 6 6 1950 1955 1960 1965 1970 1975 1980 1985 1990 1995 2000 2005 YearFigure 1-2: The solid line shows S-R Exam Cheating (Using Crib Notes) decreased by 2x
between 1955 and 2005. With the Goldsen et al. study removed, no significant change is detected over the period 1965-2005 (dashed line).
Self-Reported Unauthorized Collaboration
10090 80 70 60 -50 40 30-20 10 0 1950 N=16 r=.69 00 p<.002 o O 0 /~~~~ 0 1 * 1 * - - - -1955 1960 1965 1970 1975 1980 Year 1985 1990 1995 2000 2005
Figure 1-3: S-R Unauthorized Collaboration increases by -3.5x over the period 1960-2005. 100 - 80-u, C O) *0 co (]) ZCD (9 O_C a) 0 0 60- 40- 20-O 0-ua, a) I'O 3 .5C 0) a) I I I I . I I I , I , I , I . I I , I
Summary and Discussion.
Although the 88 collected self-reported studies vary in time frames, school sample size, school characteristics, academic majors, etc., we believe when taken as a whole the data set is representative of what the average college "student" is reporting. To our knowledge, this is the first attempt at a comprehensive compilation of all available data reaching back fifty years.
Overall, the total data set suggests that S-R Cheating (General) has been increasing between 1955 and 2005. However, the result lacks robust significance because it is heavily contingent on one study - the Goldsen et al. study from 1954. Although we know no reason to formally discount Goldsen's results, the conclusion that any form of cheating is changing with time should not be affected by the removal of one study. A more valid, robust conclusion is that between the period 1965 and 2005 S-R Cheating (General) showed no statistically significant increase. The same argument applies to our treatment with regards to S-R Exam Cheating (Using Crib Notes). The robust conclusion is that there is no statistically significant decrease in S-R Exam Cheating (Using Crib Notes) between the period 1960 and 2005. The only forms of cheating that appear to be increasing with robust significance are S-R Unauthorized
Collaboration and S-R Turned in Work by Another.
Many researchers have recently claimed that cheating is "epidemic" and increasing [7, 85]. Our study contradicts the claim that cheating in general is increasing. If cheating were increasing, we would expect to see several forms of cheating increasing over time. Only one form of cheating showed a significant increase; 5 of the 11 forms of cheating show no significant trends with time. More limited longitudinal studies might justify a statistically valid claim for systematic change within their narrow domain [23, 90]; however, in spite of the perspective afforded by the 50 year time period studied here, we cannot claim that, in general, cheating is increasing. Also, our conclusion that S-R Exam Cheating (General) has not significantly changed over the last fifty years is contrary to McCabe & Trevino's [90] findings that exam cheating has significantly increased from 39% to 64% of students polled in 1963 and in 1993. One reason may be attributed to the fact that McCabe and Trevino's longitudinal comparisons only included men at selective institutions.
Standard Std. Error of
Cheating Behavior Mean Deviation the Mean
Self-Reported Cheating (General) 56.7 25.0 3.5
Self-Reported Exam Cheating(General) 31.9 19.2 3.3
Self-Reported Exam Cheating (Copied From
Another Student) 22.6 16.1 3.4
Self-Reported Exam Cheating (Helped Another
student cheat) 27.6 16.2 3.3
Self-Reported Exam Cheating (Using Crib Notes) 17.3 9.1 1.9 Self-Reported Copied Material w/o Footnoting 38.5 14.2 3.8
Self-Reported Plagiarism 26.4 16.7 3.3
Self-Reported Plagiarism (Falsified a
Bibliography) 26.1 12.8 3.6
Self-Reported Turned in Work by Another 10.3 5.0 1.1
Self-Reported Unauthorized Collaboration 37.4 20.7 5.2
Self-Reported Homework Cheating 44.2 19.2 4.1
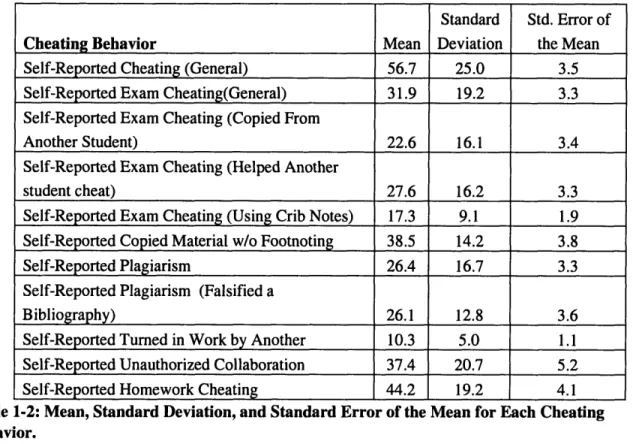
Table 1-2: Mean, Standard Deviation, and Standard Error of the Mean for Each Cheating Behavior.
We do, however, support the claims that a very significant fraction have done each form of cheating at least once. Indicative of the current state of cheating is the mean, standard
deviation and standard error of the mean for each cheating behavior (Table 1-2) The severity of the prevalence of each form of cheating depends on your definition for "epidemic." The
minimum cheating reported in Table 1-2 was -10% (Turned in Work by Another), and each of the other forms of cheating exceed 20%. The prevalence of each form of cheating should elicit concern among educators, not to mention a call for action, especially given the overall rate of S-R Cheating (General), S-S-R Exam Cheating (General), S-S-R Unauthorized Collaboration, and S-S-R Homework Cheating.
It is important to realize that these studies cover the entire college experience. The average student, who is /2 through his college coursework, has probably taken at least 30 exams,
50 quizzes, turned in 30 reports or papers, and over 100 weekly assignments. If cheating of various forms is not systematically repeated, then the fraction of students cheating on any particular exam or assignment could still be quite low.
It seems that any increase in S-R Cheating (General) can be attributed to the -3.5x increase in Unauthorized Collaboration. With many classes emphasizing group work to foster social and communication skills, the line between authorized and unauthorized collaboration has lost focus, leaving some students confused about what constitutes illegal cooperation and what does not. Working closely with others means less time spent on the assignment, less headaches when stuck on a problem, and many students believe they learn more through the process,
authorized or not [90]. Also, many businesses look for the ability to work well with others, so justification for this behavior comes easier to many students.
Surprising is the decline associated with the behavior of "Turned in Work Done by Another." Given the prominence of online paper mills and internet plagiarism, this is a behavior expected to sharply increase. More research should address this discrepancy to determine if the behavior is indeed decreasing. Quite possibly, students are increasingly underreporting the frequency of this behavior because it has received much scrutiny nationwide as more students turn to online paper mills for a quick, convenient fix to the term paper problem.
Conclusion.
We have attempted to summarize the extensive breadth of cheating research from 1955 in order to gain insight into the many forms of cheating, report an average prevalence for each form of cheating, and observe the temporal dynamics of each form of cheating. From our compilation of 88 self-reported surveys, we report that more than 56 +/- 3% of all students report that they have engaged in some form of cheating. Though the overall prevalence of self-reported cheating is disturbing, we do not find evidence that 10 of our 11 forms of cheating have increased since 1965; the exception being Unauthorized Collaboration. That reported levels of unauthorized collaboration have increased with time is not surprising given the renewed emphasis on group work and problem solving among peers; however, the conclusion that all other forms of cheating have not witnessed significant increases with time is surprising. In fact, our conclusion
contradicts what many educators have previously asserted about the nature of student cheating post- 1980.
1.2 Individual and Environmental
Factors Associated With Academic Dishonesty
Given the prevalence of self-reported cheating, several pressing questions arise: Do some groups of students cheat more (or less), who is especially at risk, and what factors can we control to reduce cheating? Within the context of self-reported cheating, these questions are addressed by correlational studies, as researchers attempt to find factors that correlate with who will report cheating and who will not. In this section we summarize published data with regards to 10 individual factors and 9 environmental factors associated with cheating (Table 1-3 lists each individual factor, the number of studies contributing data, and the reference numbers as listed in the bibliography for each study; Table 1-4 lists each environmental factor, the number of studies contributing data, and the reference number for each study).We consider individual factors to be factors associated with one person regardless of their social setting. Environmental factors are factors external to an individual that form the social construct around that person.
Individual Factor N Reference List
1, 9, 14(3), 20, 21, 26, 29, 32, 33, 43, 56, 65, 73, 75, 88, Sex 27 90, 98, 101(2), 103, 111, 124, 125, 129 Morality 12 24, 34, 41, 45, 56, 79, 80, 84, 124, 128, 131,138 Major 7 53, 99, 101, 103, 120, 122, 135 GPA 7 29, 32, 48, 53, 54, 117, 122 Cheating Norms 4 5, 47, 92, 97 Year in College 4 5,44,53,99 Social Deviance 4 8, 9, 68, 104 Race 2 101, 129 Marital Status 2 23, 48 Task Orientation 2 103, 115
Environmental Factor N Reference List 1, 5, 12, 21, 23, 30, 44(10), 46, 48, 58, 65, 67, 69, 77(2), 78, 80, 86, 87, 92, 93, 97, 99, 103, 110, 122, 124, 135, 143, School Size 40 148, 149 1, 5, 12, 21, 23, 30, 44(10), 46, 48, 58, 65, 67, 69, 77(2), 78, 80, 86, 93, 97, 99, 103, 110, 122, 124, 135, 137, 143, School Type 39 148, 149 Honor Codes 8 14(3), 48, 86, 88, 90, 92 Testing Environment 6 17, 59-62, 64 Classroom Environment 6 2, 15, 58, 94, 110, 126 Fraternity Membership 5 44, 48, 53, 88, 91 Level of Education 5 5, 20, 68, 106, 120
Student Work Load 3 5, 45, 82
Grade Competition 1 5
Table 1-4: Situational Factors Investigated Individual Factors Surrounding Cheating.
Gender. Studies that reported the percentage of the respective male and female
populations that self-reported cheating were analyzed to find the overall correlation with gender. Two separate statistical measures were employed for analysis. First, the effect size between the two populations was calculated using Cohen's d statistic. The effect size between the male and
female populations was +.2 standard deviations, meaning that males had a slight tendency to report more cheating than females. However, by Cohen's scale[16], this effect size is
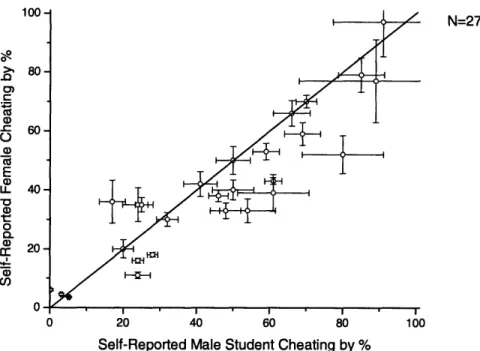
categorized as small. Whitley [ 146] conducted a gender meta-analysis with respect to cheating and also reported a small effect size with respect to the self-reported cheating of males vs. females. Figure 1-4 shows the results of each study with % males on the horizontal axis and % females on the vertical axis. Self-reported cheating gender differences are inconclusive. Further, this does not support conclusions about gender differences in actual cheating.
100 N=27
08
>, 80 ._ 0 600
E a) LL 40 'oa) 0 a) n- 20 a) 0 0 20 40 60 80 100Self-Reported Male Student Cheating by %
Figure 1-4: Male vs. Female S-R Cheating as reported in 27 studies. Points on or within error of the reference line indicate no statistical significance between the male and female populations. Of the 27 studies, 3 studies are above the line (indicating more females reported cheating), 12 studies are within the line, and 12 studies are right of the line (indicating more males reported cheating).Cohen's d statistic classifies this as a "small" effect.
Morality. No two studies presented data that could be combined as in our gender
analysis. Some researchers have found evidence that as a student's moral development increases, their reported cheating behavior decreases [24, 56, 79, 84, 131]. Stevens [128]
reported that morality was the most cited reason for not cheating, with 87% of students reporting they wouldn't cheat because of personal morals/beliefs. However, as many other studies point to the opposite conclusion. Forsyth [41], in two small experiments, concluded that cheating was not related to ethical ideologies. Other researchers have concluded the same [34, 45]. Vowell and Chin [138] reported that self-reported cheating increased with church attendance. The authors surmised that this phenomena may have more to do with the social characteristics of the students attending church, and not their religiosity. Smith [124] reported only small differences between a population of religious students and non-religious students, 57% of the non-religious students reported cheating and 52% of the religious students reported cheating. Leming [80] reported that 38% of students categorized as having "low" moral development reported cheating against 19% of students with "high" moral development. Morality and cheating may be
intuitively linked, but no conclusive evidence supports this intuition.
Academic Major. 7 studies were located that directly investigated a specific major or
made direct comparisons between majors. Using weighted averages, Figure 1-5 below shows statistically higher rates of reported cheating for business majors and engineers as compared to
science and humanities majors. However, no statistical differences are evidenced between business majors and engineering majors.
e. CD o C. a) 0n C/,
Business Engineering Science Humanities
Academic Major
Figure 1-5: Academic Major vs. S-R Cheating as reported in 8 studies.
Academic Performance. Again, studies were used when they reported the percentage of
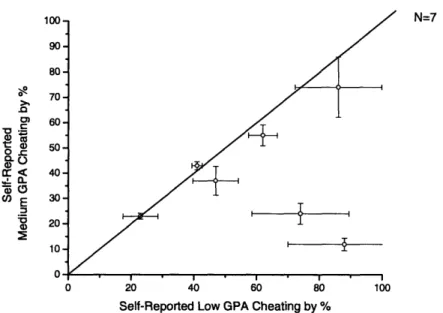
the respective achievement group that self-reported cheating. Achievement was categorized into three subsets: Low (<2.5), Average (2.5-3.3) and High (>3.3). Figure 6 shows the results of each
study with % Low GPA on the horizontal axis and % Medium GPA on the vertical axis. Figure 1-7 shows a comparison between students with Low GPA and High GPA. There is conclusive evidence that self-reported cheating correlates with low GPA.
.Q g~ o- L am M cc < o E -_ 'o100 a, N=7
Self-Reported Low GPA Cheating by %
Figure 1-6: Low GPA vs. Medium GPA S-R Cheating as reported in 7 studies. Points below
the reference line indicate more students with Low GPA reported cheating and points above the line indicate more students with Medium GPA reported cheating. 4 of the studies are left of the reference line and 3 of the studies are within error of the reference line.
1 C0 CO C.) cL a) tr .L N=5 0 20 40 60 80 100
Self-Reported Low GPA Cheating by %
Figure 1-7: Low GPA vs. High GPA S-R Cheating as reported in 5 studies. All five of the studies are right of the reference line.
i
6
Cheating Norms. This individual factor relates how "normative" a student views
cheating. In 1980, Baird reported that 40% of the students reported they felt cheating was a "normal" part of school [5]. Micheals and Miethe [97] reported that the frequency of a student's reported cheating increased as their peers reported cheating increased. They went on to say that with overall self-report rates above 50%, most students were guilty of cheating, thus establishing cheating as more normal than not cheating. McCabe reported similar results in 1997 [92]. In 2001, the number of students categorizing general cheating as normal grew to over 66% [47]. The research presents conclusive evidence that students are increasingly viewing cheating as "normal;" however, only one study links student's perceptions of cheating with actual cheating behaviors [97]. More research is needed that links the perception of students with their actual behaviors.
Year in College. Studies were used when they reported the percentage of the respective
year that self-reported cheating. Also, two separate statistical measures were employed for analysis. First, the effect size between the four populations (Freshman vs. Sophomores,
Freshman vs. Juniors, and Freshman vs. Seniors) was calculated using Cohen's d statistic. The effect size increased with each year of college, although even the greatest effect size, between Freshman and Seniors, is still categorized as small by Cohen's standard. See Figure 8 below. Figure 1-9 shows the results of each study with % Freshman on the horizontal axis and %
Seniors on the vertical axis. Although initially the data point toward the fact that self-reported cheating differences exist between different classes, more data is needed. First, the overall effect size is still small. Second, the sample size (4 studies) is too small to make definite conclusions. Third, we do not know whether each study queried students for cheating over the previous year or over the entire college career. Depending on this subtlety, cheating could be either increasing with class or decreasing with class, therefore we cannot conclude that cheating is related to college class.
0.45 0.40 -a) N () 0.35-a)U 0.30 0.25 -0 I
Sophmore vs. Freshman Junior vs. Freshman Seniors vs. Freshman
Figure 1-8: Effect Size vs. Year of College shows a "small" effect size between successive years in college. 100 90 > 80-.Q 50 03 40- 30-0 , 20 e) 10 0 20 40 60 80 100
Self-Reported Freshman Cheating by %
Figure 1-9: Year of College vs. S-R Cheating as reported in 4 studies. 3 studies are left of the reference line, indicating a statistical difference between Senior R Cheating and Freshman S-R Cheating. 1 study is within error of the reference line.
Social Deviance. Several authors have investigated the relationship between cheating
and other forms of social deviance or crime, with the hypothesis that cheating is a form of social deviance. Beck [8] noted Pearson correlation coefficients above r = .5 (p < .01) for the relationship between cheating and two other forms of deviance: lying and stealing. Blankenship and Whitley [9] concluded that past cheating behavior is predictive of future deviant behavior. Nonis and Swift [104] found that business students who previously engaged in academic cheating behaviors were more likely to engage in workplace dishonesty. Jensen et al. [68] also reported that students who had lenient attitudes towards cheating were more tolerant of other forms of deviance. The presented data show conclusively that cheating is positively related to other forms of social deviance.
Race. Surprisingly, only two studies reported data related to race. Nathanson [101]
reported cheating as detected on an assignment using plagiarism detection software. There was no difference reported for Caucasian and Black students, although there were slightly higher rates of Asian cheating detected as compared to other ethnic groups. Tang [129] also reported no difference between Caucasian and Black cheating rates. The data are incomplete regarding the relationship between race and self-reported cheating.
Marital Status. Only two studies have investigated the differences between cheaters with
respect to marriage [23, 48]. Both studies report that married students report far lower rates of cheating than single students. Haines et al. [48] reported that 61% of single students reported cheating vs. only 25% of married students. More research is required to further validate this individual factor.
Task Orientation. While many studies focus on the demographics surrounding cheating
students, few studies focus on the underlying motivations of these students. One motivation is task orientation-the internal goal of the student within a particular class or subject. Students may either be motivated to work hard in a class because they value the knowledge to be gained, while others are simply goal oriented-focusing on achieving a passing mark in order to graduate, meet scholarship demands, please parents, etc. Two studies mention and investigate this factor. Sandoe and Milliron [115] report that students who are motivated to learn the course material are less likely to cheat. Newstead et al. [103] reported that students classified as "stopgap," i.e. goal-oriented, reported cheating rates of 24% against students who were focused on personal learning reported cheating rates of 17%. Neither of these studies provide conclusive evidence, and this aspect of cheating deserves further inquiry.
Situational Factors Surrounding Academic Dishonesty.
School Size: Large vs. Small. We categorized school sizes into small (< 5,000) and large
(> 5,000) based on their respective enrollments during the year of the study. Data was collected
from 40 studies and is summarized using weighted averages in Figure 1-10. 73.4 % of students from large schools (16 studies) self-reported cheating compared with only 54% of students from small schools (24 studies). A bias may exist in this analysis because of the boom in college
enrollment over the last 30 years. Studies that reported cheating rates from public schools considered large today, were measured as small for this analysis because in 1960 their enrollment was below 5,000. The data shows conclusively that more cheating is reported on large campuses vs. small campuses.
80- 70-c: 60-._ Q) .- 50-0 * 40-Q. 0) rC 30-a) 20- 10-N = 40 Large ( > 5,000) Small (< 5,000) School Size
Figure 1-10: Size of School vs. S-R Cheating. Small schools self-report significantly less
cheating than do large schools.
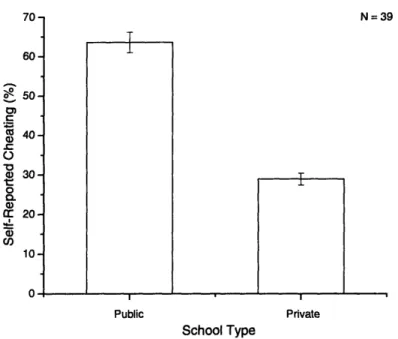
School Type: Public vs. Private. 39 Studies reported whether a school was public or
private when disclosing data. Data were analyzed using a weighted average for both
populations. Of the 39 studies, 31 reported data from public colleges and 8 reported data from private colleges. Studies reporting mixed data where the data could not be separated were not used. Figure 1-11 shows there is a significant difference between the self-reported cheating at public vs. private colleges. Two reasons could account for bias. One, the data were collected over a large time period, with the Goldsen et al. [44] study in 1960 reporting lower levels of cheating than all other studies after 1965. Two, students at private colleges may not report cheating as readily as students at public colleges. Because of these reasons, we conclude that more research specifically targeted on this subject is required.
T 60- 50-c a) 40-X 30-o 0 a) C- 20-1 U) 10 - 0-I-, T Public Private School Type
Figure 1-11: School Type vs. S-R Cheating. Public schools report more than twice the
amount of cheating than private schools report.
Honor Codes. This factor is among the most often cited in the relevant literature. It is
also the measure most often recommended for the reduction of cheating and perhaps the most misunderstood. McCabe [94] claims that the value of an honor code is understated; that honor codes play a significant role in the reduction of student cheating by fostering an environment of higher standards. Figure 1-12 below shows a statistical difference exists between the self-reported cheating at schools with honor codes and schools without honor codes. A study conducted by Hall and Kuh [50], that unfortunately did not include prevalence percentages, reported no statistical difference between cheating rates at three schools with honor codes and other schools without honor codes. The three schools with honor codes included a large, state school, a regional mid-size state school, and a small liberal arts school. Hall and Kuh attribute McCabe's results to very selective schools that contain other contextual factors that may explain the lower rates of self reported cheating-mainly schools founded on religious ideals. McCabe's study may have been influenced by the classic "Pygmalion" effect from social psychology: Students at honor code universities are expected to have higher ethical standards and lower rates of cheating; therefore, when confronted with the survey they feel obligated to report low rates of cheating regardless of the actual truth. The data are inconclusive that honor codes result in less reported cheating.
32
70- N = 39
T
N=8 30- 25-c O g 15-0) a) 5-0 T
Honor Code No Honor Code
Figure 1-12: School Honor Codes vs. S-R Cheating as reported in 8 studies
Testing Environment. 6 studies were located that investigated the testing environment
and its effect on cheating. Houston [59-62, 64] has shown that three major actions can help to reduce cheating during a multiple choice test:
-Assigned Seating -Alternate Test Forms -Sanctioned Threats
Houston has shown that spaced and assigned seating vs. unspaced and/or free seating can reduce cheating by -30%. Using alternate test forms and sanctioned threats also helped to reduce cheating. Covey [17] has shown that close surveillance during tests can help to reduce cheating. The research presents conclusive evidence that the testing environment can influence student cheating.
Classroom Environment. 6 studies were located that addressed the topic of the
classroom environment, specifically class size and class type. Pulvers et al. [110] reported that students who reported cheating viewed their classes as less personal. McCabe [94] reported that larger classes showed a small but significant correlation with higher levels of reported cheating. Hollinger [15] reported that 70% of students polled said that smaller classes could reduce cheating. Steininger [ 126] reported that among students top 4 reasons to not engage in cheating were meaningful tests, interesting classes, and quality professors. Finally, Ahmed [2] reported that students were less likely to cheat as student-teacher familiarity increased. Taken as a whole, the research presented here indicates that smaller classes with more individualized attention and increased student professor interaction can impact reported rates of cheating.
Fraternity/Sorority Membership. 5 studies were located that directly compared fraternity
membership and cheating prevalence. Fraternity members report an average of -20 +/- 5% more I
i
cheating than non-members (Figure 1-13). The data are conclusive that fraternity members report more cheating than non-members.
1u oZ = E C) O Co N=5 0 10 20 30 40 50 60 70 Self-Reported Cheating of Non-Fraternity Students by % 80 90 100
Figure 1-13: Fraternity Membership vs. S-R Cheating as reported in 5 studies. All 5 studies are to the left of the reference line, indicating a statistically significant difference between the reported cheating of fraternity members and non-members.
Level of Education: High School vs. College. 5 studies were located that directly queried
each student for both high school cheating prevalence and collegiate cheating prevalence. Figure 1-14 below shows a statistical difference between high school cheating and collegiate cheating. The data are conclusive that college students report that they cheated more in high school than in college. 34 are f I 4 3
IUU 90 80 >, 70 -0 C 60 t 40 : M 0) 30 CO 30 2 o 20 10 0 0 10 20 30 40 50 60 70 80 90 100 Self-Reported High School Cheating by %
Figure 1-14: High School vs. Collegiate S-R Cheating as reported in 5 studies. All 5 studies
are to the right of the line, indicating a statistically significant difference between S-R Cheating in
High School and College.
Student Workload. Three studies reported data related to students perceived workload
and their cheating motivations. Baird [5] reported that 26% of students (N= 200) indicated that heavy academic workloads were the reasons they cheated. Graham [45] reported that 60% of students listed heavy academic workloads as the reason behind their cheating. Lipson and McGavern [82] reported the top three reasons behind student cheating were overly
time-consuming assignments, overly difficult assignments, and multiple assignments due on the same day. All of these three reasons are directly linked with student workload. Although the
presented research indicates a positive correlation between student workload and cheating, more research is required to further validate and quantify this environmental factor.
Grade Competition. Although many studies [45, 103] attribute grades as the principle
reason behind student cheating, only one study investigated the phenomena of grade competition. Baird [5] reported that 35% of students (N=200) listed grade competition as the principal reason behind their cheating, the most of any listed reason. More research is required to further validate this environmental factor.
Summary and Discussion.
Results of our conclusions concerning the relationship between the reviewed factors and cheating are summarized in Tables 1-5 and 1-6. Of the individual and situational factors
investigated, 9 factors presented an incomplete picture due to insufficient study sample size or existing biases. These factors include Cheating Norms, Year in College, Race, Marital Status, Task Orientation, School Type, School Size, Student Workload, and Grade Competition. For
_ _
each of these factors, further research is recommended to determine whether an effect on cheating behavior does or does not exist. Significant supporting data exists for 4 factors: Sex, Morality, Academic Major, and Honor Codes; however, for each of these factors published data present conflicting results, therefore we also consider the relationship between these factors and cheating as inconclusive. We observe significant, results for the relationship between the remaining factors and cheating. These 6 factors are GPA, Social Deviance, Testing Environment, Classroom Environment, Fraternity/Sorority Membership, and Level of Education.
Individual Factor N Conclusion
Sex 27 Inconclusive (Conflicting Results) Morality 12 Inconclusive (Conflicting Results) Major 7 Inconclusive (Conflicting Results) GPA (High vs. Low) 7 Conclusive (Low GPA -- More Cheating) Cheating Norms 4 Inconclusive (Sample Size)
Year in College 4 Inconclusive (Sample Size)
Social Deviance 4 Conclusive (Deviance --, More Cheating) Race 2 Inconclusive (Sample Size)
Marital Status 2 Inconclusive (Sample Size) Task Orientation 2 Inconclusive (Sample Size)
Table 1-5: Summary of individual factors and cheating
Environmental Factor N Conclusion
School Size 40 Inconclusive (Sample Bias)
School Type 39 Inconclusive (Sample Bias) Honor Codes 8 Inconclusive (Conflicting Results)
Testing Environment 6 Conclusive (Constrained Environment -. Less Cheating)
Classroom Environment 6 Conclusive (More Teacher/Student Interaction --, Less Cheating) Fraternity Membership 5 Conclusive (Frat. Members - More Cheating)
Level of Education (HS vs. College) 5 Conclusive (High School -- More Cheating) Student Work Load 3 Inconclusive (Sample Size)
Grade Competition 1 Inconclusive (Sample Size)
Table 1-6: Summary of situational factors and cheating
Conclusions.
We have summarized the results of over 80 unique studies into the relationship between various individual and situational factors and the amount of reported student cheating. From 19 factors, we conclude that only 6 have significant relationships toward the cheating behavior of the representative groups of students. From these 6 factors, it is noteworthy that only 2 are individual factors and that most of the significant factors were based on the student's social setting. Thus, it seems that among many possible factors, the most pertinent are the
environmental factors that surround a student, and not the individual characteristics of that student. This may be too simplistic, and in individual schools and classes individual factors may outweigh social factors. However, our review of these factors should stimulate further thought, and hopefully motivate researchers to examine as to why the social setting of a student seems to have a more concrete relationship with cheating than that of the student's individual
1.3
Psychological and Social Ideas Forwarded to Explain Cheating
Cheating requires a conscious decision followed by some action; moreover it occurs within a social context. Therefore, both psychologists and sociologists can and do have theories, many backed by experimental evidence, that explain why students cheat and offer perspectives on how cheating behaviors can be reduced.
Why do students cheat? The simplest reason is for personal gain: to improve grades and future rewards based on grades [137], to avoid the penalties of bad grades (such as loss of scholarship, public embarrassment, etc), or simply to save time. Other factors influencing a student's choice to engage in a cheating behavior are dissatisfaction with the classroom
environment and coursework motivations (i.e. viewing the course outcome in task-orientation vs. a goal-orientation framework).
In an effort to understand student motivations for cheating, researchers have forwarded several social and psychological theories. Only through an understanding of what drives
students to cheat can educators enact a program aimed at the reduction of cheating. Researchers have forwarded and tested two primary social theories: Social Control Theory and Social
Learning Theory. Psychologists have proposed several models to explain cheating including the Deterrence Model, the Rational Choice Model, the Neutralization Model, and the Self Control Theory. Each psychological model proposed by psychologists can be tied to one or both social theories. A brief description and summary of results supporting or negating each social theory
and psychological model is presented.
Social control theory. Also known as Social Bond Theory [97]. Social Control Theory
states that individuals form a series of four bonds with society. These bonds are Attachment, Commitment, Involvement, and Belief [97]. "Attachment" refers to the relationships with parents, peers, and other surrounding honest individuals who insulate a person from crime. "Commitment" refers to the investment of personal interests in normal activities. "Involvement" refers to the level of participation in conventional activities. Accepting the laws, moral beliefs, and norms of our society represents "Belief"'. Students are only able to cheat once one or more of the social "bonds" are broken [31].
Micheals and Miethe's [97] results support two of the four social bonds: attachment and belief. They measured an increase of individual cheating behaviors as students reported that more of their peers were also cheaters. Students who viewed cheating as a serious, harmful behavior were less likely to report cheating. However, cheating frequency was not correlated with religious or moral beliefs. The authors noted no correlations with cheating behavior for the social bonds commitment or involvement. In their results, social bond theory accounted for 10% more variance than using the control variables alone.
Social Learning Theory. Also known as the Culture Conflict Theory [31] and derived
from Sutherland's differential association theory [83]. In Social Learning Theory, students who cheat belong to a social group which differs from a "control" social group. This smaller, deviant group holds norms and values at odds with most of society [31]. Students develop a culture of
cheating norms and values over time as they interact with other students within the deviant social group [97]. When a student is closely associated with a group whose norms include cheating, then that student is more likely to cheat and to view cheating as acceptable. Conversely, if a student's peers view cheating negatively, then their own cheating behavior is likely to be reduced.
Micheals and Miethe [97] report that Social Learning Theory accounted for 4% more variance than the control variables sex, age, class, etc. Social Learning Theory also accounted for future cheating behaviors better than other models. Vowell et al [138] remark that Micheals and Miethe's above results concerning Social Bond Theory are misplaced and could support either Social Learning Theory or Social Bond Theory. The results presented by Micheals and Miethe do not distinguish whether the bond of attachment formed by cheating students is internal or external to a separate group consisting of skewed values.
Deterrence. The Deterrence Model of cheating states that by invoking punishment
educators can deter students from cheating behaviors. Punishments ranged from course failure to expulsion. Haines et al. [48] show that the greater the utility of the act, the greater the
punishment required to deter the act, in accord with general deterrence theory. Tittle and Rowe [147] acknowledge that deterrence can reduce cheating; however, some students indicated they would continue cheating no matter the consequences. When Tittle and Rowe compared the act of a sanctioned threat against a moral appeal to stop cheating, they found that the moral appeal had no effect whereas the threat significantly reduced cheating. Tittle and Rowe also noted that students in the lowest stratum of class grades had the lowest response rate to the threat. Micheals and Miethe also showed that deterrence can reduce cheating, although they could not show that deterrence explained much of the variance (only 1%) of cheating behaviors when compared to the control variables such as age and sex.
Rational Choice Model. - Similar to the Deterrence Model; however, the Rational Choice
Model also takes into account the rewards to be gained from cheating as well as the possible punishments [97]. If a student sees the potential gains of cheating outweigh the risks, then he/she is more likely to engage in cheating. Micheals and Miethe showed that the Rational Choice Model explained 6% more variance than the control variables and that cheating increased as the cheating reward outweighed the cheating risk.
Neutralization. Neutralization is the act of rationalizing a cheating behavior as justified
even though the student knows internally it is wrong. [48]. Students make use of this technique before, during, and/or after the act of cheating. Five specific types of neutralization exist: denial
of responsibility, denial of the victim, denial of injury, condemnation of the condemners, and appeal to higher loyalties. Vowell [138] noted that the act of neutralization by a student is just an extension of social learning theory. Liska [83] and Haines et al. [48] both focused on the role of neutralization in describing the cheating behavior.
Liska [83] linked the Neutralization Model to Social Control Theory when he noted that only in situations absent of social control does the concept of neutralization play a significant role. Haines et al. [48] showed a significant difference between cheaters and non-cheaters levels
of neutralization using an 11 item test that exposed the students to situations relevant to all five types of neutralization. Further, Haines et al. demonstrated links between neutralization and deterrence because students with the greatest tendency to neutralize were most influenced by traditional deterrence methods (receiving a failing grade or being dropped from the course) and least deterred by their own guilt or the disapproval of friends.
Methods of Cheating Detection
Literature associated with the detection of cheating students is restricted to two realms: cheating on multiple choice exams and plagiarism of written course work. We investigate each situation and summarize current methods available to educators. Despite using disparate
statistics, each method compares answer similarity against all other exams or papers submitted. Finally, we discuss the underutilization of detection methods in the classroom.
The importance of standardized multiple choice tests, such as the SAT or the ACT, has raised the reward for such cheating; advocates of the Rational Choice Model would claim that students are more likely to cheat on these tests as the stakes increase. Many college courses still rely on single-form multiple choice exams, despite the relative ease with which students can cheat on these tests.
Detection of cheating on multiple choice exams.
Detection of answer similarity on multiple choice tests is not a nascent field; first studies were published over 80 years ago, though most work was initiated after 1970 [144]. The ACT (formerly known as American College Testing) has conducted at least one major research project aimed at detecting students cheating on their standardized tests [51]. Harp and Hogan [52], Rizzuto [152], Wesolowsky [144], and most recently Jacob and Levitt [66] also investigated methods of detecting cheating on multiple choice tests. Each of these methods, although employing differing statistics, relies on the detection of answer similarity between pairs of suspected exams.
Harp and Hogan [52] began investigating possible cheating on their multiple choice chemistry exams when a student reported two other students for cheating. Upon inspection of the two reported students, Harp and Hogan [52] found 97 of 98 identical answers! This included
27 wrong answers marked similarly for both students. They developed a computer program that compares pairs of student answer sheets and looks for a high ratio (>.75) of exact errors in common, i.e. exact wrongs (EEIC), to errors in common (EIC). Their cutoff was arbitrary in that they found no pairs of adjacent students with an index lower than .75. They reported finding 5 pairs of students with ratios between .79 and 1.0. After inspection of the seating chart, each
student in the pair had sat adjacent during the exam.
Wesolowsky [144] used a similar statistical method with comparable results. He assigned probabilities to each students answer based on the ability of the student and the difficulty of the question and then compared similar answer sets. The distribution of answer
similarity between pairs of students should approximate a Gaussian distribution. Cheating students with a high percentage of identical answers are revealed in the tail of the distribution. This allows the assignment of a p-value to the probability that the pair of students with similar answers is due to a Type I error. When the identification of student pairs was checked against seating charts recorded during the exam, each pair was seated in adjacent desks.