HAL Id: hal-01787891
https://hal.archives-ouvertes.fr/hal-01787891
Submitted on 7 May 2018
HAL is a multi-disciplinary open access
archive for the deposit and dissemination of
sci-entific research documents, whether they are
pub-lished or not. The documents may come from
teaching and research institutions in France or
abroad, or from public or private research centers.
L’archive ouverte pluridisciplinaire HAL, est
destinée au dépôt et à la diffusion de documents
scientifiques de niveau recherche, publiés ou non,
émanant des établissements d’enseignement et de
recherche français ou étrangers, des laboratoires
publics ou privés.
structure-based virtual screening
Maciej Wójcikowski, Pedro Ballester, Pawel Siedlecki
To cite this version:
Maciej Wójcikowski, Pedro Ballester, Pawel Siedlecki. Performance of machine-learning scoring
func-tions in structure-based virtual screening. Scientific Reports, Nature Publishing Group, 2017, 7,
�10.1038/srep46710�. �hal-01787891�
www.nature.com/scientificreports
Performance of machine-learning
scoring functions in structure-based
virtual screening
Maciej Wójcikowski
1, Pedro J. Ballester
2,3,4,5& Pawel Siedlecki
1,6Classical scoring functions have reached a plateau in their performance in virtual screening and binding affinity prediction. Recently, machine-learning scoring functions trained on protein-ligand complexes have shown great promise in small tailored studies. They have also raised controversy, specifically concerning model overfitting and applicability to novel targets. Here we provide a new ready-to-use scoring function (RF-Score-VS) trained on 15 426 active and 893 897 inactive molecules docked to a set of 102 targets. We use the full DUD-E data sets along with three docking tools, five classical and three machine-learning scoring functions for model building and performance assessment. Our results show RF-Score-VS can substantially improve virtual screening performance: RF-Score-VS top 1% provides 55.6% hit rate, whereas that of Vina only 16.2% (for smaller percent the difference is even more encouraging: Score-VS top 0.1% achieves 88.6% hit rate for 27.5% using Vina). In addition, RF-Score-VS provides much better prediction of measured binding affinity than Vina (Pearson correlation of 0.56 and −0.18, respectively). Lastly, we test RF-Score-VS on an independent test set from the DEKOIS benchmark and observed comparable results. We provide full data sets to facilitate further research in this area (http://github.com/oddt/rfscorevs) as well as ready-to-use RF-Score-VS (http://github.com/ oddt/rfscorevs_binary).
Structure-based Virtual Screening (VS)1,2 aims at identifying compounds with previously unknown affinity for a
target from its three-dimensional (3D) structure. Docking techniques are typically used to carry out this in silico prediction using their embedded scoring functions (SFs). When applied to VS, SFs seek to rank compounds based on their predicted affinity for the target as a way to discriminate between binders and non-binders. Despite the well-known limitations of SFs1,3–5, their application has been beneficial in many VS projects and successful
applications have been reported3,6–9.
Although the classical SFs used in VS experiments have often proven useful, improved accuracy requires novel approaches. Usage of more than one SF to evaluate and rank ligands from chemical libraries is now standard practice in VS. Unfortunately, SFs do not account well for conformational entropy or solvation energy contribu-tions, which is detrimental for binding affinity prediction10. Often, an empirical or knowledge-based SF is used to
generate an ensemble of viable docking poses followed by a seemingly more rigorous energy-based SF, which is applied for re-scoring the poses to rank the corresponding ligands. The choice of appropriate SF is not obvious in such usage scenarios, since the predictive accuracy of a SF varies between protein families. SFs uniquely calibrated for the data set under study are often preferred to universal SFs1,11. Unfortunately, full training of classical SFs
is often not possible. Many of them are provided in a way that does not permit changing the regression model, although a number of control parameters can be adjusted to tailor the SF to a particular target. Importantly, the underlying linear regression model employed by classical SFs has been shown to be unable to assimilate large amounts of structural and binding data12.
By contrast, machine-learning SFs provide clear advantages over these classical SFs13. Given a set of active
and inactive ligands for training, SFs such as RF-Score14, NNScore15 and SFCscore16,17 can be trained to
distin-guish between known ligands by potency with high accuracy. Indeed, the degree with which machine-learning
1Institute of Biochemistry and Biophysics PAS, Pawinskiego 5a, 02-106 Warsaw, Poland. 2Centre de Recherche en
Cancérologie de Marseille (CRCM), Inserm, U1068, Marseille, F-13009, France. 3CNRS, UMR7258, Marseille, F-13009,
France. 4Institut Paoli-Calmettes, Marseille, F-13009, France. 5Aix-Marseille University, UM 105, F-13284, Marseille,
France. 6Department of Systems Biology, Institute of Experimental Plant Biology and Biotechnology, University of
Warsaw, Miecznikowa 1, 02-096 Warsaw, Poland. Correspondence and requests for materials should be addressed to P.J.B. (email: [email protected]) or P.S. (email: [email protected])
Received: 01 December 2016 accepted: 23 March 2017 Published: 25 April 2017
OPEN
SFs have outperformed classical SFs at binding affinity prediction has been highlighted by several reviews13,18–20.
Research has been carried out on various aspects of machine-learning SFs for binding affinity prediction: how target diversity affects predictive performance21, the impact of structure-based feature selection on predictive
performance22, how to build machine-learning versions of classical SFs23, how predictive performance increases
with the size of the training data in both types of SFs12, how the quality of structural and binding data influences
predictive performance24, which machine learning (ML) methods generate more predictive SFs25, how to correct
the impact of docking pose generation error on predictive performance26 or the implementation of webservers27
and stand-alone software26,28 to make these tools freely available. It is important to note that the validation of
machine-learning SFs has generally been much more rigorous than that of most classical SFs13. For example, in
building RF-Score v3 for binding affinity prediction, no overlapping between training and test sets is permitted by construction12. Importantly, any adjustable parameter of the machine-learning SF is selected from data not
used to estimate the performance of the model13 (e.g. k-fold cross-validation29 is done for either model selection
or estimating generalization performance, but not both). Typically, neither of these safeguards against model overfitting is enforced when measuring the performance of classical SFs30.
Machine-learning SFs have also shown advantages over classical SFs in structure-based VS. On retrospec-tive VS studies, SVM-SP has strongly outperformed Glide, ChemScore, GoldScore and X-Score on HIV pro-tease31. Another prime example is that of MIEC-SVM retrospectively outperforming Glide and X-Score32 on
40 DUD2 targets, in a study that also showed that VS performance increases with training set size as expected. This machine-learning SF has also been found superior to classical SFs in prospective VS studies on kinases33.
It is still not clear however how different modelling choices affect predictive performance on particular targets. For instance, a recent study has found that the VS performance on HSP90 of a Neural Network-based SF is just comparable to that of Vina34.
In this work, we investigate what is the influence of including negative data instances (inactive molecules docked to targets) on machine learning SF. Such chimeric complexes are currently discarded from training proce-dures. Here we present an in-depth analysis of machine-learning SFs with respect to their classical counterparts, both in terms of VS and binding affinity prediction. We use the full DUD-E5 data sets for model building and
performance assessment across 102 targets using three docking tools to generate the corresponding poses. Three machine-learning SFs using structural features with different degrees of complexity are used12,14,22 and compared
to five classical SFs. We assess the VS performance of the SFs in both established-target and novel-target settings, either tailored for broad application or for a specific target.
Materials and Methods
Data provenance.
Benchmarking platform Directory of Useful Decoys – Enhanced (DUD-E) resource was used to generate various classes of non-overlapping training and testing sets intended to simulate possible appli-cation scenarios (data accessed 01.08.2016). The data set consisted of 102 protein targets, with a group of active molecules for each target (224 ligands on average) and decoys (50 decoys per active ligand). A ligand is consid-ered active if its affinity (IC50, EC50, Ki, or Kd) is 1 μ M or better. DUD-E decoys comprise ligands selected based onsimilarity to physical properties of known actives (for a particular target), but dissimilar in terms of 2D-topology. Though the inactivity of decoys has not been experimentally confirmed, these are likely to be inactive and thus this procedure minimizes the risk of selecting false negatives5.
Training and test sets.
Classical SFs are used off-the-shelf on the DUD-E benchmark test sets, which means that there might be a number of protein-ligand complexes in common with their training sets. However, this overlap should be small as these training sets contain at most a few hundred complexes (this is because the under-lying linear regression model cannot learn beyond this point12). By contrast, machine learning is able to exploitmuch larger training data sets, which would lead to a much larger overlap. Consequently, we use cross-validations on the DUD-E sets to avoid any protein-ligand complexes in common between training and test sets.
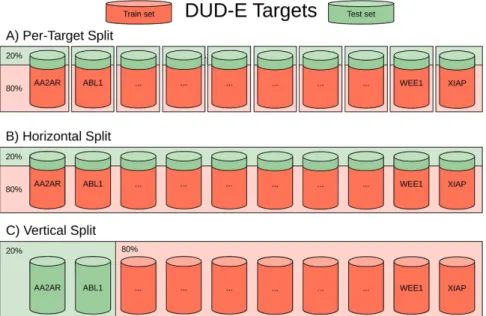
With the purpose of representing different common scenarios with respect to how much data is available for the target, we have introduced three different kinds of stratified 5-fold cross-validations (see Fig. 1) (1) per-target
– in this approach, we generate 102 unique machine-learning SFs, each created independently for a single protein
target (trained only on its active and decoys ligands); (2) horizontal split – both training and test sets contain data from all targets, i.e. each target has its ligands both in training and test sets. Such approach mimics experiments where docking is performed on targets for which there are already known ligands; (3) vertical split – the training and test data are created independently, i.e. there are no shared targets between training and test data. The vertical split represents the scenario, where SFs estimate whether a molecule binds to a target with no known ligands. As both machine-learning and classical SFs employ regression models, each SF returns a predicted real-valued score for each DUD-E protein-ligand pair that is thereafter used to rank them prior to apply the inactive cutoff and evaluate classification performance.
Validation.
The k-fold cross-validation (CV) is a commonly used strategy to reduce model overfitting. It also serves to assess applicability and generalization of predictions. Throughout this work we used 5-fold CV, which corresponds to an 80:20 test and training set ratio. This means that 80% of the data is used for training the machine-learning SF, which is afterwards tested on the remaining 20%. Such cross validation is repeated 5 times, meaning the whole dataset is divided into 5 groups (folds) of target-ligand complexes of approximately equal size. The folds are stratified – the proportions of actives/inactives preserved from original dataset. The function is learned on 4/5 of the groups and tested on 1/5 of the remaining complexes (on average). Importantly, each protein-ligand complex was present in training and test sets at some point, but never in both sets concurrently (i.e. in a single fold). This way training and test sets never overlap.www.nature.com/scientificreports/
Data normalization and compounds labelling.
Molecules from DUD-E are considered inactive when their activity on the target is weaker (i.e. lower) than pKd/i = 6 (this is the same activity cutoff which was used bythe DUD-E authors5). In order to adapt RF-Score to VS, its regression model needs to be trained on a large
pro-portion of inactive protein-ligand pairs. Therefore, all training decoys were assigned an identical inactive value of pKd/i = 5.95 (less than 1% under the activity cutoff). We have also tested lower inactive cutoffs, also reported
elsewhere18, but found these to be suboptimal (data not shown). Following common convention, data points were
converted to pKd/i units (this customary step had no significant impact on predictions made by the SFs).
Ligand poses generation.
Ligand 3D conformations were generated with three docking programs; AutoDock Vina (the Smina implementation, [http://smina.sf.net/])35,36, Dock 3.637 and Dock 6.637–39. Dock 3.6was not run in-house, instead the DUD-E docked conformations and scores were downloaded from the database website (http://dude.docking.org). Vina and Dock 6.6 software were used with default parameters. Target proteins were prepared using UCSF Chimera23 DockPrep tool. Docking box was constrained to 10 Å around the ligand
(which was included in the crystallographic structure of every protein target). Ligands were prepared and sani-tized using OpenBabel40. 50 conformations were generated with each docking methodology.
Classical Scoring Functions.
Ligand-receptor complexes were scored using several classical, commonly used SFs. We used internal SFs implemented in the three docking programs used (Vina, Dock3.6, Dock6.6). Additionally we used the CScore module of SybylX 2.141 which implements: D_Score38, G_score (known asGoldScore42), ChemScore43 and PMF_Score44. All of the above SFs have been widely used in VS.
Descriptors and machine learning models.
RF-Score is currently one of the best performing SFs at binding affinity prediction12,13. We used the descriptors from RF-Score versions v114, v222 and v312. All versionsuse the same distance cutoff; a pair is tallied as interacting when the distance between the atoms falls within the 12 Å cutoff. They differ in the number of bins used. Bins divide the basal cutoff into smaller ranges, e.g. 2 Å bins (used by v2) translates to bins of following sizes: 0–2 Å, 2–4 Å, 4–6 Å, 6–8 Å, 8–10 Å, 10–12 Å. Versions v1 and v3 use only one bin. Finally, v3 is enriched with Autodock Vina partial scores.
Each RF-Score-VS version was trained on one best scoring ligand pose (meaning the lowest score from cor-responding docking software). The number of trees in random forest (RF) was set to 500 as in the original imple-mentation (this setting has been shown to be robust45). The number of features to consider when looking for the
best split in each RF tree (“mtry”) was optimized using out-of-bag predictions (OOB). The optimized values are: 15 for v1 and v3 and 100 for v2 used in this study (i.e. we do not tune RF to DUD-E data). All RF-Score-VS cal-culations were done using ODDT28.
External dataset validation.
DEKOIS 2.03 database was used as external validation dataset. Fourover-lapping structures between DUD-E and DEKOIS 2.0 were filtered out: A2A: “2p54”, HDAC2: “3l3m”, PARP-1: “3eml”, PPARA: “3max”. Protein SIRT2 had no crystal ligand, thus was also excluded. The final, non-overlapping dataset consisted of 76 targets. In addition, we have filtered out any ligand or decoy, which was found to be nearly identical (Tanimoto score of at least 0.99; OpenBabel FP2 fingerprints) to any ligand/decoy present in DUD-E. Originally each DEKOIS protein was associated with 40 ligands and 1200 decoys, our pruning removed on aver-age 18.6 (46.5%) ligands and 188 (15.7%) decoys.
Figure 1. Per-Target, Horizontal and vertical split of DUD-E targets. Each barrel represents all the
protein-ligand complexes (actives and decoys) associated with a different target. The training sets are coloured red, the test sets with green.
Protein files were prepared according to DEKOIS 2.0 publication3 using Schrödinger Maestro suite.
Afterwards ligands and decoys were docked using Autodock Vina with default settings, as previously done with DUD-E. Docked poses were rescored with RF-Score-VS v2 and v3 scoring functions.
Metrics.
Enrichment factor (EF) is a fraction of active molecules within a given percentile of ranking list divided by random hit-rate. In DUD-E database there are 50 decoys per active ligand, hence random hit-rate is ~2%. DEKOIS database after pruning on average contains 21 actives and 1012, which translates to the same ~2% random hit rate as in DUD-E. Enrichment Factor, the area under Receiver Operating Characteristic curve (ROC AUC) and other metrics were calculated using ODDT28.Results and Discussion
The aim of the work was to mimic VS campaigns using diverse targets having a number of active and inactive ligands. It is well known that in practice the number of inactives of a target is much larger than that of actives. DUD-E dataset5 was built primarily to test performance of docking and scoring software, but it also fits into the
constrains of a screening dataset described above. It contains of 102 targets associated with 22,886 ligands with measured activity. The target types are quite diverse and consist of receptors (GPCR, chemokine and nuclear), globular enzymes, kinases and virus proteases among others. It is also heterogeneous in case of ligand abundance; Catechol O-methyltransferase (COMT) has only 41 active compounds, compared to MAP kinase p38 alpha (MK14) which has 578 unique, dissimilar compounds. On average there are 224 ligands per target and for each of them 50 decoys were generated according to procedure described by Mysinger et al.5. These decoy compounds
are presumed inactive because their chemical structures are dissimilar to those of known ligands. However, they are designed to share the same physiochemical features (number of donors/acceptors, etc.), so that discrimination between actives and inactives is not trivial. So in this setup, an average screening campaign would search through 11 200 compounds to find 224 active ligands.
The most common measure of retrospective VS performance is the enrichment factor (EF) of a method applied to a particular benchmark. When a large database of compounds is screened one takes the best scored compounds at the top of the ranked list for further evaluation. The number of experimentally tested compounds is chosen depending on various criteria, but it is usually the top of the list which is pursued (e.g. top 1%, 0.1%, etc.). Therefore, it is not the overall performance of a scoring method on the whole database, such as ROC AUC, which is most relevant for VS, but rather the performance in the top of the list, i.e. how many active compounds are among the best scored compounds. In our assessment, we focused on EF1% (fold change of active molecules
percentage within the top 1% of ranking list over random distribution) as the most relevant estimate of screening performance and machine learning predictive power.
We perform a stratified 5-fold cross validation (see materials and methods for more details), to avoid model overfitting which hampers the performance on data sets other than the training set46. It is important to note that,
while all target-ligand complexes are present at some point in training and test sets, they are never in both simul-taneously (see Materials and Methods, validation section). Finally, the mean value of the performance in 5 inde-pendent folds is calculated, which estimates how a model will perform on indeinde-pendent datasets. This prevents testing the SF on complexes used for training and reporting artificially boosted performance.
The first experiment we conducted was to train the SFs on horizontally split data. This approach mimics experiments where docking is performed on targets for which there are already known active ligands and VS is done to find new ones. Therefore, training was done on 4/5 of ligands from all 102 DUD-E targets and the model was tested on the remaining 1/5 (Fig. 1B). In this setup only a single, unique model (generic SF) is built for the whole DUD-E dataset. Such model can be directly compared to a classical SF as they are also single model func-tions, trained on a defined set of protein-ligand complexes and developed to work with diverse targets.
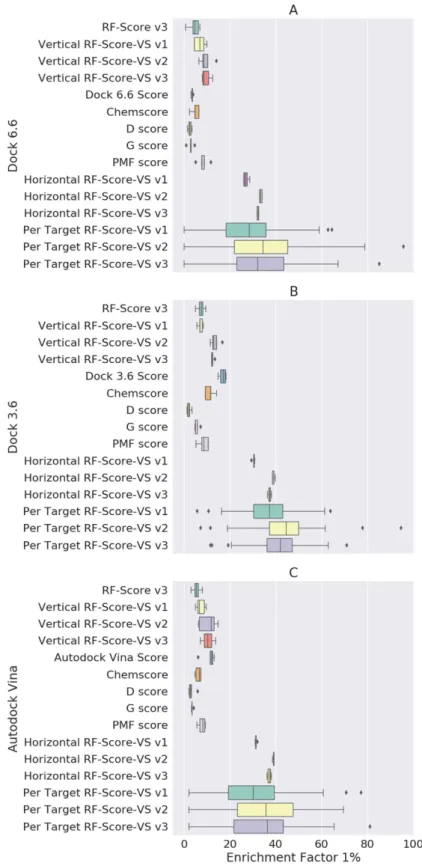
Our results show a dramatic increase of EF1% performance between the best classical compared to
machine-learning SF trained on horizontally split dataset: around two- to even 15-times increases depending on the docking engine and SF (Fig. 2). It is worth noting that the classical SF do not perform similarly here, as the obtained EF1% varied significantly both in value and standard deviation. RF-Score v3, which is one of
the best performing machine-learning SF to predict binding affinities on PDBbind, yields EF1% similar to best
performing classical approaches despite being trained on X-ray crystal structures and thus not incorporating any negative data (i.e. docked inactives) into the training set. In contrast, novel machine-learning methodol-ogy was much more robust in terms of protein-ligand complexes provided by the three docking algorithms. Independently from the docking engine the EF1% values for the developed SFs osculated mostly well above 30. The
worst machine-learning screening combination (Dock 6.6 and RF-Score-VS v1) was still almost two-times better than the best performing classical combination (Dock 3.6 and its native SF). This trend holds even for smaller top percentages. EF0.1% for the best performing classical Dock 3.6 compared to horizontal RF-Score-VS v2 is twofold
smaller (29.39 to 61.42). See Supplementary File for more results comparison.
As expected, when looking more deeply into the obtained data it was clear that results from different targets can vary significantly. There are targets that seem to be hard for the SF; defined as those with EF1% < 20. On the
other end, there are also easy targets, the SF showing outstanding performance, i.e. EF1% > 60. There was not
obvious correlation between the number of active ligands among hard or easy targets. What we found however is that the hard targets are difficult very much independently from the employed docking software or ML training approach. Thus, the problem might be due to to inaccurate 3D representation of receptor-ligand complexes or inappropriate choice of binding site for some ligands.
We also investigated the question: whether it is beneficial to train machine-learning SFs only on data specific to a particular target and then use it for screening rather than using a generic function trained on all targets. Put differently: do tailored functions perform significantly better than a generic function to justify the additional effort undertaken for training? To answer these questions, we trained a separate SF for each of the DUD-E targets
www.nature.com/scientificreports/
Figure 2. Comparison of EF1% results obtained from classical SFs: D_score, Chemscore, G_score, PMF_
score, native score (i.e. which was used to by docking software), with results from three versions of RF-Score-VS. Unlike RF-Score-VS, RF-Score v3 does not train on any negative data (this SF for binding affinity
prediction was exclusively trained on X-ray crystal structures12). Each boxplot shows five EF
1% values for a
given SF resulting from the five 80:20 data partitions (i.e. five non-overlapping test sets collectively comprising all data). All train-test splitting scenarios are present, namely vertical, horizontal and per-target. A dramatic increase in machine-learning scoring performance (measured as EF1%) can be seen in RF-Score-VS compared to
and compared its performance with the generic SF (obtained with horizontal split sketched in Fig. 1). The results of these experiments are presented in Figs 2 and 3. On Fig. 3, we demonstrate pairwise comparison of per-target and horizontal SFs. Every point is a cross-validated predictions for single DUD-E protein.
To our surprise most of the per-target functions tend to perform only slightly better than the generic, unique function, trained on all available data. Almost 2/3 of targets (64 out of 95 – some targets failed to dock with default Vina settings, thus 95 not 102) had its EF1% increased less than 10%, regardless of the docking program used. As
before, this is tested with 5-fold cross-validation and an average of test splits is the final result. Contrary to com-mon assumption there was little advantage in training machine learning scoring for most of the targets vs using a single generic approach (trained on the horizontal split dataset). This was especially visible for targets with greater number of active molecules.
In the case of hard targets, most of them did not improve by per target training. However, a subset of hard targets, generally having a lower number of active molecules (between 1 and 200), seem to benefit from such per-target training. Figure 3 shows clearly that in those cases per target training can improve performance signif-icantly. This result might come as a surprise, as in principle if a target has less data to train on, then it should be better predicted using additional data from other targets’ complexes. Figure 3 shows this is usually not the case. One explanation of these results could be that per-target training is done on a small but very specific set of inter-actions; These might be much more important for this particular target, but their low abundance in others can decrease their weight in a generic (horizontal) function. Can we improve the performance of hard targets by using additional data, but only from targets with similar active site structures? Such questions are still open.
Finally, we look at the question of how suitable machine-learning scoring is for newly discovered targets characterized by scarce data on active ligands. To answer this question, the training and test data are created independently, i.e. there are no shared targets between training and test data. We call this experiment the “Vertical split”, where machine learning SFs were not trained with any complex involving the target of interest.
As expected this significantly influences the results. Figure 2 shows that there is a drop in EF1% performance
between horizontal SF (which was oscillating around 35–40 and more) and Vertical RF (which is in the area between 10 and 15). The results from different versions of RF-Score descriptors were also less robust to the influ-ence of conformations provided by docking engines. Nevertheless, this dispersion is still smaller than obtained from a classical approach.
In the case of Dock 6.6 (Fig. 2A), the best classical SF (PMF-Score) obtained an EF1% comparable to vertical
RF-Score-VS v1. RF-Score-VS v3 however performed significantly better than PMF, twofold better compared to the second best ChemScore function (11.4 vs. 4.9 respectively) and 3 to 4-times better than the remaining three functions (D-Score, G_Score and Dock 6.6 built-in function). In fact, a similar pattern can be observed with all three docking algorithms (Fig. 2B and C); ChemScore and PMF-Score are the best performing classical SFs with EF1% comparable to vertical RF-Score-VS v1. Nevertheless, RF-Score-VS v2 and v3 outperform all classical
approaches in this scenario. Interestingly, the EF1% value obtained with Dock3.6 and its built-in native function
(Fig. 2B, Dock 3.6 Score) was unexpectedly high in comparison with other classical SFs. Dock3.6 was the only SF that we did not run ourselves, as both its docked molecules and predicted scores were downloaded directly from DUD-E website. Therefore, we assume that there was some kind of tailored procedure for each target prior or after docking, which is a potential source of overfitting. In our procedure (as described in the materials and methods section), we have not done any work on the receptor nor ligand datasets. In addition, we have only used the default settings for all the SFs that we have tested, including the two other docking algorithms Dock 6.6 and Autodock Vina.
The results obtained from the vertical split experiments show that machine-learning SF (such as RF-Score-VS v3) trained on data from other targets is: 1) able to outperform the five tested classical SF without the need for any
Figure 3. Comparison of EF1% results from Per-Target and Horizontal-split models. Each data point is a
separate corresponds to the performance of both models on a particular DUD-E target. The darker is the colour of DUD-E target is, the more active ligands it has. Docking conformations were obtained from Autodock Vina. Dashed red line denotes equal performance, and dotted green line show 5-unit intervals. For most targets and contrary to common assumption, there is little advantage in training machine machine-learning SFs for per-target vs using a more generic approach (in this case horizontal split), especially for per-targets with greater number of active molecules.
www.nature.com/scientificreports/
calibration steps and 2) less sensitive to docking conformation than the classical SFs. These results are relevant for the case where in silico screening is used with a novel target with no known active ligands. As shown, using RF-Score-VS v3 would make screening much more simple (no need to use different docking, tailor them to each target or SF) and still produce better results.
In the case of Dock 3.6 results, it would seem that a manually calibrated VS experiment using carefully chosen classical SF may be capable of performing as well as RF-Score-VS v3 when absolutely no complex of the predicted target is used. This is a rare situation that simulates structure-based VS on completely new targets. For such tar-gets there is simply not enough data to properly calibrate the classical procedure, and so there is no simple way to make an educated guess on which combination of docking parameters and SFs to choose. In fact, the Dock 3.6 case is an example where model selection and performance measurement are both carried out on the training data, which is known to lead to an unrealistically high estimation of the generalization error of the model (in this context, how well the SF with exactly the same settings will rank other molecules docked to the same target). It is therefore worth mentioning that even in such extreme setup as described above (the control parameters tuned on data not available to machine-learning procedure) RF-Score-VS v3 results were still comparable to the overfitted classical SF.
Validation on an independent test set.
We have also tested RF-Score-VS trained with the entire DUD-E (15 426 active molecules and 893 897 inactive molecules across 102 targets) on an external data set. Such data set is hard to find as either most of the targets overlap between sets or they provide a small number of ligands per target. In contrast, the DEKOIS 2.0 benchmark overcomes both obstacles: only 4 of the 81 DEKOIS targets are also in the DUD-E benchmark (see Methods section for further details).The results of early enrichment for 76 DEKOIS targets are summarized on Fig. 4. Autodock Vina, which in previous experiments was the best scoring function run in-house, achieved EF1% = 3.95 and RF-Score v3 scored
EF1% = 2.94. These results are in line with what was obtained with DUD-E data. By contrast, RF-Score-VS v2 and
v3 performances were EF1% = 9.84 and EF1% = 7.81, respectively, thus more than doubling the active compounds
yield in the top 1%. Despite the achieved improvement, structure-based VS remains a challenging problem on a number of targets, where all three SFs fail to find any active within the top 1% of their ranked lists. Therefore, it is clear that more work is needed to advance further in this problem.
Top results analysis.
Boxplots in Fig. 2 show summaries of the classification data. If a compound was in the top 1% of ranking list and it was active the enrichment factor (EF1%) value increased, if it was a decoy (presumedinactive) EF1% decreased. These plots however do not show if these top 1% molecules are actually the most active
ones. Thus, we can check whether machine-learning methodology predict binding affinity better than a classical SF. The scatter plots presented in Fig. 5 address these questions. We took the original 1% of the best in silico pre-dictions for each DUD-E target (i.e. on average about 86 compounds per target) and assessed how their scores correlate with experimentally measured activity (derived from DUD-E database per-target).
Figure 5A displays the results obtained with the best classical SF, among those ran in-house (Autodock Vina and its native SF) compared to two training versions of RF-Score-VS: the generic (horizontal split) func-tion Fig. 5B and to the novel target (vertical split) funcfunc-tion Fig. 5C. The results indicate a clear advantage of score-affinity correlation for both training cases, compared to the best classical approach. Autodock Vina and its native SF obtains a Pearson correlation of Rp = − 0.18 (this is actively a positive correlation as low Vina scores
aim at being indicative of high binding affinity), where RF-Score-VS v2 horizontal split receives an impressive Rp = 0.56. Even in the less favourable scenario, the obtained vertical split is already Rp = 0.2. This can also be seen
on the supporting ordinate and abscissae plots where compounds distribution resembles a normal distribution, while with classical SF the decoys clearly overwhelm the actives counts.
Figure 4. Boxplots presenting EF1% for Autodock Vina, RF-Score v2 and novel RF-Score-VS v2 and
v3 training on negative data on the part of the DEKOIS 2.0 benchmark not overlapping with DUD-E benchmark (i.e. different targets, ligands and decoys).
More importantly, machine-learning SFs trained with a high proportion of inactive instances (red dots) are much better at discriminating between actives (green dots) and inactives (red dots). For example, in Fig. 5A many inactives are nevertheless predicted to be active by Vina, but this is not the case with horizontally-trained RF-Score-VS v2. In the Vertical split more decoys are present but still much fewer than with classical approach and only few of them have high predicted affinities. When taken together, in the top 1% of all target screens, the horizontal split RF-Score-VS v2 obtained 55.6% (4875/8816) active compounds, whereas in the classical approach only 16.2% (1432/8816) of compounds where active. Moreover, the proportion of actives of RF-Score-VS is even more impressive with 88.6% (825/931) for the top 0.1% results, a much higher hit rate than that of Vina (27.5%; 256/931).
These results demonstrate how large is the improvement introduced compared to a widely-used classical SF– the novel approach has over three times greater yield of active ligands.
Conclusions
The presented analysis demonstrates that previously implemented machine-learning SFs using RF-Score descrip-tors can excel at VS, if appropriate care is taken. Several cross-validation scenarios show that in any application RF-Score-VS comfortably outperforms classical SFs, even when using the most crude RF-Score v1 features14,22.
We report average enrichment factors (EF1%) across DUD-E targets to be 39 for generalized-
(horizon-tal split) and 43.43 for specialized SF (per-target model), whereas the best classical approach (Dock 3.6) yields EF1% = 16.86. This result translate to over 2.2 fold improvement in early enrichment showing exceptional
advan-tage of RF-Score-VS in VS. Discriminating between actives and inactives is not the only task at which our pro-posed methods excel, as we also show the scoring and ranking power of our novel method. Pearson correlation of RF-Score-VS is three times better at reproducing top scored affinities (Rp = 0.56 for RF-Score-VS v2 vs Rp = − 0.18
for Autodock Vina). For smaller top percentage, i.e. 0.1%, hit-rate advance of RF-Score-VS is even more evident −88.6% vs 27.5%.
In addition, we present results evidencing that it is not true that SFs based on RF-Score descriptors are “unable to enrich virtual screening hit lists in true actives upon docking experiments”46. We also comment on a statement
made in a recent review47, where a 10% hit-rate was considered to be an upper limit to what SFs can nowadays
deliver. In this study, RF-Score-VS achieves a hit rates as high as 88.6% across DUD-E targets, which is an out-standing performance. In addition to VS performance, we also show that docking equipped with cutting-edge machine-learning SFs will predict binding affinity accurately (Rp = 0.56) in the context of structure-based VS.
Developing new descriptors and validating other models is out of scope of this publication. However, we acknowledge that RF-Score v1 descriptors are not optimal, e.g. the generous 12 A cutoff might be in fact less sensi-tive to detecting subtle structural changes in protein-ligand complex. RF-Score v1 descriptors were only intended to show that the sophisticated descriptors that have dominated the research in this area generally add very little to performance, as it can be clearly seen here in terms of VS and binding affinity prediction. On the other hand, supplementing v1 descriptors with Vina partial scores is in most cases as beneficial as using v2, therefore a com-bination of them might be the most fruitful.
Research on the optimal application of machine learning to structure‐based VS is highly promising, but it is still in its infancy due to being a more complex endeavour than binding affinity prediction from crystal structure of protein-ligand complexes. Indeed, training data sets for structure-based VS are much larger than those used binding affinity prediction and require prior docking of each considered molecule. Future work in this area is expected to yield particular insight in terms of improving our ability to discriminate between actives and inactives across targets. Even larger amounts of data can be used following the described procedure. Many other machine learning techniques can be applied to structure-based VS. This is not only restricted to regression techniques, but also classifiers. For example, state-of-the-art multi-category classifiers48. Another promising avenue for future
Figure 5. Predicted vs measured activity. Top 1% of compounds predicted to be active for each target in
DUD-E by (A) the Autodock Vina and its native SF (Rp = − 0.18); (B) RF-Score-VS v2 trained on horizontally
split dataset (Rp = 0.56); and (C) RF-Score-VS v2 trained on vertically split dataset (Rp = 0.2). Red points
represent decoys (putative inactive compounds), green points – compounds with measured activity. Predicted values for machine-learning SFs are taken from the relevant cross-validation split.
www.nature.com/scientificreports/
research is feature selection, not only in terms of the performance improvement but also considering the stability of the predictors49.
All data (docked poses) and workflow scripts required to recreate the generation of descriptors and train-ing of machine-learntrain-ing models are released here to the relevant research communities, maktrain-ing our software reproducible and for others to build upon it (http://github.com/oddt/rfscorevs). We also propose a standalone machine-learning based SFs RF-Score-VS v2 and v3, as a general purpose and target independent VS tools. To the best to our knowledge, RF-Score-VS is the best performing SF in terms of early enrichment EF1% on DUD-E.
RF-Score-VS can be downloaded from https://github.com/oddt/rfscorevs_binary (it is provided as standalone binary for Windows, Mac and Linux without any further dependency, with wide range of supported molecular formats). Alternatively RF-Score-VS may be used with ODDT toolkit environment as a drop-in replacement for any other SF in custom workflows and other software.
References
1. Schneider, G. Virtual screening: an endless staircase? Nat. Rev. Drug Discov. 9, 273–276 (2010).
2. Scior, T. et al. Recognizing Pitfalls in Virtual Screening: A Critical Review. J. Chem. Inf. Model. 52, 867–881 (2012).
3. Bauer, M. R., Ibrahim, T. M., Vogel, S. M. & Boeckler, F. M. Evaluation and Optimization of Virtual Screening Workflows with DEKOIS 2.0 – A Public Library of Challenging Docking Benchmark Sets. J. Chem. Inf. Model. 53, 1447–1462 (2013).
4. Boström, J., Hogner, A. & Schmitt, S. Do Structurally Similar Ligands Bind in a Similar Fashion? J. Med. Chem. 49, 6716–6725 (2006).
5. Mysinger, M. M., Carchia, M., Irwin, J. J. & Shoichet, B. K. Directory of Useful Decoys, Enhanced (DUD-E): Better Ligands and Decoys for Better Benchmarking. J. Med. Chem. 55, 6582–6594 (2012).
6. Siedlecki, P. et al. Discovery of two novel, small-molecule inhibitors of DNA methylation. J. Med. Chem. 49, 678–683 (2006). 7. Odolczyk, N. et al. Discovery of novel potent Δ F508-CFTR correctors that target the nucleotide binding domain. EMBO Mol. Med.
5, 1484–1501 (2013).
8. Kar, S. & Roy, K. How far can virtual screening take us in drug discovery? Expert Opin. Drug Discov. 8, 245–261 (2013).
9. Kiss, R. et al. Discovery of Novel Human Histamine H4 Receptor Ligands by Large-Scale Structure-Based Virtual Screening. J. Med.
Chem. 51, 3145–3153 (2008).
10. Gilson, M. K. & Zhou, H.-X. Calculation of Protein-Ligand Binding Affinities. Annu. Rev. Biophys. Biomol. Struct. 36, 21–42 (2007). 11. Spyrakis, F. et al. The consequences of scoring docked ligand conformations using free energy correlations. Eur. J. Med. Chem. 42,
921–933 (2007).
12. Li, H., Leung, K.-S., Wong, M.-H. & Ballester, P. J. Improving AutoDock Vina Using Random Forest: The Growing Accuracy of Binding Affinity Prediction by the Effective Exploitation of Larger Data Sets. Mol. Inform. 34, 115–126 (2015).
13. Ain, Q. U., Aleksandrova, A., Roessler, F. D. & Ballester, P. J. Machine-learning scoring functions to improve structure-based binding affinity prediction and virtual screening. WIREs Comput Mol Sci (2015).
14. Ballester, P. J. & Mitchell, J. B. O. A machine learning approach to predicting protein-ligand binding affinity with applications to molecular docking. Bioinforma. Oxf. Engl. 26, 1169–1175 (2010).
15. Durrant, J. D. & McCammon, J. A. NNScore 2.0: a neural-network receptor-ligand scoring function. J Chem Inf Model 51, 2897–2903 (2011).
16. Sotriffer, C. A., Sanschagrin, P., Matter, H. & Klebe, G. SFCscore: scoring functions for affinity prediction of protein-ligand complexes. Proteins 73, 395–419 (2008).
17. Zilian, D. & Sotriffer, C. A. SFCscore(RF): a random forest-based scoring function for improved affinity prediction of protein-ligand complexes. J. Chem. Inf. Model. 53, 1923–1933 (2013).
18. Cheng, T., Li, Q., Zhou, Z., Wang, Y. & Bryant, S. H. Structure-Based Virtual Screening for Drug Discovery: a Problem-Centric Review. AAPS J. 14, 133–141 (2012).
19. Huang, S.-Y., Grinter, S. Z. & Zou, X. Scoring functions and their evaluation methods for protein–ligand docking: recent advances and future directions. Phys. Chem. Chem. Phys. 12, 12899–12908 (2010).
20. Ma, D.-L., Chan, D. S.-H. & Leung, C.-H. Drug repositioning by structure-based virtual screening. Chem Soc Rev 42, 2130–2141 (2013).
21. Ballester, P. J. & Mitchell, J. B. O. Comments on ‘Leave-Cluster-Out Cross-Validation Is Appropriate for Scoring Functions Derived from Diverse Protein Data Sets’: Significance for the Validation of Scoring Functions. J. Chem. Inf. Model. 51, 1739–1741 (2011). 22. Ballester, P. J., Schreyer, A. & Blundell, T. L. Does a more precise chemical description of protein-ligand complexes lead to more
accurate prediction of binding affinity? J Chem Inf Model 54, 944–955 (2014).
23. Li, H., Leung, K.-S., Wong, M.-H. & Ballester, P. J. Substituting random forest for multiple linear regression improves binding affinity prediction of scoring functions: Cyscore as a case study. BMC Bioinformatics 15, 291 (2014).
24. Li, H., Leung, K.-S., Wong, M.-H. & Ballester, P. J. Low-Quality Structural and Interaction Data Improves Binding Affinity Prediction via Random Forest. Molecules 20, 10947–10962 (2015).
25. Ashtawy, H. M. & Mahapatra, N. R. A Comparative Assessment of Predictive Accuracies of Conventional and Machine Learning Scoring Functions for Protein-Ligand Binding Affinity Prediction. IEEEACM Trans. Comput. Biol. Bioinforma. IEEE ACM 12, 335–347 (2015).
26. Li, H., Leung, K.-S., Wong, M.-H. & Ballester, P. J. Correcting the impact of docking pose generation error on binding affinity prediction. BMC Bioinformatics 17, 13–25 (2016).
27. Pires, D. E. V. & Ascher, D. B. CSM-lig: a web server for assessing and comparing protein–small molecule affinities. Nucleic Acids Res
44, W557–W561 (2016).
28. Wójcikowski, M., Zielenkiewicz, P. & Siedlecki, P. Open Drug Discovery Toolkit (ODDT): a new open-source player in the drug discovery field. J. Cheminformatics 7, 26 (2015).
29. Refaeilzadeh, P., Tang, L. & Liu, H. In Encyclopedia of Database Systems (eds Liu, L. & Tamer Özsu, M.) 532–538 (Springer US, 2009).
30. Irwin, J. J. Community benchmarks for virtual screening. J Comput Aided Mol Des 22, 193–199 (2008).
31. Li, L., Wang, B. & Meroueh, S. O. Support vector regression scoring of receptor-ligand complexes for rank-ordering and virtual screening of chemical libraries. J Chem Inf Model 51, 2132–2138 (2011).
32. Ding, B., Wang, J., Li, N. & Wang, W. Characterization of small molecule binding. I. Accurate identification of strong inhibitors in virtual screening. J Chem Inf Model 53, 114–122 (2013).
33. Sun, H. et al. Constructing and Validating High-Performance MIEC-SVM Models in Virtual Screening for Kinases: A Better Way for Actives Discovery. Sci Rep 6, 24817 (2016).
34. Sunseri, J., Ragoza, M., Collins, J. & Koes, D. R. A D3R prospective evaluation of machine learning for protein-ligand scoring. J
Comput Aided Mol Des 1–11 (2016).
35. Trott, O. & Olson, A. J. AutoDock Vina: improving the speed and accuracy of docking with a new scoring function, efficient optimization, and multithreading. J Comput Chem 31, 455–461 (2010).
36. Koes, D. R., Baumgartner, M. P & Camacho, C. J. Lessons learned in empirical scoring with smina from the CSAR 2011 benchmarking exercise. J. Chem. Inf. Model. 53, 1893–1904 (2013).
37. Mysinger, M. M. & Shoichet, B. K. Rapid Context-Dependent Ligand Desolvation in Molecular Docking. J. Chem. Inf. Model. 50, 1561–1573 (2010).
38. Kuntz, I. D., Blaney, J. M., Oatley, S. J., Langridge, R. & Ferrin, T. E. A geometric approach to macromolecule-ligand interactions. J
Mol Biol 161, 269–288 (1982).
39. Lang, P. T. et al. DOCK 6: combining techniques to model RNA-small molecule complexes. RNA 15, 1219–1230 (2009). 40. O’Boyle, N. M. et al. Open Babel: An open chemical toolbox. J Cheminform 3, 33 (2011).
41. Certara USA, Inc. SybylX 2.1.
42. Jones, G., Willett, P., Glen, R. C., Leach, A. R. & Taylor, R. Development and validation of a genetic algorithm for flexible docking. J
Mol Biol 267, 727–748 (1997).
43. Baxter, C. A., Murray, C. W., Clark, D. E., Westhead, D. R. & Eldridge, M. D. Flexible docking using Tabu search and an empirical estimate of binding affinity. Proteins 33, 367–382 (1998).
44. Muegge, I. PMF scoring revisited. J Med Chem 49, 5895–5902 (2006).
45. Svetnik, V. et al. Random forest: a classification and regression tool for compound classification and QSAR modeling. J. Chem. Inf.
Comput. Sci. 43, 1947–1958 (2003).
46. Hawkins, D. M. The problem of overfitting. J Chem Inf Comput Sci 44, 1–12 (2004).
47. Irwin, J. J. & Shoichet, B. K. Docking Screens for Novel Ligands Conferring New Biology. J Med Chem 59, 4103–4120 (2016). 48. Lin, C. et al. LibD3C: Ensemble classifiers with a clustering and dynamic selection strategy. Neurocomputing 123, 424–435 (2014). 49. Zou, Q., Zeng, J., Cao, L. & Ji, R. A novel features ranking metric with application to scalable visual and bioinformatics data
classification. Neurocomputing 173, Part 2, 346–354 (2016).
Acknowledgements
This work was supported by the Polish Ministry of Science and Higher Education POIG.02.03.00-00-003/09-00 and POIG.02.02.00-14-024/08-00.
Author Contributions
M.W. carried out the design and implementation of the software. P.J.B. and P.S. designed the study. All authors wrote the manuscript and analyzed the results.
Additional Information
Supplementary information accompanies this paper at http://www.nature.com/srep Competing Interests: The authors declare no competing financial interests.
How to cite this article: Wójcikowski, M. et al. Performance of machine-learning scoring functions in
structure-based virtual screening. Sci. Rep. 7, 46710; doi: 10.1038/srep46710 (2017).
Publisher's note: Springer Nature remains neutral with regard to jurisdictional claims in published maps and
institutional affiliations.
This work is licensed under a Creative Commons Attribution 4.0 International License. The images or other third party material in this article are included in the article’s Creative Commons license, unless indicated otherwise in the credit line; if the material is not included under the Creative Commons license, users will need to obtain permission from the license holder to reproduce the material. To view a copy of this license, visit http://creativecommons.org/licenses/by/4.0/