Coconut fat and serum lipoproteins:
effects of partial replacement with unsaturated fats
Shanthi Mendis
1,2*, U. Samarajeewa
3and R. O. Thattil
31Room 4034, World Health Organization, 20 Ave Appia, 1211 Geneva 27, Switzerland 2Faculty of Medicine,3Faculty of Agriculture, University of Peradeniya, Sri Lanka
(Received 30 March 1999 ± Revised 3 November 2000 ± Accepted 21 December 2000)
The aim of the present study was to examine the effect of reducing saturated fat in the diet, or partly replacing it with unsaturated fat, on the serum lipoprotein profile of human subjects. The study had two intervention periods, 8 weeks (phase 1) and 52 weeks (phase 2). In phase 1, total fat was reduced from 31 to 25 % energy (polyunsaturated fatty acids (PUFA):saturated fatty acids (SFA) ratio increased from 0´2 to 0´4) by reducing the quantity of coconut fat (CF) in the diet from 17´8 to 9´3 % energy intake. In phase 2, subjects were randomised to groups A and B. In group A total fat was reduced from 25 to 20 % energy (PUFA:SFA ratio increased from 0´4 to 0´7) by reducing the quantity of CF in the diet from 9´3 to 4´7 % total energy intake. In group B, the saturated fat content in the diet was similar to group A. In addition a test fat (a mixture of soyabean oil and sesame oil, PUFA:monosaturated fatty acids ratio 2) contributed 3´3 % total energy intake and total fat contributed 24 % energy intake (PUFA:SFA ratio increased from 0´7 to 1´1). At the end of phase 1, there was a 7´7 % reduction in cholesterol (95 % CI 23´6, 212´2) and 10´8 % reduction in LDL (95 % CI 24´9, 216´5) and no significant change in HDL and triacylglycerol. At the end of phase 2, the reduction in cholesterol in both groups was only about 4 % (95 % CI 212, 3´2) partly due the concomitant rise in HDL. The reduction in LDL at 52 weeks was significantly higher in group B (group A mean reduction 11 %, 95 % CI 220´1, 22´0 and group B mean reduction 16´2 % 95 % CI 223´5, 28´9). In phase 2, triacylglycerol levels showed a mean reduction of 6´5 % in group 2A and a mean increase of 8´2 % in group 2B. The reduction of saturated fat in the diet is associated with a lipoprotein profile that would be expected to reduce cardiovascular risk. The reduction of dietary saturated fat with partial replacement of unsaturated fat brings about changes in total cholesterol, HDL- and LDL-cholesterol that are associated with a lower cardiovascular risk.
Serum lipoproteins: Saturated fat: Polyunsaturated fat: Coconut fat
International comparisons suggest that diets high in saturated fatty acids (SFA) and low in polyunsaturated fatty acids (PUFA) increase the risk of CHD (Scrimshaw & Guzman, 1968; Kato et al. 1973; Robertson et al. 1977). Such diets have been shown to increase total cholesterol (TC) levels (Hegsted et al. 1965; Keys, 1980; Mensink & Katan, 1992; Hegsted et al. 1993) which enhances the risk of CHD (Stamler et al. 1986; Shrapnel et al. 1992). It is generally accepted that a reduction in the intake of SFA will lower TC and LDL-cholesterol (LDL-C) but there is no agreement on the type of nutrient that should replace it. Replacing SFA with n-6 PUFA causes a decline in TC (Hegsted et al. 1965; Keys, 1965; Sanders et al. 1997).
It has been suggested that part of the cholesterol-lowering action of n-6 PUFA consists of cholesterol-lowering the levels of HDL-cholesterol (HDL-C). Indeed, Mattson & Grundy (1985) reported a reduction in HDL-C when linoleic acid in the diet contributes 28 % total energy intake. However, decreasing the intake of SFA by replacing some of it with PUFA has been reported to reduce TC and LDL-C without affecting HDL-C (Sanders et al. 1997).
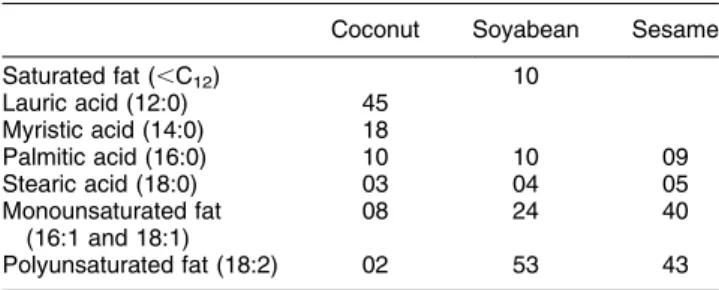
Coconut fat (CF), a highly saturated fat (containing .76 g SFA/100 g fat, Table 1) has been a major source of fat in the habitual Sri Lankan diet for many decades. Dietary fat contributes about 29 % total energy requirement and as much as 80 % fat in the habitual Sri Lankan diet is
Abbreviations: CF, coconut fat; HDL-C, HDL-cholesterol; LDL-C, LDL-cholesterol; MUFA, monounsaturated fatty acids; PUFA, polyunsaturated fatty acids; SFA, saturated fatty acids; TAG, triacylglycerol; TC, total cholesterol.
CF (Cullumbine et al. 1946; Nicholle & Nimalasooriya, 1949; Cullumbine, 1951; Wickramanayake & Panabokke, 1961; Athukorala & Jayawardane, 1991). Among the different hypotheses put forward to explain the relatively high incidence of CHD in Sri Lanka is this high saturated fat content of the habitual Sri Lankan diet (Shaper et al. 1974). The unique dietary composition of the Sri Lankan diet allows investigation of the effect on blood lipids of removal of a highly saturated fat (CF) from the diet.
In the past we have carried out two studies to investigate the effect of totally replacing CF in the diet with soyabean fat and corn fat (Mendis et al. 1989; Mendis & Kumarasunderam, 1990). In one study we investigated the influence on plasma lipids of isoenergetic diets containing 30 % energy as fat, with a PUFA:SFA ratio of 4´00 or 0´25, consumed for 8 weeks by twenty-five young normolipidaemic males. Approximately 70 % energy from fat was provided by the test fats: soyabean fat and CF. During the soyabean-fat-eating period the TC level fell significantly compared with baseline values and during the CF-eating phase TC level increased significantly compared with the soyabean-eating period P , 0´01. Concomitant with the lowering of TC and LDL-C, there was also a reduction in C levels. On the soyabean-fat diet, HDL-C decreased by 15 % (range 6±35 %). Recent meta-analyses on effects of dietary fatty acids on serum lipids have confirmed the findings reported in our studies (Mensink & Katan, 1992; Hegsted et al. 1993).
It is not practical to completely replace CF in the Sri Lankan diet with other fats as was done in our earlier studies (Mendis et al. 1989; Mendis & Kumarasunderam, 1990). Indeed, it may be unnecessary and undesirable to do so in view of the HDL-C-lowering effect. In addition, most dietary studies, including ours, have been short-term studies conducted on normolipidaemic men. The effect of these dietary interventions are more relevant and in fact may differ in hyperlipidaemic subjects particularly in the long term. Furthermore, in the free-living situation man tends to eat mixtures of fats and so it is also important to study the effect of dietary lipids as mixtures.
Therefore, we conducted a long-term study to investigate how the CF content in the diet could be adjusted in relation to PUFA and monounsaturated fat (MUFA) for obtaining a lipoprotein profile associated with low cardiovascular risk in normolipidaemic and hyperlipidaemic subjects. The specific objectives were to examine the short-term and
long-term effects on the serum lipoprotein profile when: (1) CF content in the diet is reduced; (2) CF in the diet is reduced and replaced with a combination of soyabean fat (PUFA) and sesame oil (oil of Sesamun indicum seed, containing 40 g MUFA/100 g fat).
Methods Subjects
All subjects were volunteers who responded to an open invitation distributed to 322 households during a commu-nity-based study of coronary risk factors in the central province of Sri Lanka. Positive replies were received from eighty-four adults from fifty-nine households.
Exclusion criteria
Patients on lipid-lowering therapy, diuretics or b blockers, patients with cardiac failure, obesity, diabetes, or a recent history of myocardial infarction (within the last 6 months) were excluded from the study. Those who were unable to prepare all their meals in their houses and those who have to regularly depend on meals from outside were also not recruited to the study. Ten individuals were excluded due to medical reasons and fourteen were excluded due to practical difficulties of adhering to meal preparations.
Sample
A total of sixty subjects who had no exclusion criteria were enrolled in the study. They were from forty households and belonged to low and middle socio-economic classes. Of the sixty subjects, fourteen had serum cholesterol . 6´2 mmol=l; twenty-one had triacylglycerol TAG . 2´3 mmol=l: Three had both serum cholesterol and TAG elevated above these levels. In the others, the serum cholesterol ranged from 5´4 to 6´2 mmol/l and serum TAG from 1´8 to 2´3 mmol/l. Age range was 20±65 years and there were forty-two males in the total sample. The mean BMI was 22´5 and 22´1 kg/m2 in males and females respectively. Five men gave a history of occasional (less than once per 2 weeks) alcohol intake.
Experimental design
The duration of the study was 62 weeks consisting of a preliminary phase (2 weeks), phase 1 (8 weeks) and phase 2 (52 weeks). During the preliminary phase (period of 2 weeks) trained fieldworkers assessed the saturated fat, CF, PUFA and MUFA consumption in the diet of each subject. For this purpose subjects were interviewed daily (24 h recall method) about all food items consumed during the previous day. The amount of coconut, CF and other vegetable oils consumed by the household were measured daily by the fieldworker who visited each household every other day. The fieldworkers also kept records of the number of persons in the household at main meals in order to determine the amount of food consumed per person. Table 1. Fatty acid composition of main fats used in the study
(g/100 g fat)*
Coconut Soyabean Sesame
Saturated fat (,C12) 10 Lauric acid (12:0) 45 Myristic acid (14:0) 18 Palmitic acid (16:0) 10 10 09 Stearic acid (18:0) 03 04 05 Monounsaturated fat (16:1 and 18:1) 08 24 40 Polyunsaturated fat (18:2) 02 53 43
Using dietary information collected by the fieldworkers from subjects during the 2 weeks, a common and practical menu of main meals was prepared (daily menu for 1 month). This was used as a guide for meal preparation and contained specific instructions regarding food items that should be avoided (butter, margarine, full-cream milk, cheese, bacon, sausages, pork, mutton, sweetmeats made of coconut, avocado, ice cream, chocolates) and the amount and type of fat to be consumed. Subjects were requested to refrain from taking meals from outside the home during the entire duration of the study. Body weight was monitored once per month during the study. All values were within 2 % baseline body weight throughout the study.
Fieldworkers visited the households every other day in phase 1 and two times per week in phase 2 to supervise the measurement of coconut and other fat, to get dietary data by 24 h recall method and to reinforce dietary instructions. Dietary diaries also helped to monitor the compliance. Total fat and types of fat consumed during different phases of the study was calculated by using food composition tables (Perera et al. 1979).
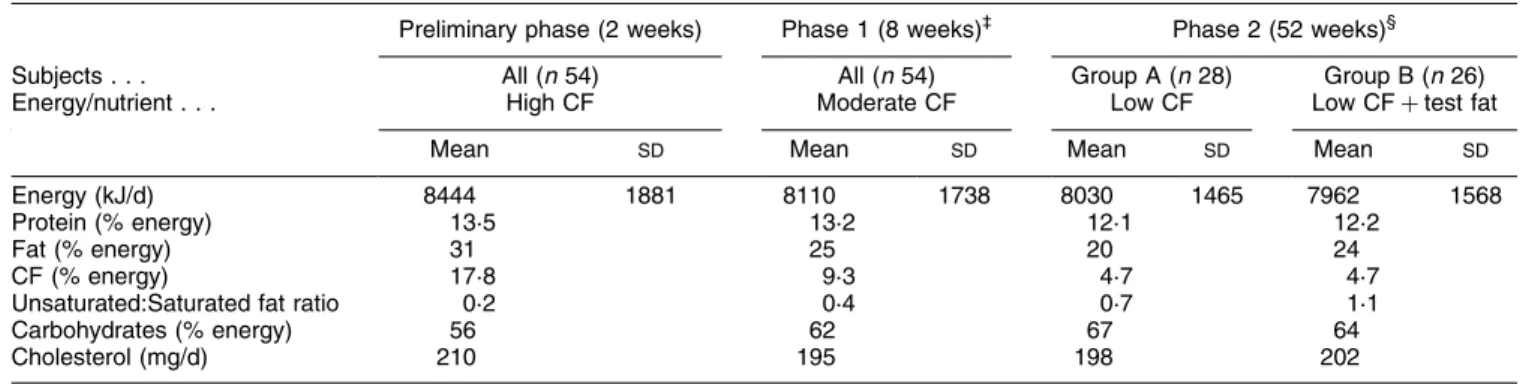
The mean daily intake of energy and nutrients in different phases of the study is shown in Table 2. At the time of recruitment the % daily energy intake from fat was 31. CF provided 17´8 % total energy intake. In phase 1 (8 weeks), total fat intake was reduced to 25 % energy intake by reducing the amount of CF in the diet. During this phase CF contributed 9´3 % total daily energy intake.
In phase 2 (52 weeks), subjects were randomised to two groups (groups A and B). This was done in such a way that the thirty-eight hyperlipidaemic subjects were equally divided between the two groups. Group A received a diet containing 20 % energy intake as fat. This was done by reducing the CF to 4´7 % energy intake. Subjects in group B received the same amount of coconut in the diet as those in group A. In addition they were given 7´5 g test fat containing soyabean fat±sesame fat (3:1, v/v containing PUFA:MUFA ratio 2). Fat intake in group B was, therefore, 24 % energy intake. Differences in dietary composition of protein and carbohydrates between phases 1 and groups A
and B in phase 2 were negligible. Two subjects in group A and four subjects in group B defaulted at 6 months. Table 1 shows the fatty acid composition of main fats used in the study.
Lipid analysis
Fasting (14 h) venous blood samples for analysis of cholesterol, TAG and lipoproteins were taken at the beginning and end of phase 1 and at 3, 6 and 12 months in phase 2 of the study. Serum TC and TAG were analysed by enzymatic colorimetric methods (Boehringer Mannheim GmbH. Mannheim, Germany). The inter- and intra-assay CV of the TC assay were both ,2´5 %. The inter- and intra-assay CV of the TAG assay were 3´5 and ,2´5 respectively. HDL-C was measured by selective precipita-tion with dextran sulfate and MgCl2(Warnick et al. 1982). LDL-C assay was done directly using a direct LDL-C assay (Boehringer Mannheim GmbH). The inter- and intra-assay CV for HDL-C and LDL-C assays were both less than ,2´5 %.
Ethical clearance
Informed consent was obtained from participants. Ethical approval was obtained from the Ethical Clearance Com-mittee of the Faculty of Medicine, Peradeniya.
Statistical methods
ANOVA was performed to compare the mean values obtained during different dietary periods. When the ANOVA found the results of the diets to be different, paired t tests with Bonferroni correction for multiple comparisons were performed (Glanz, 1992).
Results
Concentrations of plasma lipids and lipoproteins during daily consumption of 31 % total energy as fat (17´8 % energy as CF) and at the end of 8 weeks after taking a diet Table 2. Mean daily intake of energy and nutrients of subjects*
(Mean values and standard deviations)²
Preliminary phase (2 weeks) Phase 1 (8 weeks)³ Phase 2 (52 weeks)§
Subjects . . . All (n 54) All (n 54) Group A (n 28) Group B (n 26)
Energy/nutrient . . . High CF Moderate CF Low CF Low CF test fat
Mean SD Mean SD Mean SD Mean SD
Energy (kJ/d) 8444 1881 8110 1738 8030 1465 7962 1568
Protein (% energy) 13´5 13´2 12´1 12´2
Fat (% energy) 31 25 20 24
CF (% energy) 17´8 9´3 4´7 4´7
Unsaturated:Saturated fat ratio 0´2 0´4 0´7 1´1
Carbohydrates (% energy) 56 62 67 64
Cholesterol (mg/d) 210 195 198 202
CF, coconut fat.
* For details of diets and procedures, see Table 1 and p. 584.
² Differences in dietary composition of protein and carbohydrates between phases 1 and 2 were negligible and standard deviations therefore are not given. ³ Values are the means of eight 1-week periods during which diet was consumed.
containing 25 % total energy as fat (9´3 % as CF) are shown in Table 3. In phase 1 there was a 7´7 % (95 % CI 23´6, 212´2) reduction of cholesterol and 10´8 % (95 % CI 24´9 %, 216´5 %) reduction in LDL-C and no significant change in HDL-C and TAG and TC:HDL-C ratio.
Table 3 also compares the effects of the experimental diets on groups A and B in phase 2 by showing the changes in mean serum concentrations of plasma lipids and lipoproteins at 3, 6, 12 months. Both groups showed a significant P , 0´01 reduction in TC at 3 months (group A mean 8´2 %, 95 % CI 212´7, 23´7, and group B mean 7´0 %, 95 % CI 211´2, 22´9). However, by 52 weeks the reduction in TC in both groups was only about 4 % (95 % CI 212, 3´2), partly due the concomitant rise in HDL-C. The reduction in LDL-C at 52 weeks was significantly higher P , 0´05 in group B (group A mean reduction 11 %, 95 % CI 220´1, 22´0 and group B mean reduction 16´2 %, 95 % CI 223´5, 28´9).
In phase 2A, the TAG levels showed a mean reduction of 6´5 %. However, in phase 2B an increase in the mean TAG level of 8´2 % was seen at the end of the 12-month period. There was a correlation between the magnitude of the change in TAG level induced by the diets and the TC level at the beginning of the long-term study (correlation coefficients for group A and B, 0´55 and 20´35 respectively).
HDL-C levels showed a 10 % increase in group A (95 % CI 2´1, 18´3) and an 18´4 % increase in group B (95 % CI 7, 29´7) at 3 months. By 6 months both groups showed an increase of about 34 % which was maintained at 52 weeks (mean increase group A 33´6 % (95 % CI 22´8, 44´4) and mean increase in group B 32´8 % (95 % CI 22´1, 43´5). The mean reduction in TC:HDL-C ratio was about 13 % at 3 months in both groups. At 6 months the favourable effect on TC:HDL ratio was even more marked (mean reduction group A 24´6 % 95 % CI 232, 217 and mean reduction group B 26´7 % 95 % CI 234´2, 219´4). Table 4 shows the Table 3. Concentration of plasma lipids and lipoproteins during daily consumption of a diet providing 31 % total energy as fat (energy from coconut fat 17´8 %) and at the end of 8 weeks taking a diet containing 25 % total energy as fat (energy from coconut fat 9´3 %) and the changes
in lipids at 3-, 6- and 12-month intervals compared with blood level at end of phase 1² (Mean values with their standard errors)
Baseline End of phase 1 Change from phase 1 (%)
Mean SE Mean SE Group 3 months 6 months 12 months
Cholesterol (mmol/l) 7´1 0´15 6´5** 0´15 A 28´2 25´7 24´2 B 27´0 25´0 24´0 LDL-C (mmol/l) 5´3 0´15 4´8** 0´18 A 29´3 211´6 211´0 B 214´6 216´0 216´2 HDL-C (mmol/l) 0´87 0´05 0´87 0´04 A 10´0 34´3 33´6 B 18´4 34´1 32´8 TAG (mmol/l) 2´4 0´2 2´2 0´15 A 26´2 27´2 26´5 B 11´5 12´0 8´2 Cholesterol:HDL ratio 11´9 0´84 11´6 1´43 A 213´4 224´6 223´8 B 213´0 226´7 227´1
LDL-C, LDL-cholesterol; HDL-C, HDL-cholesterol; TAG, triacylglycerol. Mean values were significantly different from those at baseline: **P 0´01: ² For details of diets and procedures, see Table 1 and p. 584.
Table 4. Comparison of the effects of the two diets on plasma lipids and lipoproteins at 12 months (Mean difference values and 95 % confidence intervals)²
Mean difference 95 % CI Statistical significanceof difference (P) Cholesterol Group A diet 20´58 20´86, 20´3 0´000 Group B diet 20´42 20´68, 20´2 0´005 LDL-C Group A diet 20´58 20´94, 20´22 0´005 Group B diet 20´65 20´94, 20´36 0´000 HDL-C Group A diet 0´27 0´19, 0´35 0´000 Group B diet 0´26 0´18, 0´34 0´000 TAG Group A diet* 20´23 20´61, 0´15 NS Group B diet* 0´35 0´14, 0´56 0´012 Cholesterol:HDL ratio Group A diet 21´38 22´18, 20´58 0´002 Group B diet 21´98 22´6, 21´35 0´000
LDL-C, LDL-cholesterol, HDL-C, HDL-cholesterol; TAG, triacylglycerol. Group A V. Group B: *P , 0´05
² For details of diets and procedures, see Table 1 and p. 584. Differences shown are from the measurement at baseline level at the beginning of the study.
mean differences and the CI for each lipid variable at the beginning of the study and end of phase 2. Sub-group analysis did not show any significant difference in the response of serum lipids and lipoproteins to the dietary modifications described earlier between males, females, normolipidaemic or hyperlipidaemic subjects.
Discussion
The findings of the present study are in agreement with several short-term metabolic studies that have presented evidence that saturated fats per se increase the concentra-tions of TC and PUFA lower TC in human subjects (Hegsted et al. 1965; Keys et al. 1965; Schafer et al. 1981; Sanders et al. 1997; Schafer, 1997).
The achieved reduction in cholesterol concentration in phase 1 was consistent with that predicted by the regression equation: cholesterol 1´35 (2 S 2 P (Keys et al. 1965), where S and P are the changes in the % dietary energy derived from saturated and polyunsaturated fat respec-tively. During phase 2A and 2B the estimated changes in cholesterol were significantly less P , 0´05 than those predicted by published regression equations. (Keys et al. 1965, 1974; Hegsted et al. 1965).
It has been argued that CF, which is rich in medium-chain fatty acids, has no significant effect on blood cholesterol because medium-chain fatty acids are meta-bolised rapidly (Reiser, 1973). However, in a recent metabolic ward study, medium-chain TAG was shown to have one-half the potency of palmitic acid at raising TC and LDL-cholesterol concentrations (Cater et al. 1997).
The increase in HDL-C levels seen in the present study supports the contention of Schwandt et al. (1982) that the response of HDL-C appears to be related to the PUFA:SFA ratio of the diet. In studies that have demonstrated a decline in the HDL-C level, the intake of PUFA was very high and the PUFA:SFA ratio ranged from 2´0 to 6´5 (Shepherd et al. 1980; Schafer et al. 1981; Vega et al. 1982; Mattson & Grundy, 1985; Mendis et al. 1989; Mendis & Kumar-asunderam, 1990). We therefore conclude that increasing the unsaturated fat in the diet while keeping the PUFA:SFA ratio close to 1 does not have an unfavourable effect on HDL-C levels.
In the present study, partial replacement of SFA with unsaturated fatty acids brought about an increase in TAG levels. These findings are in agreement with Chait et al. (1974), who reported a correlation between the magnitude of the change in TAG level induced by the diets and the cholesterol level
The reason for the increase in TAG levels in subjects in group B is not clear. In group B there were twelve subjects with hypertriacylglycerolaemia. Carbohydrates have been reported to have a hypertriacylglycolaemic effect that is more pronounced in individuals with pre-existing hyper-triacylglycolaemia (Riccardi et al. 1987; Katan et al. 1995). Although the mean carbohydrate content in the diet was higher in phase 2 than the preliminary phase we feel that this degree of difference in carbohydrates alone is unlikely to have been the major reason for the increase in TAG levels which was only seen in group 2B subjects. Increases in TAG levels are also commonly observed during the
consumption of low-fat, high-carbohydrate diets (Connor & Connor, 1997; Katan et al. 1997). In Phase 2B of the present study a diet containing 64 % energy as carbohy-drates and 24 % energy as fat resulted in an increase in the mean TAG level. When the composition of diet is changed from 50 % and 35 % energy from carbohydrates and fats to 68 % and 15 % energy from carbohydrates and fats respectively, plasma TAG has been reported to increase by 60 % and a reduction in VLDL-TAG clearance rate has been shown to be the mechanism responsible for this rise in TAG (Parks et al. 1999). The low-fat, high-carbohydrate diet may have been partly responsible for the increase in TAG. However, why such an increase was not seen in subjects in group 2A, who also received a diet low in fat and relatively high in carbohydrates, cannot be explained.
In the present intervention study, we have studied a heterogenous group of hyperlipidaemic subjects and within groups a large variability in dietary responses was seen. Some of the variability may be attributed to differences in genetic heterogeneity and compliance.
The energy intake from total fat in the Sri Lankan diet (15±30 %) is within recommended limits (Food and Agriculture Organization/World Health Organization, 1998). However, the diet has 16±18 % saturated fat (recommended level ,10 %), but only 1±2 % PUFA (recommended level 3±8 %) and 2±5 % MUFA (recom-mended level 10±12 %). The relative deficiency of unsaturated fat and excess of saturated fat are two aspects of fat consumption of Sri Lankans that need attention. Not only do PUFA alter lipoprotein metabolism, but they also have an important additional role due to their essential fatty acid content. A deficiency of essential fatty acids (linoleic and arachidonic acids) relative to SFA intake can be correlated with CHD mortality (Kinsella et al. 1990). The pathways of a relative essential fatty acid deficiency leading to CHD are related to intravascular coagulation, myocardial metabolism and lipoprotein metabolism. Results of the present study show that reducing the SFA content in the diet results in a lipid profile that is associated with a low cardiovascular risk. This study also shows that by replacing part of the CF with a mixture of soyabean oil (PUFA) and sesame oil (MUFA) improves the lipid profile with regard to TC, LDL-C and HDL-C levels. These findings are of special relevance to Sri Lanka and to other populations in which CF is an important constituent of the diet. Vascular disease has been reported to be uncommon in Polynesian islanders who obtain 34±63 % food energy from CF. However, fish is the chief source of protein in the Polynesian diet and it is likely to have a favourable influence on the lipid metabolism and atherosclerosis (Prior et al. 1981). The results of this long-term study also show that the favourable effects of dietary modification on blood lipids take about 6 months to reach a maximum and to become stable. Although not investigated in this present study, such a dietary modification that increases the PUFA and MUFA may also have favourable effects on coagula-tion factors and platelet activity (Miller, 1998).
Reducing the total fat consumption by reducing daily CF intake or replacing part of the CF in the diet with PUFA (soyabean fat) and MUFA (sesame oil) while maintaining the PUFA:SFA ratio close to 1 is associated with about 4 %
reduction in mean cholesterol level at the end of 1 year. The more pronounced reduction of blood cholesterol seen at the beginning of the study was not sustained. Failure to comply fully with the test diet in the long term is one explanation for this. This also points to the importance of being realistic about the reduction in cardiovascular risk that can be achieved by individual dietary counselling of free-living individuals.
A sustained reduction in blood cholesterol concentration of 1 % is associated with a 2±3 % reduction of the incidence of CHD (Law et al. 1994). In primary prevention, a reduction of cholesterol by 20 % has produced a 31 % reduction in recurrent coronary morbidity, a 33 % reduc-tion in coronary mortality, and 22 % less total mortality (Grundy, 1997). Accordingly, a crude estimate of the reduction in coronary morbidity and mortality brought about by the current dietary intervention would be of the order of about 6±8 %. However, the present study was done in a highly selected group of subjects who were well motivated. The effect of similar interventions in wider population groups are likely to be less marked.
Acknowledgement
This study was funded by the National Science Foundation of Sri Lanka (grant no. 96/M/14).
References
Athukorala TMS & Jayawardane MIFP (1991) Lipid patterns and dietary habits of healthy subjects living in urban, suburban and rural areas. Ceylon Medical Journal 36, 9±16.
Cater NB, Heller HJ & Denke MA (1997) Comparison of the effects of medium-chain triacylglycerols, palm oil and high oleic acid sunflower oil on plasma triacylglycerol fatty acids and lipid and lipoprotein concentration in humans. American Journal of Clinical Nutrition 65, 41±45.
Chait AO, Akintunde Nicholl A, Rabaya E, Jeffrey D & Lewis B (1974) Reduction of serum triglyceride level by polyunsaturated fat. Atherosclerosis 20, 347±364.
Connor WE & Connor SL (1997) Should low fat high carbohydrate diets be recommended for everyone? New England Journal of Medicine 337, 562±563.
Cullumbine H (1951) A nutritional survey in Ceylon. Ceylon Journal of Medical Science 8, 17.
Cullumbine H, Bibile SW & Wickramanayake TW (1946) A study of the diets of various communities in Ceylon. Ceylon Journal of Medical Science 6, 254.
Food and Agriculture Organization/World Health Organization (1998) Preparation and Use of Food-based Dietary Guidelines. Report of a Joint FAO/WHO Consultation. World Health Organization Technical Report Series no. 880. Geneva: WHO. Glanz SA (1992) Primer of Biostatistics. New York, NY:
McGraw-Hill.
Grundy SM (1997) Management of high serum cholesterol and related disorders in patients at risk for coronary heart disease. American Journal of Medicine 102, 15±22.
Hegsted DM, Ausman LM, Johnson JA & Dallal GE (1993) Dietary fat and serum lipids; and evaluation of the experimental data. American Journal of Nutrition 57, 875±883.
Hegsted DM, McGrandy RB & Myers ML (1965) Quantitative effects of dietary fat on serum cholesterol in man. American Journal of Clinical Nutrition 27, 281±295.
Katan MB, Grundy SM & Willett WC (1997) Beyond low fat diets. New England Journal of Medicine 337, 563±566. Katan MB, Zock PL & Mensink RP (1995) Dietary oils, serum
lipoproteins and coronary heart disease. American Journal of Clinical Nutrition 61, Suppl. 6, 1368S±1373S.
Kato H, Tillotson J, Nichamen MZ, Rhoads GG & Hamilton HB (1973) Epidemiological studies of coronary heart disease and stroke in Japanese men living in Japan, Hawaii and California: serum lipids and diet. American Journal of Epidemiology 97, 372±385.
Keys A (1980) Seven countries: a multivariate analysis of death and coronary heart disease. Cambridge, MA: Harvard Uni-versity Press.
Keys A, Anderson JT & Grande F (1965) Serum cholesterol response to changes in the diet. IV. Particular saturated fatty acids in the diet. Metabolism 14, 776±787.
Keys A, Grande F & Anderson JT (1974) Bias and misrepresenta-tion revisited: perspective on saturated fat. American Journal of Clinical Nutrition 27, 188±212.
Kinsella JE, Lokesh B & Stone RA (1990) Dietary n-3 polyunsaturated fatty acids and amelioration of cardiovascular disease: possible mechanisms. Review. American Journal of Clinical Nutrition 52, 1±28.
Law MR, Wald NJ & Thompson SG (1994) By how much and how quickly does reduction in serum cholesterol concentration lower risk of ischaemic heart disease? British Medical Journal 308, 367±372.
Mattson FH & Grundy SM (1985) Comparison of effects of dietary saturated, monounsaturated, and polyunsaturated fatty acids on plasma lipids and lipoproteins in man. Journal of Lipid Research 26, 194±202.
Mendis S & Kumarasunderam R (1990) The effect of daily consumption of coconut fat and soyabean fat on plasma lipids and lipoproteins of young normolipidaemic men. British Journal of Nutrition 63, 547±552.
Mendis S, Weissler RW & Bridenstein RT (1989) The effects of replacing coconut oil with corn oil on human serum lipid profiles and platelet derived factors active in atherogenesis. Nutrition Reports International 40, 773±782.
Mensink RP & Katan MB (1992) Effect of dietary fatty acids on serum lipids and lipoproteins: a meta-analysis of 27 trials. Arteriosclerosis and Thrombosis 12, 911±919.
Miller GJ (1998) Effects of diet composition on coagulation pathways. American Journal of Nutrition 67, Suppl. 3, 542S± 545S.
Nicholle L & Nimalasoouriya A (1949) Rural dietary surveys in Ceylon. Ceylon Journal of Medical Science 5, 59.
Parks EJ, Krauss RM, Christiansen MP, Neese RA & Hellerstein MK (1999) Effect of a low fat high carbohydrate diet on VLDL triglyceride assembly, production and clearance. Journal of Clinical Investigation 104, 1087±1205.
Perera WDA, Jayasekera PM & Thaha SZ (1979) Tables of Food Composition for use in Sri Lanka. Colombo, Sri Lanka: World Health Foundation of Sri Lanka.
Prior IA, Davidson F, Salmond CE & Czochanska Z (1981) Cholesterol coconut and diet in Polynesian atolls, a natural experiment: the Pukapuka and Toklau island studies. American Journal of Clinical Nutrition 32, 1552±1561.
Reiser R (1973) Saturated fat in the diet and serum cholesterol concentration: a critical examination of the literature. American Journal of Clinical Nutrition 26, 524±555.
Riccardi G, Rivellese AA & Mancini M (1987) The use of diet to lower plasma cholesterol levels. European Heart Journal 8, Suppl. E, 79±85.
Robertson TL, Kato H, Rhoads GG, Kagan A, Marmot M, Syme SL, Gordon T, Worth RM, Belsky JL, Dock DS, Miyanishi M & Kawamoto S (1977) Epidemiological studies of
coronary heart disease and stroke in Japanese men living in Japan, Hawaii and California: Incidence of myocardial infarc-tion and death from coronary heart disease. American Journal of Cardiology 39, 239±243.
Sanders TA, Oakley FR, Miller GJ, Mitropoulos KA, Crook D & Oliver MF (1997) Influence of n-6 versus n-3 polyunsaturated fatty acids in diets low in saturated fatty acids on plasma lipoproteins and hemostatic factors. Arteriosclerosis Thrombo-sis and Vascular Biology 17, 3449±3460.
Schafer EJ (1997) Effects of dietary fatty acids on lipoproteins and cardiovascular disease risk: summary. American Journal of Nutrition 65, Suppl. 5, 1655S±1656S.
Schafer EJ, Levy RI, Ernst ND, Van Sant FD & Brewer HB Jr (1981) The effects of low cholesterol, high polyunsaturated fat diets on plasma lipid and lipoprotein cholesterol levels in normal and hypercholesterolemic subjects. American Journal of Clinical Nutrition 34, 1758±1763.
Schwandt P, Janetschek P & Wersweiler P (1982) High density lipoproteins unaffected by dietary fat modification. Athero-sclerosis 44, 9±17.
Scrimshaw NS & Guzman MA (1968) Diet and atherosclerosis. Laboratory Investigations 18, 623±628.
Shaper AG (1974) Coronary heart disease. In Cardiovascular Disease in the Tropics [AG Shaper, MSR Hutt and Z Fejfar, editors]. London: BMA.
Shepherd J, Packard CJ, Grundy SM, Yeshurun D, Gotto AM Jr & Taunton OD (1980) Effects of saturated and polyunsaturated fat
diets on the chemical composition and metabolism of low density lipoproteins in man. Journal of Lipid Research 21, 91±99.
Shrapnel WS, Calvert GD, Nestel PJ & Trustwell AS (1992) Diet and coronary heart disease. The National Heart Foundation of Australia. Medical Journal of Australia 156, Suppl., S9±S16. Stamler J, Wentworth D & Neaton JD (1986) Is the relationship
between serum cholesterol and risk of premature death from coronary heart disease continuous and graded? Findings in 356,222 primary screeners of the multiple risk factor interven-tion trial (MRFIT). Journal of the American Medical Associa-tion 256, 2823±2828.
Vega GL, Groszek E, Wolf R & Grundy SM (1982) Influence of polyunsaturated fats on composition of plasma lipoproteins and apolipoproteins. Journal of Lipid Research 23, 811±822. Wahlefeld AW (1974) Triglyceride determination after
enzy-matic hydrolysis. In Methods of Enzyenzy-matic Analysis, 2nd English ed., pp. 1831±1833 [HU Berghmeyer, editor]. New York, NY and London: Verlag Chemie Weinheim and Academic Press Inc.
Warnick GR, Benderson J & Albers JJ (1982) Dextran-sulfate-Mg precipitation procedure for quantitation of high density lipoprotein cholesterol. Clinical Chemistry 28, 1379±1388. Wickramanayake TW, Panabokke R, (1961) The relation between
diet and atherosclerosis in Ceylon. American Journal of Clinical Nutrition 9, 752.