Snack frequency: associations with healthy and unhealthy
food choices
Christina Hartmann*, Michael Siegrist and Klazine van der
Horst-ETH Zurich, Institute for Environmental Decisions (IED), Consumer Behaviour, Universita¨tstrasse 22, CH-8092 Zurich, Switzerland
Submitted 23 September 2011: Final revision received 28 June 2012: Accepted 3 July 2012: First published online 16 August 2012 Abstract
Objective: We examined associations between snack frequency, sociodemographic characteristics, BMI, dietary and eating behaviour. In order to identify whether various subgroups of high-frequency snack consumers exist, we investigated underlying food patterns and lifestyle factors.
Design: The data were based on the Swiss Food Panel Questionnaire of 2010, which included an FFQ, questions relating to sociodemographics and lifestyle factors. Data were examined using ANOVA, regression analysis and hierarchical cluster analysis. Gender differences were also investigated in the analysis of the data.
Setting: A sample of 6189 adults participating in the Swiss Food Panel filled in a questionnaire (response rate 30 %).
Subjects: The sample consisted of both men and women, with a mean age of 54?4 (SD13?5) years.
Results: There was no association between snack frequency and BMI. Consumption frequency of sweets and savouries as well as fruit intake increased with increasing snack frequency. Additionally, three different subgroups of high-frequency snack consumers could be revealed: healthy, moderate and unhealthy dietary-pattern groups. The latter included respondents who were less health-conscious and was characterized by high alcohol consumption frequency, daily breakfast skipping and watching television during the main meal.
Conclusions: High snack frequency occurred in the context of healthy as well as unhealthy dietary behaviour and lifestyle patterns. Women made healthier dietary food choices and were more likely to consume fruits as snacks, while men chose unhealthy foods, such as sweets and savouries, more often.
Keywords Snack frequency Food choices Lifestyle factors BMI Health consciousness
Eating frequency is affected by cultural/social norms, lifestyle factors, the environment and an individual’s personal attitudes towards his/her health(1,2). Changes in lifestyle and the environment over the last few decades have probably been the most important causes of the overweight epidemic in Western society(3). The increasing proportion of snacking in the Western diet has been a particular cause for concern, since the foods and drinks typically consumed as snacks tend to be energy-dense(4). In the scientific literature, no consensus exists about whether a higher frequency of eating, and particularly snacking, promotes or prevents weight gain(5,6).
In spite of an unclear association with body weight, snacking per se does not have a negative effect on diet quality. Snacking can increase the opportunity for healthy, low-energy food choices, resulting in a wider variety of foods in the diet and a balanced intake of
nutrients contributing significantly to daily micro- and macronutrient intakes(7–9).
An important issue related to snack frequency is whether energy intake from snacks between meals will be compensated for by a lower energy intake from the main meals, because a higher number of eating occasions seems not to be associated with an improvement in appetite control and provides more opportunities to consume excess energy(10). Nevertheless, meal skipping, especially breakfast skipping, is associated with over-eating later in the day, due to intense hunger followed by ingestion of high-fat, sugar-dense snacks(11).
Overweight and obesity status was found to be associated with higher intakes of fat, refined grains, red meat, added sugars and sugar-sweetened beverages(9). These foods are common in an obesogenic environ-ment(12), which may increase the likelihood for choosing unhealthy snacks, make restrained eating more difficult and result in an increased energy intake over the course of the day. A comparison between snacking patterns in
yPresent address: Food Consumer Interaction, Nestle´ Research Center, PO Box 44, 100 Lausanne 26, Switzerland.
obese adults and a reference population showed that with increasing snack occasions, energy intake from candies, chocolate, cakes, cookies and desserts increased more steeply in the obese population compared with the control population(13).
However, high snack frequency is not in itself a reason for energy increase and weight gain. The inconsistent associations between snack frequency and body weight reported in the literature could indicate that an indi-vidual’s overall nutrition pattern plays a more important role than snack frequency itself. Certain energy-dense foods with trends for increased consumption (e.g. beef, pork and pizza) were shown to be important components of meals, rather than snacks(14). Dietary behaviour should also be considered when assessing snacking(6), because a food that is consumed as a snack and a food that is consumed as a meal could both have a considerable influence on the quality of the diet, energy intake and weight gain.
The meal environment may be another influencing factor on dietary and eating behaviour. For example, family meals were associated with higher fruit and vege-table consumption(15), whereas families with a higher frequency of television (TV) watching during meals reported higher proportions of energy intake from snack foods, sodas and meat(16). In general, watching TV during dinner is considered to be a less healthy eating behaviour, and it is likely to correspond with diets high in fat and low in fruit and vegetables(15,16). Lifestyle and socio-economic factors are likely related to different food choices as well. In the study by Holmback et al., a low daily eating frequency (referring to all eating occasions, including snacks) occurred in the context of an unhealthy lifestyle, which was defined by higher intakes of alcohol and high-fat foods and low levels of leisure-time physical activity(7). Gender differences in behaviours relating to food choices have also been observed. For example, on the whole men eat less fresh fruit and vegetables and consume more meat than do women(17,18).
The current literature does not contain any universally accepted definition of snacking, but two main approa-ches have been used to define the term ‘snack’(6). The first approach focuses on the food consumed; foods are identified as snacks by their nutrient content or because they are commonly associated with snacking(6,19). The second approach focuses on the time of food consump-tion(6). Everything consumed between the main meals is defined as a snack. In our study, we asked for the usual frequency of food consumption between the three main meals (breakfast, lunch, dinner) and calculated ‘snack frequency’ per week.
The aim of the present study was to examine the asso-ciations between snack frequency, sociodemographic characteristics, BMI, dietary and eating behaviours. In order to identify whether different subgroups of high-frequency snack consumers exist, we investigated underlying food
patterns and lifestyle factors. It was hypothesised that ‘high snack consumers’ could be separated into two groups: a group with mainly unhealthy food choices and snack consumption preferences for sweets and savouries, and a group with more healthy food choices and snack con-sumption preferences for items such as fruits.
Methods
Procedure and sample
The present study examined data from the Swiss Food Panel, a study into the eating behaviour of the Swiss population. In 2010, a mail survey was sent out to 20 912 randomly selected household addresses from the telephone book in the German-speaking and French-speaking part of Switzerland. After 5 weeks, we sent one reminder, with another copy of the questionnaire, to persons who had not yet responded. We received 6290 filled-in questionnaires (a response rate of 30?1 %). Respondents missing either values on the Identification Code or both key variables of age and gender (n 101) were deleted from the sample. Data from 6189 (29?6 %) respondents consisting of 47?6 % males remained avail-able for the analysis. The respondents’ mean age was 54?4 years (SD15?3; range 20–99 years). Compared with the general Swiss population(20), fewer males participated in the study (census 5 49?2 %), more respondents had a higher secondary or college/university degree and the percentage of young adults (20–39 years old) was lower (18?1 % v. 26?7 %).
Swiss Food Panel Questionnaire
One part of the Swiss Food Panel Questionnaire was an FFQ, which was specially designed for the Swiss Food Panel. The FFQ was used to estimate habitual consumption frequency of various food products and snack frequency per week.
In a separate study, FFQ scales were examined on 2-week test–retest reliability. Data were analysed for 247 people who had responded to both questionnaires; the test–retest correlation between snack frequency scales was r 5 0?8, while the scales varied between r 5 0?7 and r 5 0?9 for food groups.
For investigating ‘snack frequency per week’, respon-dents were asked how often they usually eat a snack in the morning, an afternoon snack, an evening snack and additional snacks (e.g. a nibbling pattern, eating smaller sweets and savoury snack foods). Respondents answered on a five-point answering scale. For calculating the average weekly snack frequency during the previous year, the answering scale was recoded (daily 5 360 d/year, 4–6 times/week 5 260, 1–3 times/week 5 104, 1–3 times/month 5 26, less or never 5 0). The items were summed and divided by 52. The calculated scores ranged from 0 to a maximum of 28?1.
Dietary behaviour assessment
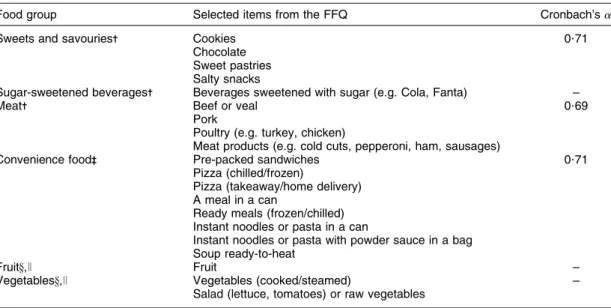
Table 1 shows food items used in the FFQ, which were grouped into the categories ‘convenience food’, ‘sweets and savouries’, ‘sugar-sweetened beverages’ and ‘meat’. These food groups were chosen to represent food choices, either because they had been established by dietary guidelines or because their high frequency of consumption had been shown to have unfavourable health effects(21–23). The questionnaire did not collect information on por-tion size or number of porpor-tions, except for fruit and vegetable consumption.
Items relating to sweets and savouries, sugar-sweetened beverages and meat consumption frequency were assessed on a six-point answering scale. For statistical calculation, ‘several times per day’ was assumed to be 2 times/d (coded as 14 times/week), ‘daily’ was assumed to be 1 time/d (coded as 7 times/week), ‘several times per week’ was assumed to be 3 times/week (coded as 3 times/week), ‘several times per month’ was assumed to be 3 times/month (coded as 0?75 times/week), ‘several times per year’ and ‘less or never’ were considered as negligible (coded as 0). Items falling into each food group were summed to reflect consumption frequency of these foods per week.
Convenience food consumption was assessed on a five-point answering scale: ‘daily’ (coded as 7 times/week), ‘several times per week’ (coded as 3 times/week), ‘several times per month’ (coded as 0?75 times/week), ‘several times per year’ (coded as 0) and ‘less or never’ (coded as 0). To reflect weekly consumption frequency the items were summed.
Fruit and vegetable consumption was assessed on a five-point answering scale: ‘daily’ (coded as 7 times/week), ‘4–6 times/week’ (coded as 5 times/week), ‘1–3 times/week’
(coded as 2 times/week), ‘1–3 times/month’ (coded as 0?5 times/week) and ‘less or never’ (coded as 0). Addi-tionally respondents were asked how many portions of vegetables (one portion 5 a handful, or 50 g) and fruit (one piece or one handful) they usually eat. The items relating to portion number and consumption frequency were combined to reflect ‘servings’ of vegetables and ‘pieces’ of fruit consumed per week.
Additionally, the internal reliability of items from the convenience foods scale, meat scale and the sweets and savouries scale were explored using Cronbach’s a (Table 1).
Eating behaviour assessment
‘Meal frequency’ was assessed by asking respondents how often they usually eat breakfast, lunch and dinner. The answering scale was as follows: ‘daily’, ‘4–6 times/ week’, ‘1–3 times/week’, ‘1–3 times/month’ and ‘less or never’. Two-week test–retest reliability was r 5 0?88 for breakfast, r 5 0?73 for lunch and r 5 0?68 for dinner. Two additional items assessed the frequency of ‘family meals’ and ‘watching television during the main meal’ on a five-point answering scale (‘daily’, ‘4–6 times/week’, ‘1–3 times/week’, ‘1–3 times/month’, ‘less or never’).
Because the items meal frequency, family meals and watching TV during the main meal were highly skewed, they were categorised into binary variables indicating daily breakfast (yes/no), daily lunch (yes/no), daily dinner (yes/no), having family meals 4–7 times/week (yes/no) and watching TV during the main meal 4–7 times/week (yes/no).
Sociodemographic and lifestyle variables
Age, gender, having children (#16 years old), weight and height were all assessed in the Swiss Food Panel
Table 1 Food groups and their underlying items from the FFQ, used to characterize dietary behaviour of respondents
Food group Selected items from the FFQ Cronbach’s a
Sweets and savouries- Cookies 0?71
Chocolate Sweet pastries Salty snacks
Sugar-sweetened beverages- Beverages sweetened with sugar (e.g. Cola, Fanta) –
Meat- Beef or veal 0?69
Pork
Poultry (e.g. turkey, chicken)
Meat products (e.g. cold cuts, pepperoni, ham, sausages)
Convenience food-- Pre-packed sandwiches 0?71
Pizza (chilled/frozen)
Pizza (takeaway/home delivery) A meal in a can
Ready meals (frozen/chilled) Instant noodles or pasta in a can
Instant noodles or pasta with powder sauce in a bag Soup ready-to-heat
Fruity,J Fruit –
Vegetablesy,J Vegetables (cooked/steamed) –
Salad (lettuce, tomatoes) or raw vegetables
Variables were measured using the following response categories in the FFQ: -six response category (‘several times per day’, ‘once a day’, ‘several times per week’, ‘several times per month’, ‘several times per year’, ‘less or never’); --five response category (‘daily’, ‘several times per week’, ‘several times per month’, ‘several times per year’, ‘less or never’); yfive response category (‘daily’, ‘4–6 times/week’, ‘1–3 times/week’, ‘1–3 times/month’, ‘less or never’).
Questionnaire. Educational level was categorised in three groups: (i) low (primary and secondary school), (ii) medium (vocational school) and (iii) high (college and university). BMI (kg/m2) was calculated from the self-reported body weight (kg) divided by square of the self-reported height (m2) of respondents (range 15?3–62?1 kg/m2). Respondents with a BMI $ 25 kg/m2 were classified as being overweight.
‘Wine and beer consumption frequency per week’ was also assessed. Respondents stated on a six-point answering scale how often they usually drink wine and beer: ‘several times per day’, ‘once a day’, ‘several times per week’, ‘several times per month’, ‘several times per year’ or ‘less or never’.
‘Average daily physical activity’ was calculated from two items in the questionnaire. A short introduction encouraged the respondents to take into account only physical activity above a minimum of 10 min. The ques-tions then asked were: ‘During the last seven days, on how many days did you do physical activities like heavy lifting, digging, sports, cycling or walking?’ and ‘How much time did you usually spend on one of those days doing physical activities?’. The second item had to be answered by filling in the minutes per day. Respondents with missing values in one of the two items and with values less than 10 min or more than 960 min were coded as missing (13?9 % missing values). Additionally, physical activity was grouped into two categories: physical activity $30 min/d (n 3588) and less physical activity (n 1738).
‘Health consciousness’ (a 5 0?79) related to eating was assessed with following statements using a six-point answering scale ranging from 1 5 ‘do not agree at all’ to 6 5 ‘totally agree’: ‘I think it is important to eat healthily’, ‘My health is dependent on how and what I eat’, ‘If one eats healthily, one gets ill less frequently’ and ‘I am prepared to leave a lot, to eat as healthily as possible’(24).
Data analysis
Data were analysed to examine which eating behaviours, dietary behaviours, sociodemographic and lifestyle factors were of importance for high snack frequency. All analyses were performed using the statistical software package IBM SPSS Statistics 19?0.
First, one-way ANOVA and x2 tests were used to evaluate gender differences in eating behaviours, dietary behaviours, and lifestyle and sociodemographic variables. Additionally, the study population was categorised into tertiles based on weekly snack frequency (high, moder-ate, low). The highest tertile included all respondents who indicated having a snack frequency between 7?5 and 20?1 times/week, the moderate tertile included all respondents who indicated having a snack frequency between 2?5 and 7?0 times/week, and the lowest tertile included all respondents who indicated having a snack frequency between 0 and 2?0 times/week. One-way ANOVA and x2tests were used for examining differences
in mean scores for all variables between tertiles. ANOVA and x2tests were done for males and females separately. Significant F tests were followed up by the examina-tion of contrasts using the Tukey Honestly Significant Difference test.
Second, linear regression analysis was used to identify associations between snack frequency as the dependent variable and the other characteristics. No cases of multi-collinearity were detected by bivariate correlations.
Third, cluster analysis was used to identify relatively homogeneous profiles of dietary behaviours, using only the respondents from the highest snack-frequency tertile (n 1890). Clustering variables were the six dietary behaviours: consumption frequency of vegetables, fruit, convenience foods, sweets and savouries, sugar-sweetened beverages and meat. Hierarchical, agglomerative cluster analysis was performed with the squared Euclidean distance as the distance measure in the clustering proce-dure. Therefore, the procedure was accomplished using standardized scores (Z-scores), employing Ward’s method. Cluster solutions of two to eight segments were generated initially. The final cluster solution was chosen by examining the agglomeration schedule. The three-cluster solution was found to be adequate and meaningful regarding the different patterns found, and therefore it is reported in the results section (Table 5). Comparisons of the three clusters based on eating behaviour, sociodemographic and lifestyle factors are displayed separately for male and female respondents (Table 6).
Results
Table 2 shows snack frequency, eating behaviours, dietary behaviours, and sociodemographic and lifestyle variables by gender. Mean snack frequency per week was higher for females (6?6 times/week) than for males (5?2 times/week). Females indicated having higher vegetable and fruit consumption, while males reported higher mean intakes of meat, sugar-sweetened beverages and convenience food. Males were also less likely to have a daily breakfast and lunch, were less health-conscious, had higher BMI, were more physically active, had a higher mean consumption of wine and beer, were older, had a higher educational level and were less likely to have children. No significant gender difference was found for having dinner on a daily basis, or for consumption of sweets and savouries.
Table 3 presents the investigated variables by tertiles of snack frequency per week, showing males and females separately. The dietary behaviours in the highest snack-frequency tertile were different from those in the lowest group with respect to higher frequency consumption of all food groups, with the exception of vegetable con-sumption in females. Male respondents with a low snack frequency were more likely to be older, eat main meals
on a more regular basis and to indicate having family meals more often than male respondents with high-frequency snack consumption. Female respondents with high-frequency snack consumption were more likely to skip breakfast and to report lower health consciousness compared with female respondents in the lowest snack-frequency group.
Table 4 illustrates the results of the regression analysis with snack frequency as the dependent variable (n 4871). Seven variables showed a significant effect (P # 0?01), and the model accounted for 23 % of the variance in snack frequency per week. Significant positive associa-tions were found for sweets and savouries (b 5 0?34), fruit (b 5 0?13) and watching TV during the main meal (b 5 0?04). Inverse associations were found for having family meals 4–7 times/week (b 5 20?04), age (b 5 20?23), high educational level (b 5 20?09) and wine and beer consumption frequency (b 5 20?08).
Clusters of high-frequency snack consumers The cluster analysis resulted in a three-cluster solution for high snack consumers (n 1890) with Cluster 1 repre-senting a healthy dietary pattern, Cluster 2 reprerepre-senting a moderate dietary pattern and Cluster 3 characterized by an unhealthy dietary pattern (Tables 5 and 6).
The healthy Cluster 1 (n 851) consisted mainly of older females, and was characterized by the highest
consumption of vegetables and fruit and the lowest consumption frequency of more unhealthy food groups such as sweets and savouries, and meat. Respondents in this cluster reported the highest levels of health consciousness and reported more regular breakfast consumption. This cluster mostly included higher edu-cated males.
The unhealthy Cluster 3 (n 85) was the smallest cluster and consisted mainly of males. It was characterized by the highest consumption frequency of the more unhealthy foods and low fruit and vegetable consumption. A higher percentage of respondents skipped breakfast on a daily basis and watched TV during the main meal, compared with the other two clusters. In addition, wine and beer consumption frequency in males was the highest in this cluster.
Cluster 2 was the largest group (n 954) and respon-dents in this cluster had dietary behaviours ranging between the healthy and unhealthy clusters. Females in this cluster indicated having moderate consump-tion frequencies of the more unhealthy food groups, such as sugar-sweetened beverages and meat, but also had infrequent intakes of fruit and vegetables. Males in this cluster reported moderate consumption frequencies of sugar-sweetened beverages and con-venience food, but also infrequent intakes of fruit and vegetables.
Table 2 Characteristics of the study population according to gender: Swiss adults, 2010 (Swiss Food Panel) Males (n 2938)- Females (n
3234)-Mean or % SD Mean or % SD F or x2 df1, df2or df
Eating behaviour
Snack frequency per week 5?2 5?4 6?6 5?8 90?7*** 1, 6103-
-Daily breakfast (%) 66?6 – 71?9 – 19?8*** 1
Daily lunch (%) 72?0 – 76?8 – 18?8*** 1
Daily dinner (%) 82?3 – 83?0 – 0?5NS 1
Having family meals 4–7 times/week (%) 71?3 – 64?7 – 29?6*** 1
Watching TV during the main meal 4–7 times/week (%) 11?5 – 14?0 – 8?1** 1 Dietary behaviour (consumption frequency per week)
Sweets and savouries 4?7 4?9 4?6 4?8 0?7NS 1, 6049-
-Sugar-sweetened beverages 0?8 2?0 0?3 1?3 102?1*** 1, 6083-
-Meat 5?7 4?2 4?0 3?3 280?2*** 1, 6065-
-Convenience food 1?2 2?6 0?7 1?5 72?1*** 1, 5984-
-Vegetables (servings/week) 17?9 10?9 21?4 11?5 146?9*** 1, 6066-
-Fruit (pieces/week) 8?8 7?9 11?2 8?0 143?9*** 1, 6083-
-Sociodemographic and lifestyle characteristics
Age (years) 56?9 15?1 52?1 15?1 155?6*** 1, 6089-
-Health consciousness 4?4 1?0 4?7 0?9 144?3*** 1, 6088-
-Wine and beer consumption frequency per week 3?4 3?7 1?6 2?4 463?3*** 1, 6129-
-BMI (kg/m2) 25?8 3?7 23?5 4?3 491?5*** 1, 6097-
-Overweight (%) 54?0 – 28?0 – 429?4*** 1
Physical activity $30 min/d (%) 66?6 – 60?2 – 25?3*** 1
Having children #16 years old (%) 20?3 – 29?1 – 61?7*** 1
Education (%) Low 8?9 – 12?6 – 50?2*** 2 Middle 34?8 – 39?6 – High 56?3 – 47?8 – TV, television. *P , 0?05, **P , 0?01, ***P , 0?001. -n could vary due to missing values. --Values are indicated as df1, df2.
Table 3 Characteristics of the study population according to tertile of snack frequency per week (n 6105): Swiss adults, 2010 (Swiss Food Panel) Tertiles of snack frequency per week
Highest- Moderate-- Lowesty
Males (n 809)J Females (n 1200)J Males (n 878)J Females (n 985)J Males (n 1227)J Females (n 1006)J Males Females Characteristic Mean or % SD Mean or % SD Mean or % SD Mean or % SD Mean or % SD Mean or % SD F or x2 df1, df2or df F or x2 df1, dfdf2or Eating behaviours
Snack frequency per week 12?3a 4?4 12?7x 4?2 4?8b 1?6 5?0y 1?6 0?7c 0?8 0?8z 1?6 5145?2*** 2, 2911z 5283?9*** 2, 3188z
Daily breakfast (%) 58?5 – 66?8 – 62?5 – 71?7 – 74?8 – 77?7 – 67?6*** 2 32?2*** 2
Daily lunch (%) 69?7 – 77?9 – 68?0 – 76?0 – 76?2 – 76?0 – 19?6*** 2 1?6NS 2
Daily dinner (%) 80?8 – 84?6 – 80?6 – 80?9 – 84?4 – 82?9 – 6?7* 2 5?4NS 2
Family meals 4–7 times/week (%) 63?0 – 66?6 – 68?6 – 65?9 – 78?5 – 61?1 – 60?7*** 2 7?8* 2
Watching TV during the main meal 4–7 times/week (%)
14?6 – 15?4 – 11?8 – 11?6 – 9?3 – 14?6 – 13?0** 2 6?8* 2
Dietary behaviours (consumption frequency per week)
Sweets and savouries 6?9a 6?4 6?4x 5?8 4?8b 4?4 4?1y 3?7 3?1c 3?3 2?9z 3?4 150?8*** 2, 2857z 172?3*** 2, 3125z Sugar-sweetened beverages 1?1a 2?3 0?5x 1?6 0?8b 2?0 0?3y 1?3 0?5c 1?6 0?2y 1?3 23?1*** 2, 2873z 12?2*** 2, 3147z
Meat 6?4a 5?2 4?3x 3?4 5?6b 3?7 4?0x,y 3?1 5?2b 3?7 3?8y 3?2 19?0*** 2, 2872z 9?2*** 2, 3124z
Convenience food 1?7a 3?6 0?8x 1?6 1?1b 1?9 0?8x 1?5 0?8c 1?6 0?5b 1?2 36?5*** 2, 2859z 14?1*** 2, 3105z Vegetables 18?5a 11?1 21?4 11?2 18?0a,b 10?9 21?3 10?8 17?3b 10?7 21?6 12?3 3?4* 2, 2884z 0?6NS 2, 3160z
Fruit 9?3a 7?7 11?9x 8?0 8?5a,b 7?8 10?6y 7?8 8?2b,c 7?7 10?6y 8?0 4?7** 2, 2897z 7?0** 2, 3163z
Sociodemographic and lifestyle characteristics
Age (years) 49?6a 13?8 46?6x 13?4 54?8b 14?4 51?0y 14?0 61?9c 13?9 56?7z 14?6 181?5*** 2, 2870z 145?8*** 2, 3149z Health consciousness 4?3a 1?0 4?6x 0?9 4?4a 1?0 4?7x 0?9 4?5b 1?0 4?9y 0?9 9?6*** 2, 2891z 14?3*** 2, 3132z Wine and beer consumption frequency
per week
2?9a 3?6 1?3x 2?1 3?3b 3?5 1?6y 2?2 3?7b 3?9 2?0z 2?7 9?3** 2, 2887z 27?9*** 2, 3164z BMI (kg/m2) 25?4a 3?5 23?2x 4?3 25?9b 4?0 23?6y 4?3 26?0b 3?5 23?6y 4?2 6?9NS 2, 2887z 4?6** 2, 3149z
Overweight (%) 47?8 – 23?9 – 54?0 – 30?5 – 58?1 – 29?5 – 20?9*** 2 13?8** 2
Physical activity $30 min/d (%) 66?4 – 59?0 – 63?4 – 59?7 – 69?5 – 62?5 – 8?0* 2 0?3NS 2
Having children #16 years old (%) 27?2 – 36?7 – 21?2 – 30?6 – 15?2 – 18?6 – 42?3*** 2 83?6*** 2
Education (%)
Low 9?2 – 11?3 – 7?5 – 11?3 – 9?4 – 14?7 – 10?8* 4 2?7NS 2
Middle 38?6 – 40?1 – 34?8 – 40?6 – 32?5 – 38?4 –
High 52?2 – 48?6 – 57?7 – 48?0 – 58?1 – 46?9 –
TV, television.
a,b,c,x,y,zOne-way ANOVA, and x2tests were used for examining differences between tertiles. Analysis was done for males and females separately. Mean values within rows with unlike superscript letters were significantly different (post hoc test: Tukey’s Honestly Significant Difference test, P , 0?05):a,b,cfor significant differences between tertiles for males;x,y,zfor significant differences between tertiles for females. *P , 0?05, **P , 0?01, ***P , 0?001.
-Highest tertile includes all respondents who indicated having a snack frequency between 7?5 and 20?1 times/week. --Moderate tertile includes all respondents who indicated having a snack frequency between 2?5 and 7?0 times/week. yLowest tertile includes all respondents who indicated having a snack frequency between 0 and 2?0 times/week. Jn could vary due to missing values.
zValues are indicated as df1, df2.
1492 C Hartmann et al . . https://doi.org/10.1017/S1368980012003771 https:/www.cambridge.org/core
. University of Basel Library
, on
30 May 2017 at 16:42:20
The variables of BMI, percentage of overweight, percen-tage of physically active males, daily lunch for males, having family meals 4–7 times/week and having children #16 years old did not differ significantly among clusters.
Discussion
We investigated snack frequency and its association with sociodemographic characteristics, dietary and eating behaviour, and lifestyle factors. We hypothesised that high-frequency snack consumers could be separated into different subgroups with different underlying food patterns and lifestyle factors.
Our results show that high-frequency snack consumers (with at least 7?5 snack occasions/week) more frequently consumed both healthy and unhealthy food groups com-pared with low-frequency snack consumers. Increasing snack frequency was associated with a more unhealthy dietary behaviour, such as consuming sweets and savouries. It was also associated with watching TV during the main meal, having fewer family meals and lower alcohol intake. Fruit consumption was positively associated with snack frequency, indicating higher fruit intake with increasing snack frequency. Finally, we found three subgroups of high-frequency snack consumers: a healthy, a moderate and an unhealthy dietary-pattern group.
The highest levels of health consciousness were reported by respondents in the healthy and moderate eating clusters,
indicating that individuals in these groups tended to act more in accordance with their internal attitudes towards health than the less health-conscious individuals, who might be more subject to external influences(25). Thus, less health-conscious individuals might be more affected by the obesogenic environment, which makes a healthy lifestyle, and particularly the healthy food choices associated with this lifestyle, more difficult.
Differences in health-conscious ratings could also be seen between genders; men seemed to be less health-conscious than women. Therefore, women were more likely to be mindful of their daily diet and to make healthier food choices. Former studies indicate that men give a lower priority to health than to other considera-tions, like taste or convenience, when making their food choices(26,27). It is thus not surprising that men in our study showed higher-frequency consumption of meat, sugar-sweetened beverages and alcohol. In addition, the highest frequency of convenience food consumption occurred in males in the unhealthy cluster. Convenience food consumption was also shown to be an unfavourable dietary behaviour, as it was associated with obesity(22). As reported in other studies, our results suggest that men practise an unhealthy lifestyle more often than do women(28).
BMI was not found to be associated with snack frequency in the regression analysis. Thus, the results of our study do not support the notion that increased snack frequency, in itself, is a cause of obesity. However,
Table 4 Results from the multiple regression analysis with snack frequency per week as the dependent variable (n 4871): Swiss adults, 2010 (Swiss Food Panel)
b SEb Standard b P value
Eating behaviours
Daily breakfast (yes 5 1/no 5 0) –0?38 0?17 –0?03 0?026
Daily lunch (yes 5 1/no 5 0) 0?20 0?18 0?02 0?368
Daily dinner (yes 5 1/no 5 0) 0?43 0?20 0?03 0?032
Having family meals 4–7 times/week (yes 5 1/no 5 0) –0?43 0?17 –0?04 0?009 Watching TV during the main meal 4–7 times/week
(yes 5 1/no 5 0)
0?72 0?23 0?04 0?001
Dietary behaviours (consumption frequency per week)
Sweets and savouries 0?40 0?02 0?34 0?000
Sugar-sweetened beverages 0?06 0?05 0?02 0?236
Meat –0?03 0?02 –0?02 0?165
Convenience food 0?04 0?04 0?01 0?301
Vegetables –0?05 0?05 –0?01 0?308
Fruit 0?67 0?07 0?13 0?000
Sociodemographic and lifestyle characteristics
Age (years) –0?09 0?01 –0?23 0?000
Health consciousness 0?08 0?08 0?01 0?316
Wine and beer consumption frequency per week –0?14 0?03 –0?08 0?000
BMI –0?02 0?02 –0?01 0?419
Physical activity $30 min/d (yes 5 1/no 5 0) 0?06 0?15 0?01 0?715
Having children #16 years (yes 5 1/no 5 0) 0?24 0?19 0?02 0?205
Gender (females) 0?32 0?17 0?03 0?052
Education
Medium v. low –0?43 0?28 –0?04 0?126
High v. low –0?98 0?27 –0?09 0?000
TV, television.
Significant coefficients are indicated in bold font. R250?23.
Table 5 Cluster centres for the six dietary behaviours included in the cluster analysis; presented for males and females separately: Swiss adults, 2010 (Swiss Food Panel)
Cluster 1: ‘Healthy’ Cluster 2: ‘Moderate’ Cluster 3: ‘Unhealthy’ F statistic
Males (n 254) Females (n 597) Males (n 456) Females (n 498) Males (n 52) Females (n 33) Males Females
Clustering factors Mean SD Mean SD Mean SD Mean SD Mean SD Mean SD F (2, 759) F (2, 1125)
Sweets and savouries 7?2a 7?5 6?8x 6?5 6?2a 4?7 5?9y 4?7 10?3b 10?4 8?1x,y 6?5 16?3*** 11?2***
Sugar-sweetened beverages 0?4a 1?3 0?1x 0?4 0?8b 1?2 0?4y 8?7 7?5c 3?8 7?9z 3?4 470?1*** 1243?4***
Meat 5?5a 6?2 3?6x 3?1 6?2a 3?6 5?1y 3?7 11?5b 8?7 6?3y 3?6 29?6*** 14?1***
Convenience foods 0?9a 1?8 0?5x 1?1 1?6b 2?0 1?1y 1?8 7?8c 12?7 2?2z 3?9 72?0*** 20?9***
Fruit 20?2a 6?9 20?1x 7?2 6?9b 5?3 8?3y 4?9 6?2b 5?9 8?2y 7?4 318?1*** 506?2***
Vegetables 27?7a 14?8 28?7x 13?0 16?7b 8?6 18?2y 8?5 13?5b 9?6 15?2y 9?9 74?7*** 135?2***
Only high-frequency snack consumers (7?5–20?1 snack occasions/week) were included in the cluster analysis (n 1890). Mean values indicate consumption frequency per week.
a,b,c,x,y,zOne-way ANOVA were used for examining differences between clusters (P , 0?001). Analysis was done for males and females separately. Mean values within rows with unlike superscript letters were significantly different (post hoc test: Tukey’s Honestly Significant Difference test, P , 0?05):a,b,cfor significant differences between clusters for males;x,y,zfor significant differences between clusters for females. ***P , 0?001.
Table 6 Descriptive factors for the three clusters; presented for males and females separately: Swiss adults, 2010 (Swiss Food Panel) Cluster 1: ‘Healthy’ Cluster 2: ‘Moderate’ Cluster 3: ‘Unhealthy’
Males Females Males Females Males Females Males Females
Descriptive factor Mean or % SD Mean or % SD Mean or % SD Mean or % SD Mean or % SD Mean or % SD F or x2
df1, df2or df F or x2 df1, df2or df Age (years) 53?3a 13?0 48?2x 13?5 47?8 13?6 45?6x 13?6 47?6b 16?4 37?9y 10?8 4?2* 2, 759- 8?6*** 2, 1115-Health consciousness 4?6a 0?9 4?9a 0?8 4?2b 1?0 4?5b 1?0 3?7c 1?1 4?2b 0?9 16?8*** 2, 757- 24?1*** 2, 1112-Wine and beer consumption frequency per week 2?8a 3?3 1?2x,y 2?1 2?8a 3?3 1?4x 2?1 4?8b 7?1 0?4y 0?6 6?9** 2, 759- 3?8* 2, 1123-BMI (kg/m2
) 25?3 3?4 23?1 4?1 25?5 3?6 23?4 4?4 24?5 3?6 22?1 3?3 1?7NS
2, 757- 1?6NS
2,
1110-Overweight (%) 47?6 – 23?2 – 47?8 – 24?7 – 46?2 – 18?8 – 0?1NS 2 0?9NS 2
Physical activity $30 min/d (%) 68?6 – 63?7 – 64?4 – 52?1 – 68?9 – 58?6 – 3?3NS
2 10?9** 2
Having children #16 years old (%) 29?0 – 33?6 – 27?7 – 39?9 – 22?4 – 45?5 – 1?0NS 2 4?5NS 2
Family meals 4–7 times/week (%) 64?8 – 63?7 – 62?6 – 68?2 – 55?8 – 75?8 – 2?3NS
2 3?0NS 2 Watching TV during the main meal 4–7 times/week (%) 10?2 – 13?5 – 15?2 – 15?7 – 30?6 – 33?3 – 12?3** 2 8?9* 2
Daily breakfast (%) 70?4 – 73?7 – 52?6 – 59?5 – 44?2 – 33?3 – 11?3** 2 26?8*** 2 Daily lunch (%) 74?7 – 79?8 – 66?9 – 75?1 – 69?2 – 75?8 – 0?1NS 2 7?2* 2 Daily dinner (%) 86?5 – 85?5 – 77?8 – 81?6 – 74?5 – 90?9 – 2?6NS 2 6?0* 2 Education (%) Low 7?5 – 10?2 – 8?3 – 11?1 – 17?3 – 12?1 – 13?7** 4 5?6NS 4 Middle 37?3 – 37?7 – 37?9 – 42?1 – 51?9 – 54?5 – High 55?2 – 52?1 – 53?7 – 46?8 – 30?8 – 33?3 – TV, television. a,b,c,x,y,z
One-way ANOVA, and x2
tests were used for examining differences in descriptive factors between clusters. Analysis was done for males and females separately. Mean values within rows with unlike superscript letters were significantly different (post hoc test: Tukey’s Honestly Significant Difference test, P , 0?05):a,b,c
for significant differences between clusters for males;x,y,z
for significant differences between clusters for females. *P , 0?05, **P , 0?01, ***P , 0?001.
Values are indicated as df, df.
1494 C Hartmann et al . . https://doi.org/10.1017/S1368980012003771 https:/www.cambridge.org/core
. University of Basel Library
, on
30 May 2017 at 16:42:20
consumption frequency scores from the questionnaire might be biased by conscious or unconscious under/ over-reporting of true food consumption(29). Additionally, in the case where respondents indicated a recent change to their nutrition pattern, the cross-sectional design made it impossible to differentiate between whether their actual body weight status was a cause or a consequence of their reported nutritional pattern. BMI was calculated from self-reported weight and height. Thus, an underestimation/ under-reporting of weight was likely to occur, particularly among overweight and obese respondents(30).
In general, FFQ are used most often in studies with large sample sizes, to estimate individuals’ habitual food intake(31). Nevertheless, they give only limited information about individuals’ food intake and they do not capture dietary behaviour in its entirety.
Interpretation of snack frequency per week might have been biased by the fact that there are conflicting views held by the general public about the definition of a ‘snack’ and a ‘meal’(32). Consumers conceptualise snacks differently – for example, using time of day or food type as a means of classification(32). In particular, food intake close to main meal consumption might be classified either as part of the main meal or as snack, depending on individual views. Additionally, people practising a non-traditional mealtime pattern with more than four snack occasions per day, or with a so-called ‘nibbling pattern’, could not be clearly detected using this method.
Some studies do not control for physical activity, a possible confounder of the association between eating frequency and BMI(33). Therefore, we interpreted physical activity of more than 30 min/d to identify an active lifestyle. In our study, we did not find an association between snack frequency and physical activity. A possible limitation may be that we could not distinguish between different exercise intensities, which may influence snack frequency as well as energy balance, and thus body weight status. It should also be mentioned that the response rate was low and that the study population had significantly fewer lower-educated participants than higher-lower-educated participants. This should be taken into consideration when the results are interpreted.
Conclusion
In our study, we measured snack frequency, which refers to the number of additional food items consumed between main meals. The results indicate that there is no association between BMI and snack frequency.
High-frequency snack consumption occurs in the context of healthy, as well as unhealthy, dietary behaviour and lifestyle patterns. Women are more likely to make healthier dietary food choices, while men are likely to choose unhealthy foods such as sweets and savouries more often. In developing prevention strategies or interventions, instead
of advising a specific number of snacks per day, healthy food choices and healthy lifestyles should be stimulated. Advising a general increase in snack consumption might even have unfavourable effects, as increasing the number of eating occasions per day without increasing the energy intake at the same time might be difficult to achieve(34). The consumption of nutritious snacks should be promoted and consumers, especially men, need to be sensitised to the energy density of sweets and savouries as snacks.
Acknowledgements
The Swiss Federal Office of Public Health funds the Swiss Food Panel. C.H. is supported by the Swiss Federal Office of Public Health. The authors declare no conflicts of interest for this study. M.S. and K.v.d.H. participated in the design of the study; C.H. and K.v.d.H. conducted the data analysis and wrote the manuscript; M.S. made critical comments on the drafts.
References
1. La Bounty Paul CB, Jacob W, Elfego G et al. (2011)
International Society of Sports Nutrition position stand: meal frequency. J Int Soc Sports Nutr 8, 1–12.
2. Chiva M (1997) Cultural aspects of meals and meal
frequency. Br J Nutr 77, 21–28.
3. Hill JO & Melanson EL (1999) Overview ot the
determi-nants of overweight and obesity: current evidence and research issues. Med Sci Sports Exerc 31, 515–521.
4. Piernas C & Popkin BM (2010) Snacking increased among
US adults between 1977 and 2006. J Nutr 140, 325–332.
5. Hampl JS, Heaton CLB & Taylor CA (2003) Snacking
patterns influence energy and nutrient intakes but not body mass index. J Hum Nutr Diet 16, 3–11.
6. Johnson GH & Anderson GH (2010) Snacking definitions:
impact on interpretation of the literature and dietary recommendations. Crit Rev Food Sci 50, 848–871.
7. Holmback I, Ericson U, Gullberg B et al. (2010) A high
eating frequency is associated with an overall healthy lifestyle in middle-aged men and women and reduced likelihood of general and central obesity in men. Br J Nutr 104, 1065–1073.
8. Whybrow S & Kirk TR (1997) Nutrient intakes and snacking
frequency in female students. J Hum Nutr Diet 10, 237–244.
9. Mills JP, Perry CD & Reicks M (2011) Eating frequency is
associated with energy intake but not obesity in midlife women. Obesity (Silver Spring) 19, 552–559.
10. Leidy HJ & Campbell WW (2011) The effect of eating
frequency on appetite control and food intake: brief synopsis of controlled feeding studies. J Nutr 141, 154–157.
11. Schlundt DG, Hill JO, Sbrocco T et al. (1992) The role of
breakfast in the treatment of obesity – a randomized clinical-trial. Am J Clin Nutr 55, 645–651.
12. Swinburn B, Egger G & Raza F (1999) Dissecting
obesogenic environments: the development and applica-tion of a framework for identifying and prioritizing environmental interventions for obesity. Prev Med 29, 563–570.
13. Berteus-Forslund H, Torgerson JS, Sjostrom L et al. (2005)
Snacking frequency in relation to energy intake and food choices in obese men and women compared to a reference population. Int J Obes (Lond) 29, 711–719.
14. Nielsen SJ, Siega-Riz AM & Popkin BM (2002) Trends in energy intake in US between 1977 and 1996: similar shifts seen across age groups. Obes Res 10, 370–378.
15. Boutelle KN, Birnbaum AS, Lytle LA et al. (2003) Associations
between perceived family meal environment and parent intake of fruit, vegetables, and fat. J Nutr Educ Behav 35, 24–29.
16. Coon KA, Goldberg J, Rogers BL et al. (2001) Relationships
between use of television during meals and children’s food consumption patterns. Pediatrics 107, e7.
17. Beer-Borst S, Hercberg S, Morabia A et al. (2000) Dietary
patterns in six European populations: results from EURALIM, a collaborative European data harmonization and informa-tion campaign. Eur J Clin Nutr 54, 253–262.
18. Dynesen AW, Haraldsdottir J, Holm L et al. (2003)
Socio-demographic differences in dietary habits described by food frequency questions results from Denmark. Eur J Clin Nutr 57, 1586–1597.
19. Whybrow S, Mayer C, Kirk TR et al. (2007) Effects of
two weeks’ mandatory snack consumption on energy intake and energy balance. Obesity (Silver Spring) 15, 673–685.
20. Swiss Federal Statistical Office (2010) Population and
Household statistics (STATPOP). http://www.bfs.admin.ch/ bfs/portal/de/index/infothek/erhebungen__quellen/blank/ blank/statpop/01.html (accessed April 2011).
21. Hu FB & Malik VS (2010) Sugar-sweetened beverages
and risk of obesity and type 2 diabetes: epidemiologic evidence. Physiol Behav 100, 47–54.
22. van der Horst K, Brunner TA & Siegrist M (2010)
Ready-meal consumption: associations with weight status and cooking skills. Public Health Nutr 14, 239–245.
23. Faramawi MF, Johnson E, Fry MW et al. (2007)
Con-sumption of different types of meat and the risk of renal cancer: meta-analysis of case–control studies. Cancer Causes Control 18, 125–133.
24. Schifferstein HNJ & Oude Ophuis PAM (1998)
Health-related determinants of organic food consumption in the Netherlands. Food Qual Prefer 9, 119–133.
25. Gould SJ (1990) Health consciousness and health behavior –
the application of a new health consciousness scale. Am J Prev Med 6, 228–237.
26. Wardle J, Haase AM, Steptoe A et al. (2004) Gender
differences in food choice: the contribution of health beliefs and dieting. Ann Behav Med 27, 107–116.
27. Fagerli RA & Wandel M (1999) Gender differences in
opinions and practices with regard to a ‘healthy diet’. Appetite 32, 171–190.
28. Haveman-Nies A, de Groot LPGM & van Staveren WA
(1998) Snack patterns of older Europeans. J Am Diet Assoc 98, 1297–1302.
29. Voss S, Kroke A, KlipsteinGrobusch K et al. (1997) Obesity
as a major determinant of underreporting in a self-administered food frequency questionnaire: results from the EPIC-Potsdam study. Z Ernahrungswiss 36, 229–236.
30. Nyholm M, Gullberg B, Merlo J et al. (2007) The validity of
obesity based on self-reported weight and height: implications for population studies. Obesity (Silver Spring) 15, 197–197.
31. Cade J, Thompson R, Burley V et al. (2002) Development,
validation and utilisation of food-frequency questionnaires – a review. Public Health Nutr 5, 567–587.
32. Gatenby SJ (1997) Eating frequency: methodological and
dietary aspects. Br J Nutr 77, 7–20.
33. Duval K, Doucet E, Strychar I et al. (2008) Physical activity is a
confounding factor of the relation between eating frequency and body composition. Am J Clin Nutr 88, 1200–1205.
34. Forslund HB, Lindroos AK, Sjostrom L et al. (2002) Meal
patterns and obesity in Swedish women – a simple instrument describing usual meal types, frequency and temporal distribution. Eur J Clin Nutr 56, 740–747.