HAL Id: hal-00296881
https://hal.archives-ouvertes.fr/hal-00296881
Submitted on 23 Feb 2006
HAL is a multi-disciplinary open access
archive for the deposit and dissemination of
sci-entific research documents, whether they are
pub-lished or not. The documents may come from
teaching and research institutions in France or
abroad, or from public or private research centers.
L’archive ouverte pluridisciplinaire HAL, est
destinée au dépôt et à la diffusion de documents
scientifiques de niveau recherche, publiés ou non,
émanant des établissements d’enseignement et de
recherche français ou étrangers, des laboratoires
publics ou privés.
A TRMM-Calibrated infrared technique for rainfall
estimation: application on rain events over eastern
Mediterranean
H. Feidas, G. Kokolatos, A. Negri, M. Manyin, N. Chrysoulakis
To cite this version:
H. Feidas, G. Kokolatos, A. Negri, M. Manyin, N. Chrysoulakis. A TRMM-Calibrated infrared
tech-nique for rainfall estimation: application on rain events over eastern Mediterranean. Advances in
Geosciences, European Geosciences Union, 2006, 7, pp.181-188. �hal-00296881�
European Geosciences Union
© 2006 Author(s). This work is licensed under a Creative Commons License.
Geosciences
A TRMM-Calibrated infrared technique for rainfall estimation:
application on rain events over eastern Mediterranean
H. Feidas1, G. Kokolatos1, A. Negri2, M. Manyin2, and N. Chrysoulakis3 1University of the Aegean, Department of Geography, Lesvos, Greece
2NASA/Goddard Space Flight Center, Laboratory for Atmospheres, Greenbelt, USA
3Foundation for Research and Technology, Institute of Applied and Computational Mathematics, Regional Analysis Division, Heraklion, Crete, Greece
Received: 7 October 2005 – Revised: 15 January 2006 – Accepted: 7 February 2006 – Published: 23 February 2006
Abstract. The aim is to evaluate the use of a satel-lite infrared (IR) technique for estimating rainfall over the eastern Mediterranean. The Convective-Stratiform Tech-nique (CST), calibrated by coincident, physically retrieved rain rates from the Tropical Rainfall Measuring Mission (TRMM) Precipitation Radar (PR), is applied over the East-ern Mediterranean for four rain events during the six month period of October 2004 to March 2005. Estimates from this technique are verified over a rain gauge network for differ-ent time scales. Results show that PR observations can be applied to improve IR-based techniques significantly in the conditions of a regional scale area by selecting adequate cal-ibration areas and periods. They reveal, however, the limi-tations of infrared remote sensing techniques, originally de-veloped for tropical areas, when applied to precipitation re-trievals in mid-latitudes.
1 Introduction
The Convective-Stratiform Technique (CST) is a satellite in-frared (IR) technique designed to estimate precipitation of the scale of individual thunderstorms. The original appli-cation (Adler and Negri, 1988) was over southern Florida, and the technique was calibrated by the output from a 1-D model. With the launch of the Tropical Rainfall Measur-ing Mission (TRMM) in November 1997, high quality, high-resolution, instantaneous microwave based estimates became available from the (passive) TRMM Microwave Radiometer (TMI) and the (active) TRMM Precipitation Radar (PR). Ne-gri et al. (2002, 2003) used TMI and PR derived rain rates to recalibrate the CST over northern South America and the
Correspondence to: H. Feidas
(xfeidas@geo.aegean.gr)
globe, respectively, and then apply the recalibrated technique in studying the diurnal variability of rainfall.
In this study we present work-in-progress to recalibrate the CST for the Mediterranean region using coincident physi-cally retrieved rain rates from the TRMM PR and its appli-cation in studying rain events of different intensity over this area.
2 Data and methodology
The present method used to recalibrate the CST is similar to the one published in Negri et al. (2002) except it is applied to Visible/Infrared Scanner (VIRS) and extended to Meteosat-7 data. The original CST (Adler and Negri, 1988) locates, in an array of IR data, all local minima in the brightness tem-perature field. In the original study, digital radar and visible channel imagery was used to remove thin, nonraining cirrus from convective clouds and remaining brightness tempera-ture minima were assumed to be centers of convective rain. A stratiform rain assignment, based on the mode temperature (the temperature that occurs most frequently) of each cloud system, completes the rain estimation.
As an intermediate step, the parameters of the original technique were recalibrated for the Mediterranean region us-ing data from two TRMM instruments: the 2A25 version 5 product from the PR, and the 1B01 version 5 product from the VIRS. We then apply this calibration to Meteosat IR data. The 2A25 data provide near-surface rainrate values at each resolution cell of the PR and distinguish between convective and non-convective precipitation using a flag (Fig. 1a and b). We classified any non-convective precipitation as “strati-form”. The VIRS data include IR measurements in a similar range to Meteosat IR data (Fig. 1c). Since both PR and VIRS are aboard the same satellite the data sets match in temporal and spatial coverage. Processing accounted for the difference
182 H. Feidas et al.: Application on rain events over eastern Mediterranean
Figure 1. Three TRMM data subsets taken from a single orbit along the satellite track (native
projection): (a) PR near-surface rainrate field; (b) PRconvective rain flag; (c) VIRS IR data. Note
that PR swath is narrower than VIRS swath.
12
Fig. 1. Three TRMM data subsets taken from a single orbit along the satellite track (native projection): (a) PR near-surface rainrate field; (b) PR convective rain flag; (c) VIRS IR data. Note that PR swath is narrower than VIRS swath.
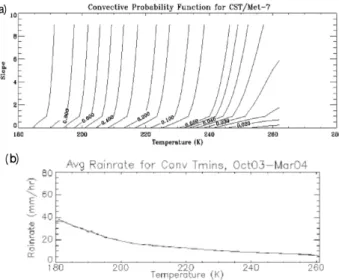
Figure 2. (a) Probability function of convection based on temperature and deviation from background (slope); probability ranges from 0.0 to 1.0; constant value contours are shown. (b) Relationship between temperature and rainrate for convective Tmins.
13
Fig. 2. (a) Probability function of convection based on temperature and deviation from background (slope); probability ranges from 0.0 to 1.0; constant value contours are shown. (b) Relationship between temperature and rainrate for convective Tmins.
in resolution of the data (5 km at nadir for PR, 2.4 km for VIRS), and VIRS data was only used from the area covered by the narrower PR swath. Only data falling within the range of longitude 10 W–30 E, latitude 30 N–38 N from a rainy sea-son (October 2003 through March 2004) were used regard-less of the precipitation content. More than 1000 TRMM orbits from this time period had coverage within this area.
The goal of the recalibration is to determine parameters so that the CST will be able to reproduce efficiently the to-tal rain volume, toto-tal rain area, and the PR-observed
divi-sion between convective and stratiform rain for the Mediter-ranean region. We adjust the CST on a statistical basis, over the 6-month calibration period, without explicit constraints on instantaneous rain estimates. The recalibration takes the following form:
a. Determination of Convective Cores.
This is based on the identification of points of local temperature minimum (Tmin)on VIRS IR data and the computation of the deviation of the Tminfrom the back-ground temperature (deviation from backback-ground), de-fined as the average temperature of the eight surround-ing pixels. Ussurround-ing the correspondsurround-ing PR-retrieved rain rate and type, each Tmin,within the Mediterranean area of the TRMM orbits was categorized as either convec-tive or nonconvecconvec-tive. Then a function was derived which determines the probability of convective rain for a given Tminand deviation from background. This func-tion was obtained by applying an optimizafunc-tion method to the database of Tminoccurrences. The resulting func-tion accepts a Tmin’s values of temperature and devi-ation from background, and returns the likelihood that the Tminis associated with convective precipitation. The resulting function accepts values of Tminand deviation from background as inputs, and returns the likelihood of Tmin to be associated with convective precipitation. We realize there may be differences between seasons. In this experiment we chose to ignore the seasonal vari-ations. The probability function is expressed as a value between 0.0 and 1.0 and is illustrated in Fig. 2a. b. Convective Rain Area.
The next task in the calibration is to determine the av-erage area covered by a convective occurrence, i.e. the
number of VIRS pixels to be labelled with a convective flag and rainrate in the neighborhood of each convective
Tmin. This is based on the computation of the simple ra-tio between the total convective area in the 6 months of PR overpasses and the corresponding number of con-vective Tmins sensed by VIRS. The result is 15 VIRS pixels are affected within the area of a convective Tmin. c. Convective Rain Rate.
The convective rain rate assigned to each Tminis a func-tion of temperature. This funcfunc-tion can be actually repre-sented by a smoothed look-up-table, in which each Tmin is mapped to the average of near-surface rain rate values found in its neighbourhood in PR data. The graphical representation of final look-up table is shown in Fig. 2b. d. Stratiform Rain Threshold.
To associate VIRS pixels with stratiform rain, a thresh-old on brightness temperature was determined from a three-step cumulative-area matching approach: i) the percentage of PR pixels (2.4%) with rain was deter-mined from the measurements over the studied region; ii) then the cumulative frequency of brightness tempera-ture for the 97 million VIRS pixels in the studied region was computed; iii) finally the entry of the cumulative frequency with a percentile of 2.4%; i.e. the aforemen-tioned PR percentile, was found at 233 K and used as a temperature threshold.
e. Stratiform Rain Rate.
We set the stratiform rain rate equal to the mean strati-form rain rate of the PR estimates for the training data set, which was computed to be 1.6 mm/hr. Since the total stratiform rain area from CST is equal to that of PR (integrated over the 6-month calibration period), this constant rain makes the total stratiform rain volume from CST to equal that of the PR alone.
f. Modification for Meteosat-7.
The calibration described above determined the pa-rameters for CST using VIRS data. In order to take into account the differences in sensor resolution and calibration, two adjustments were made to the CST. First, functions were derived, which when applied to Meteosat brightness temperature and deviation from background values, modify their distributions to more closely match distributions found in VIRS data. This was accomplished by identifying several pairs of VIRS orbits/Meteosat scenes over the Mediterranean region within 3 min from each others and with significant cloud systems. Frequencies of brightness temperature and deviation from background of those “training swaths” were used to build some “histogram-matching” func-tions. Those functions shift brightness temperature val-ues derived from Meteosat IR data so that the resulting histograms more closely matched those of the VIRS IR data. Finally these correction functions are applied be-fore the convective probability test is done.
(a)
(b)
(c)
Figure 3. (a) Meteosat-7 IR subimage over the Mediterranean on 8 October, 2003, at 11:30 UTC;
(b) all T
mins identified in the subimage (both convective and non-convective)
are shown with
small green dots, and cloud patches with temperatures between 150 and 263 K are shown in cyan;
(c) the resulting CST rainrate estimation with small convective areas in different colors (where
T
mins were judged to be convective) and larger stratiform areas shown in cyan.
14
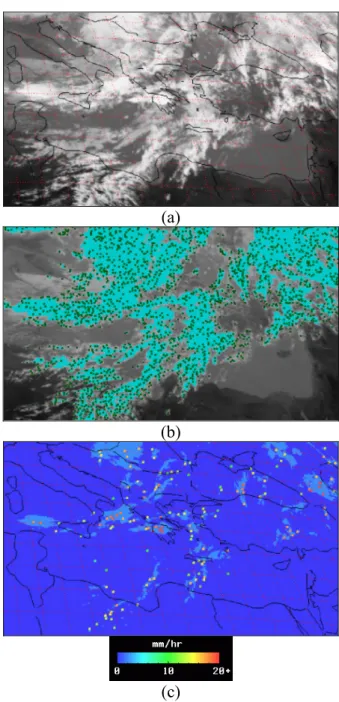
Fig. 3. (a) Meteosat-7 IR subimage over the Mediterranean on 8Oc-tober, 2003, at 11:30 UTC; (b) all Tmins identified in the subimage
(both convective and non-convective) are shown with small green dots, and cloud patches with temperatures between 150 and 263 K are shown in cyan; (c) the resulting CST rainrate estimation with small convective areas in different colors (where Tmins were judged to be convective) and larger stratiform areas shown in cyan.
The fraction of convective pixels over total pixels was computed, and then multiplied by the total number of Me-teosat pixels in the training swaths, to yield the target num-ber of convective pixels expected from CST operating on that portion of Meteosat data. CST was then applied to the Me-teosat data to determine the number of convective Tmins. Fi-nally, the total count of expected convective pixels was di-vided by the number of convective Tmins, yielding the num-ber of pixels per Tmin.
184 H. Feidas et al.: Application on rain events over eastern Mediterranean
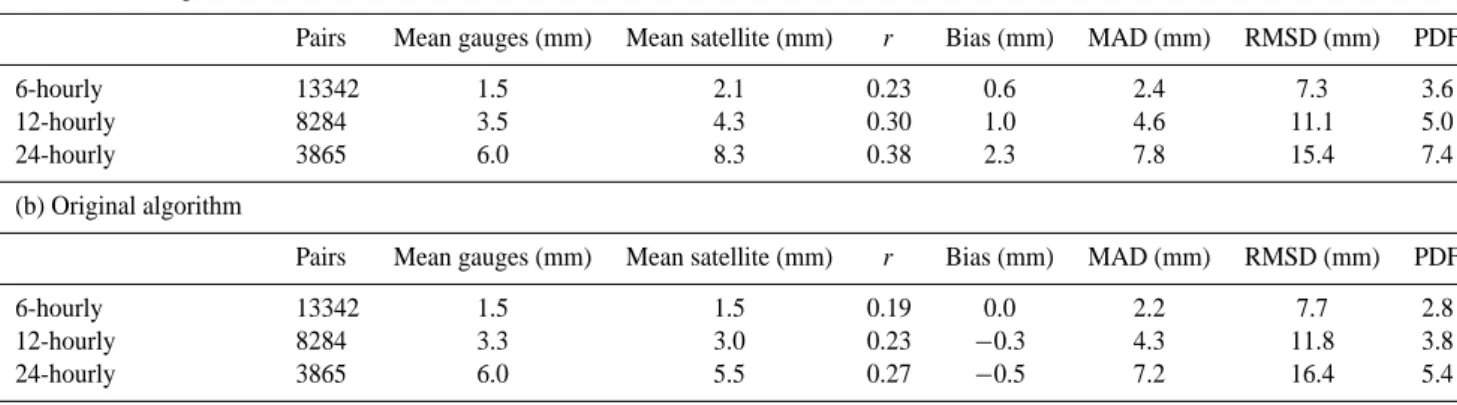
Table 1. Statistics of rain retrievals from calibrated and original CST for all four examined periods over each rain gauge station. Precipitation totals are accumulated over different time scales (6, 12, and 24 hourly intervals).
(a) Calibrated algorithm
Pairs Mean gauges (mm) Mean satellite (mm) r Bias (mm) MAD (mm) RMSD (mm) PDF
6-hourly 13342 1.5 2.1 0.23 0.6 2.4 7.3 3.6
12-hourly 8284 3.5 4.3 0.30 1.0 4.6 11.1 5.0
24-hourly 3865 6.0 8.3 0.38 2.3 7.8 15.4 7.4
(b) Original algorithm
Pairs Mean gauges (mm) Mean satellite (mm) r Bias (mm) MAD (mm) RMSD (mm) PDF
6-hourly 13342 1.5 1.5 0.19 0.0 2.2 7.7 2.8
12-hourly 8284 3.3 3.0 0.23 −0.3 4.3 11.8 3.8
24-hourly 3865 6.0 5.5 0.27 −0.5 7.2 16.4 5.4
Table 2. Statistics of rain retrievals from calibrated and original CST for all four examined periods using the mean regional precipitation accumulated over different time scales (6, 12, and 24 hourly intervals).
(a) Calibrated algorithm
Pairs Mean gauges (mm) Mean satellite (mm) r Bias (mm) MAD (mm) RMSD (mm) PDF
6-hourly 13342 1.5 1.5 0.19 0.0 2.2 7.7 2.8
12-hourly 8284 3.3 3.0 0.23 −0.3 4.3 11.8 3.8
24-hourly 3865 6.0 5.5 0.27 −0.5 7.2 16.4 5.4
(b) Original algorithm
Pairs Mean gauges (mm) Mean satellite (mm) r Bias (mm) MAD (mm) RMSD (mm) PDF
6-hourly 48 1.5 1.5 0.59 0.1 0.8 1.2 0.7
12-hourly 24 3.3 3.0 0.51 −0.3 1.5 2.3 0.5
24-hourly 12 6.1 5.6 0.60 −0.5 2.8 3.9 0.4
The second modification of CST for use with Meteosat data is the adjustment of the size of convective area (i.e. num-ber of Meteosat pixels) assigned to each convective Tmin. The CST algorithm is applied to the VIRS training swaths. The fraction of number of convective pixels over the total num-ber of pixels was computed, and then multiplied by the total number of Meteosat pixels in the training swaths, to yield the target number of convective pixels expected from CST oper-ating on that portion of Meteosat data. CST was then applied to the Meteosat data to determine the number of convective
Tmins. Finally, the total count of expected convective pixels was divided by the number of convective Tmins, yielding the number of pixels per Tmins.
In summary, the recalibrated CST, dubbed as CST/Met-7, finds local IR minima, decides if they are convective features, then assigns a rain area and rain rate based on the PR calibra-tion parameters. A stratiform rain area is then defined, and a lower rain rate is assigned to those cloud pixels colder than the stratiform IR threshold and not previously assigned con-vective rain. An example of the instantaneous application of this technique is shown in Fig. 3. The main differences of
the calibrated CST with the original technique is the higher temperature threshold used for the identification of stratiform regions and the determination of a larger number of convec-tive cores.
The CST/Met-7 algorithm is applied along with the origi-nal CST to half-hourly Meteosat IR data for four rain events of varying intensities resulted by the passage of a frontal de-pression system over eastern Mediterranean: 29 October–2 November 2004, 13–14 November 2004, 18–20 December 2004 and 26–27 December 2004. Results from both algo-rithms are intercompared and verified against gauge mea-surements. Six-hourly precipitation totals recorded by a network of 150 to 260 synoptic stations were employed as ground truth data to verify the precipitation estimates. This number of pluviometric stations was the maximum available and provided by the European Center for Medium Weather Forecast (ECMWF). Quality tests have been performed to these data to detect potential outliers.
For the total and for each one of these periods the follow-ing comparisons were made on the basis of 6, 12 and 24-h precipitation totals:
0 10 20 30 40 50 60 70 80 90 100 0 10 20 30 40 50 60 70 80 90 100
Rain gauges (mm/day)
Ca librat ed CST es tim at es ( m m /d ay ) overestimate underestimate r = 0.38 (a) 0 10 20 30 40 50 60 70 80 90 100 0 10 20 30 40 50 60 70 80 90 100
Rain gauges (mm/day)
Or iginal C S T estim at es (m m /day ) overestimate underestimate r = 0.27 (b) 0 200 400 600 800 1000 1200 1400 1600 1800 2000 0 0,1 2 2,1 5 5,1 - 10 10,1 - 20 20,1 - 30 30,1 - 40 40,1 - 50 50,1 - 60 60,1 - 70 70,1 - 80 80,1 - 90 > 90
Daily rainfall (mm/day)
Fr equenc y Rain gauges Calibrated CST estimates Original CST estimates
(c)
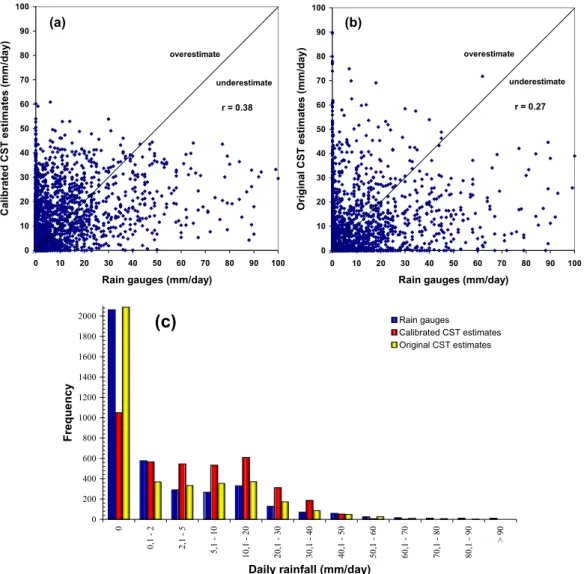
Figure 4. (a) Calibrated CST and (b) Original CST daily rain accumulation as function of rain gauge measurements for the four studied periods (3865 pairs). (c) Frequencies of daily rain accumulation as measured from the rain gauges and as determined from the original and calibrated CST estimates.
15
Fig. 4. (a) Calibrated CST and (b) Original CST daily rain accumulation as function of rain gauge measurements for the four studied periods (3865 pairs). (c) Frequencies of daily rain accumulation as measured from the rain gauges and as determined from the original and calibrated CST estimates.
1. Twelve-hourly accumulated precipitation for each of the pluviometric station processed, versus the rainfall re-trieved from satellite data for the corresponding pixel location. For each station the total precipitation was cal-culated as the average value of 3 by 3 Meteosat pixels (representing an area of 300±9 km2depending on geo-graphic position), centered over each pixel correspond-ing to the station.
2. Average regional rain gauge precipitation as function of average regional satellite precipitation during 6, 12 and 24-h intervals. The mean regional precipitation mea-sured by rain gauges is calculated by applying a sim-ple arithmetic average of rain accumulation reported by the network of rain gauges during a given time inter-val. The corresponding average regional satellite pre-cipitation corresponds to the arithmetic average of rain accumulation retrieved within 3 by 3 Meteosat pixels centered at the location of each ground station.
0 2 4 6 8 10 12 14 16 18 20 29/ 10 /20 04 30/ 10 /20 04 31/ 10 /20 04 1/ 11 /2 004 2/ 11 /2 004 13/ 11 /20 04 14/ 11 /20 04 18/ 12 /20 04 19/ 12 /20 04 20/ 12 /20 04 26/ 12 /20 04 27/ 12 /20 04 Day D aily pr ecipitation (m m /day) Rain gauges Calibrated CST Original CST r = 0.86 r = 0.60
Figure 5. Mean regional daily precipitation for the four examined periods.
16
Fig. 5. Mean regional daily precipitation for the four examined pe-riods.
Several measures of the closeness of the estimates to the observed values are the correlation coefficient (r), the mean square difference (RMSD), the bias, the mean absolute dif-ference (MAD) and the percent difdif-ference (PDF).
186 H. Feidas et al.: Application on rain events over eastern Mediterranean
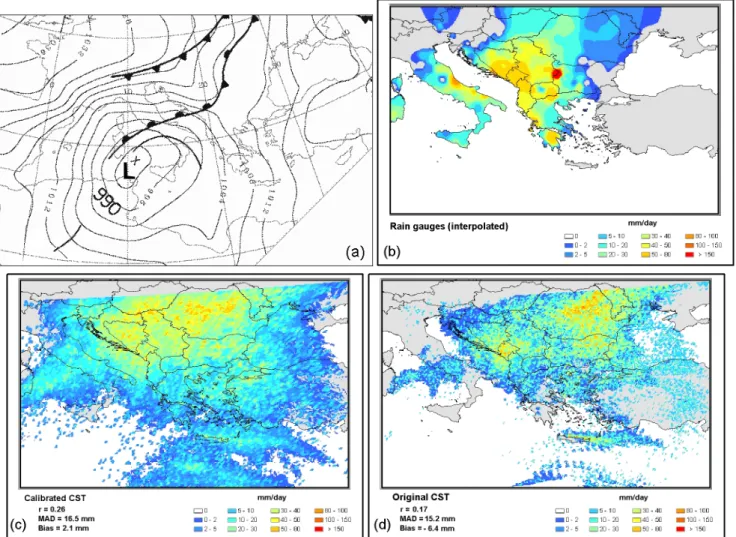
Figure 6. (a) Surface map with 4-hPa interval at 00:00 UTC on 14 November 2004; daily accumulated precipitation derived from (b) ground observations, (c) calibrated and (d) original CST projected in a regular latitude-longitude mesh. Statistics between ground measurements and satellite estimates on a single station basis are also presented.
17
Fig. 6. (a) Surface map with 4-hPa interval at 00:00 UTC on 14 November 2004; daily accumulated precipitation derived from (b) ground observations, (c) calibrated and (d) original CST projected in a regular latitude-longitude mesh. Statistics between ground measurements and satellite estimates on a single station basis are also presented.
3 Results
3.1 Quantitative validation
In order to validate both rainfall retrieval algorithms against gauge measurements, we first intercompared the accumu-lated precipitation measured by each of the pluviometric sta-tions with the corresponding satellite retrieved rain depths. The intercomparison was implemented in terms of precip-itation accumulated over different time scales (6, 12 and 24 hourly intervals) and estimated for the four periods as a whole and for each period separately.
Scatter diagrams and frequency histograms for the four periods as a whole are given in Fig. 4 with the associ-ated statistics provided in Table 1. This type of compari-son shows rather low correlation coefficients (0.23–0.38) and high errors for the calibrated technique (Table 1a). The pos-itive values of bias errors (0.6–2.3 mm) indicate a system-atic overestimation of the precipitation values. The tech-nique performance is gradually improved when estimated
precipitation are averaged over larger time intervals (from 6 to 24 h). The CST/Met-7 overestimates weak rain rates (<30 mm/day) whereas, conversely, underestimates intense precipitation (>60 mm/day) (Fig. 4a, c). Since, however, weak precipitation prevails in the dataset the overall bias be-comes positive. The poor correlation is also reflected in the uneven and widespread pattern of the distribution of points in the scatter plot (Fig. 4a). Although the calibrated CST induced a significant improvement in the correlation coeffi-cients compared to those of the original technique, most er-rors are slightly deteriorated (Table 1). The overestimation of weak rain rates by the original CST is less intense resulting in a small negative bias; the pattern of the scatter plot, however, is less widespread indicating a better correlation (Fig. 4b).
As a second step in this study, we determined the corre-spondence between the average regional precipitation mea-sured by rain gauges in the whole area of study with the cor-responding average estimated from satellite data, according to the methodology described in the previous paragraph. This type of comparison provides high correlation coefficients for
Figure 7. As in Figure 6 but for 27 December 2004.
18
Fig. 7. As in Fig. 6 but for 27 December 2004.
the calibrated CST (0.79 to 0.86) – distinctly higher than in the case of comparison on a single station basis - and a bias error that indicates an overestimation of the precipitation (Ta-ble 2). Rain retrievals of the original CST correlate less ef-ficiently with rain gauge data (r from 0.51 to 0.60); errors, however, are similar to those of the calibrated technique with the exception of the bias errors which takes very low values. The comparison between the average regional daily precipi-tation recorded by gauges and the corresponding value esti-mated by both satellite techniques is presented in Fig. 5. Both techniques show the same general pattern, with limited quan-titative variations among them. Although the calibrated CST correlates better with the situ data, its tendency for overesti-mating precipitation is evident. The most evident limit of the CST is that the discrimination between convective and strati-form clouds is still unsatisfactory in mid-latitudes where cold thick cirrus clouds dominate in frontal cloud bands, a feature that is intrinsic in all the IR techniques.
3.2 Qualitative validation
The calibrated CST is next qualitatively investigated in the context of whether the spatial distribution of rainfall can be accurately determined. To achieve this we chose to present two cases of convective systems over eastern Mediterranean associated with different rainfall patterns. The gauge daily precipitation data and the corresponding estimates from the two satellite techniques (original and calibrated) along with surface weather maps are presented for both cases in Figs. 6 and 7. Comparison statistics (observations with satellite es-timates) on a single station basis are also presented.
On 14 November 2004 a persistent low pressure centre was positioned east of Sicely at 00:00 UTC (Fig. 6a) asso-ciated with a cut-of-low at the 500 hPa (not shown). During the next hours the system slowly moved NE towards Adri-atic Sea. The release of instability ahead of the system was supported by favourable dynamics resulting from the conver-gence of the inflow of unstable warm and moist low-level air in conjunction with the diffluent flow at the 500-hPa level. As a result intense precipitation occurred in the northern part of the Balkans peninsula (Fig. 6b). In this case both
188 H. Feidas et al.: Application on rain events over eastern Mediterranean techniques, original and calibrated, provide unacceptable
re-sults with very low correlation coefficients (r=0.19 and 0.26) and large errors. The technique erroneously assigns convec-tive precipitation in areas (e.g. Rumania) where cold thick cirrus clouds of frontal origin produce stratiform rain.
In the second case of 27 December 2004, an occluded frontal depression was located over northern Italy (Fig. 7a). The low-pressure system remained stationary and filled dur-ing the same day. Several mesoscale convective systems were triggered in northern Italy and nortwestern Balkans by low-level forcing for ascent along the associated fronts in combination with considerable forcing associated with an upper level cut-of-low (not shown). An inspection of the rainfall maps reveals that both techniques exhibit a spatial rainfall distribution – mainly in the north-eastern part of the area – which is in general agreement with the rainfall pattern obtained using the rain gauge network (Figs. 7b to c). The calibrated CST technique performs better (r=0.56) with only a slight underestimation of precipitation (bias=1.3 mm). Lo-cations and magnitudes of the local convective maxima co-incide adequately with those of the rain gauge network over the north-western part of the area. The technique, however, erroneously locates a large number of convective cores in the cloud band related to the warm front in the south-eastern Mediterranean Sea. The performance of CST is worsened – though not significantly – when the original technique is implemented (r=0.47) presenting a general underestimation tendency (bias=−5.3 mm) evident mainly for weak precipi-tation estimates, which might be attributed to the lower tem-perature threshold used for the stratiform area definition in combination to a more stringent screening of the convective cores.
4 Conclusions
The well-known infrared satellite technique CST was cali-brated using PR data for the area of Mediterranean and ap-plied to four convective systems to test its performance for reproducing rainfall at mid-latitudes. The comparisons be-tween satellite and rain gauge measurements performed on a single station basis provide rather low correlation coefficients and large errors. The calibrated CST overestimates weak rain rates whereas, conversely, underestimates intense precipita-tion. The technique performance is gradually improved when estimated precipitation are averaged over larger time inter-vals (from 6 to 24 h). In order to obtain a more satisfactory reproduction of the rainfall data, a regional average is neces-sary. A pixel-by-pixel comparison between calibrated CST retrievals and PR observations from TRMM orbits, different from those used in the calibration procedure, would provide a more comprehensive picture of the method’s performance and a further development of this work could be to this direc-tion.
In general, the validations clearly show that the perfor-mance of the CST is improved when its rain parameters are adjusted to the geoclimatic conditions of the Mediterranean region. This improvement, however, is restricted by the in-herent shortcoming of infrared techniques – originally devel-oped for convective cloud systems over the tropics – in dis-criminating convection in the frontal clouds of mid-latitudes. Acknowledgements. This work was conducted in the frame of the
SATERM (A Satellite Technique for Estimating Rainfall over the Mediterranean basin) project funded by the Project “Competi-tiveness”, Action 4.3.6.1d “Cooperation with R&T institutions in non-European countries” of the General Secretary of Research and Technology, Ministry of Development of Greece.
Edited by: V. Kotroni and K. Lagouvardos Reviewed by: anonymous referee
References
Adler, R. F. and Negri, A. J.: A satellite infrared technique to esti-mate tropical convective and stratiform rainfall, J. Appl. Meteo-rol., 27(1), 30–51, 1988.
Negri, A. J., Adler, R. F., and Xu., L.: A TRMM calibrated rain-fall algorithm applied over Brazil, J. Geophys. Res., 107, 8048– 8062, 2002.
Negri, A. J., Adler, R. F., and Xu, L.: A TRMM-calibrated infrared technique for global rainfall estimation, in: Proceedings of 12th Conference on Satellite Meteorology and Oceanography, 9–13 February 2003, Long Beach, CA, USA, P4.13., 2003.