LIBRARY OF THE
MASSACHUSETTS INSTITUTE OF
TECHNOLOGY
MASSACHUSETTS
INSTITUTE
OF
TECHNOLOGY
50MEMORIAL
DRIVE
CAMBRIDGE,
MASSACHUSETTS
02139 MAR 11 74 tWORKING
PAPER
ALFRED
P.SLOAN
SCHOOL
OF
MANAGEMENT
THE EFFECT OF PROBABILITIES ON THE
SUBJECTIVE EVALUATION OF LOTTERIES
Uday S. Karmarkar
THE EFFECT OF PROBABILITIES ON THE SUBJECTIVE EVALUATION OF LOTTERIES
Uday S. Karmarkar
698-74 February 74
MASS. .
.NHI4-no.k9S-"74
ABSTRACT
The descriptive ability of the expected utility formulation
has been questioned in many investigations. Counterexamples
such as the Ellsberg and Allais paradoxes have been posed
that lead to choices inconsistent in the expected utility framework. It has been suggested that these effects are
re-lated to the probabilities involved.
It is hypothesised that the probabilities involved in a
lottery are imperfectly processed in subjectively evaluating
the lottery. A simple experiment is proposed to test this
possibility. Some preliminary results are reported which appear to demonstrate such an effect, and the implications of the results are briefly discussed.
-1-1.1 INTRODUCTION
Utility theory is commonly said to have originated with D.Bernoulli in his
examination of the so-called St. Petersburg game. This well known game
consists of a sequence of coin tosses which is to be terminated at the first appearance of a "head". If the "head" occurs on the ith toss, the gamble
pays $ 2
1
. It is simple to verify that the expected value of the gamble is
infinite. This gamble appears to pose a paradox since despite its infinite expected monetary value, it is obvious that most people would not pay very large sums for the opportunity of participating in the game. Bernoulli's conclusion was that the criterion of Expected Monetary Value (EMV) is nei-ther a good descriptor of human behavior under uncertainty, nor a very
use-ful guide to decision making. To resolve the apparent paradox he suggested that each equal increment of gain yielded an increase in value that was
inversely proportional to the individual's wealth. [1]
The concept of diminishing marginal utility for money and other goods has
come to be generally accepted and is used as a fundamental assumption in
microeconomic theory. An axiomatic basis for utility theory and the expected utility approach was provide by Von Neumann and Morgenstern in [2] and
recent developments have leaned heavily on the axiomatic approach.A more compact and operationally oriented set of axioms are the so-called Savage axioms (Appendix A) which have been used as the basis for Decision Analysis
and Statistical Decision Theory[3,4]. A collection of some important papers in utility theory has been presented by Page[5] and is a useful
in-troduction. A rigorous mathematical treatment of topological utility theory based on preference orderings is provided by Fishburn in [6].
1.2 Expected Utility and Behavior
It is the avowed purpose of utility theory to provide a normative guide to
action rather than to function as a general descriptor of all human decision making behavior. However, as was recalled in the section above, the concept of utility originated as a way to describe a very noticeable behavioral phenomenon unexplained by the prevalent notions of "rationality", and later developments have not changed this fact. The assertion of the normative
2-nature of utility theory is a hedge against the totally unstable and
inconsistent behavior that the theory might be called on tb explain, should the assertion not be made. Let us hasten to note that of course
if the axioms are held to be true, then the theory follows as a logical
consequence, and the claim of normative validity is fully justified. However, if it can be demonstrated that there exists a stable behavioral phenomenon relating to preference, choice and decision making, and if the expected utility paradigm is insufficient to describe this phenomenon,
then certainly we must look for extensions or modifications to the theory.
Of course, utility theory is only one part of the expected utility formu-lation; the other component is the concept of subjective probabilities. Subjective probabilities are defined in the approach of the Savage axioms in terms of "canonical lotteries" and our later investigations will take note of
this fact. Given the utilities and the subjective probabilities associated with the possible outcomes posterior to each action, the optimal act is said
to be that action which maximises expected utility. This optimal act is the one that the decision maker should choose, and presumably the one that he would choose if this rule adequately represented his behavior.
1.3 Describing Behavioral Phenomena
In this section we take a naive look at utility theory as a descriptor of
human decision making behavior. The intention is to draw attention to the fact that the expected utility paradigm tallies with some natural and
intuitive notions about choice behavior. It is suggested that utility functions incorporate the description of several behavioral phenomena. The discussion is restricted to choice between lotteries involving monetary payoffs.
a) Diminishing marginal value for money : This is the original Bernoullian
answer to the St.Petersburg paradox [1]. Money has value to a person, but
the value is not a linear function of the amount of money. The rate of increase of value with increase in money is not constant but is assumed to decrease.
In other words the value of an increase in payoff (of $5 say) is less when
example if we assume that the rate of increase is inversely proportional to the monetary amount (Bernoullian) , then :
dU _ k. ; U(x) = klnx is the appropriate utility fn. dx "
x
b) Relative Discriminability of monetary sums : A fixed amount of money
becomes less"noticeable" when compared with progressively larger sums. Here money is being regarded as a stimulus and the approach is that of Psycho-physics where the discriminability between varying levels of a stimulus is studied . The analogy to the case above is obvious, and in fact the classical
psychophysical function is the logarithmic Weber- Fechner law [7].
c) Certainty Equivalents and "balance points" : Consider a lottery with two
payoffs, giving a p chance at a sum x, and a (1-p) chance at x
2 . Given a
utility function U(x) the certainty equivalent (CE) is given by that q which
solves :
U(q) = pU(X] ) + (l-p)U(x
2)
We can write this as :
pU(q) + (l-p)U(q) = pU(Xl) + (1-p)U(x
2)
and:
p[U(q) - U(x,)] (l-p)[U(x
2)
- U(q)]
Thus the estimation of a certainty equivalent is analogous to finding a
balance point U(q) for a beam loaded with a weight p at coordinate U(x-,)
and a weight (1-p) at U(x
2). From a behavioral viewpoint we might
inter-pret this process as one of balancing the "probable advantage" of the
certainty equivalent over the lottery, against the "probable disadvantage".
d) Utilities as Probabilities : Raiffa [3] has shown how utilities might
be regarded as analogous to probabilities by reduction to"basic reference lotteries" . Let the range of monetary payoffs being considered be a subset
of [ c ,c*] so that for any payoff c we have
c*£
c<. c* and U(c*)<J(c)4J(c*).
*
Now redefine the utility function :
P(c) =[U(c) - U(cJ]/[U(c*) -
U(cJ]
so that :The P(c)'s represent a partitioning of the total range of payoffs [c*,c*]
and are analogous to probabilities. The objective function of expected utility now becomes symmetrical in probabilities and the transformed utilities.
e) Risk Aversion : Utility functions incorporate the concept of an aversion
to risk. Risk aversion exists when a situation involving uncertain outcomes is evaluated as having a certainty equivalent that is less than the expected monetary value of the gamble. The concept of risk aversion has been extensively discussed by Pratt [8] and also in [3,4].
Thus we see that utility functions and the expected utility formulation
are open to several behavioral interpretations. This has the effect of making
it difficult to separate the effects of say discriminability , underlying
value and risk aversion from a single utility curve for money. Furthermore, it is difficult to demonstrate experimentally that an observed phenomenon is not explained by utility theory, since all possible utility functions have to be shown invalid.
2.1 DESCRIPTIVE LIMITATIONS OF EXPECTED UTILITY
A survey of recent work in decision modelling in the behavioral science
area, makes it abundantly clear that for the most part utility theory is
not deemed rich enough to be a descriptive tool in the general sense. The simplest indication of this is that research into situations involving choice between lotteries continues, and the results obtained are rarely discussed in a utility theory framework. Indeed some of the experiments reported would suggest some serious limitations in utility theory in the
sense that the results appear to exhibit systematic behavioral phenomena unexplained or ignored by utility theory. Unfortunately in most of these
cases the purpose has not been to test whether the results tally with or
contradict utility theory. Furthermore , while specific effects in specific
cases are often identified, no single viable alternative representation
has emerged, although there is a plethora of possibilities, suggestions
-5-Extensive discussions of experiments, theories and models of decision making behavior can be found in Lee[9]; Coombs, Dawes & Tversky [10]; Shelley &
Bryan [11] and Thrall, Coombs & Davis [12] to name just a few sources. It is not proposed here to review these in detail or to recount the problems posed to utility theory by the various experimental studies. As stated above
the nature of the experiments conducted and the way of reporting results are
often far removed from the utility theory framework. However, there are two well-known counterexamples to the expected utility formulation which show dramatic discrepancies between observed behavior, and that suggested
by utility theory. These are briefly reviewed below.
2.2 The Ellsberg Paradox [13] :
Consider an urn filled with 30 red balls and a total of sixty black and
yellow balls -- the exact number of each being unknown. Four lotteries are constructed, where the payoffs depend on the draw of a ball from the urn.
The payoffs are given in Table I. The subject is offered a choice of one
lottery from amongst a, and ju and one from ^3 and ^4* In tne overwhelming majority of cases, £, is picked over £« and ^3 over ^4- Now it is easily demonstrated that there is no possible physical distribution of black and
yellow balls such that the choices above are consistent.
2.3 The Allais Paradox [14] :
Once again, the subject is asked to choose one from each of two pairs of lotteries as shown in Figure 1. Again there is a general tendency to pick
£, over £
2 ar|d £3 over 1.
. Now there is no single utility function such
that these choices are consistent. This can be easily shown for suppose
such a utility function does exist. Then transform this function to a
new function u such that u(0)= ; u($5,000,000) = 1 . (This is always
possible by the theory). Let u(1,000, 000) = tt (say) where < * <. 1 .
Now from the choice of «- over ^
2 we nave :
7T > 0.89* + 0.10
and hence: * > 10/11
While from the second choice :
0.11* < 0.10 or: * < 10/11
2.4 Implications of the paradoxes :
The two examples appear to raise slightly different issues. The Ellsberg paradox was put forward as suggesting that the behavior observed demon-strated an"aversion to ambiguity" which was distinct from the aversion to risk which utility functions sought to explain. It has been suggested that the axiom which is "invalidated" or "violated"
—
depending on one's point of view -- by this phenomenon is that of substitutibility of prizes.The Allans paradox on the other hand brought up the issue of discrimina-bility between lotteries. It appeared that the difference between proba-bilities of 0.10 and 0.11 was not really appreciable to most humans
—
a hypothesis with which this author is ready to concur.
From the point of view of decision theory, these two examples have been dismissed as showing "inconsistent" behavior. Raiffa has presented alter-native equivalent formulations of the two paradoxes in [15] and [3], in which more consistent responses are elicited by sheer force of logical
argument. Thus the normative validity of expected utility would appear to
have been vindicated, but are the paradoxes really refuted? It could be
said that the reformulations themselves in their claim of equivalence tacitly assume the axioms and in particular substitutability. In other words, the alternative formulations may not be equivalent from a behavioral
point of view. Be that as it may, we will here merely note that :
i) These examples demonstrate a stable behavioral phenomenon which is not explained by the expected utility framework. If the effect
is only due to "inconsistent behavior" then this behavior is remarkably widespread and systematic,
ii) The phenomenon in each case appears to have to do with the probability structure of the lotteries offered. One case is described as
having"ambiguous"probabilities, and the other involves imperfect discrimination between probabilities.
It is toward the investigation of this phenomenon that this paper is
-8-2.5 Source of the Phenomenon :
There are two viewpoints that we might take in examining the phenomenon indicated above. One approach is to try and show that the expected utility formulation is invalid in some absolute sense. This requires that we show which of the basic axioms is unacceptable, and why. In the light of the
normative validity of the axioms this would appear to be difficult to achieye. Furthermore, even from a behavioral point of view, the axioms seem to be eminently reasonable under the given preference ordering assumptions and utility theory has considerable descriptive ability as
some Of the considerations in Sec. 1.3 indicate.
The other viewpoint, and the one that we adopt here, is to consider the
effect as a factor extraneous to the expected utility formulation, which acts so that the observed behavior appears inconsistent in that framework. In other words, we are assuming an underlying utility function for money that is reasonably stable, and searching for other factors to explain the
effect observed. This viewpoint serves the purpose of casting the inves-tigation in a utility theory framework, which is thought to be desirable.
Given this approach, there is obviously one major candidate for the source
of the effect and the probability structure of the decision situation has
already been cited as being significant. In addition to Ellsberg, Fellner in [16] has examined the effect of "ambiguous probabilities". Many
inves-tigations into decision making behavior have studied the subjective effects of probabilities and their relation to decision making. It is also interes-ting to note that while the expected utility framework allows for a great
deal of variation with regard to utilities, probabilities are incorporated in a relatively rigid way.
It seems to be fairly obvious that the behavioral effect of probability structure on decision making constitutes a subject worth investigating.
3.0 THE EXPERIMENTAL PROCEDURE :
3.1 Experimental aims :
Our primary aim is to demonstrate the effect of a probability effect in decision making, as distinct from utility theory. The effect of probability structure has of course been studied previously in behavioral investigations
but apparently not in this particular context. [8,9,10]. Some experimental desiderata are :
i) The existence of a probability effect should be apparent,
ii) Any effect observed should be clearly distinguishable from those phenomena explainable by utility theory,
iii) The results should provide new information on the nature of the
effect (if any),
iv) The results should suggest fruitful approaches to further experi-mentation as well as modelling,
v) The experiment should be interpretable in terms of the expected utility framework.
3.2 Experimental Design :
With these desiderata in mind the following simple experiment was designed:
A well known method for determining utility curves proceeds by determining certainty equivalents to lotteries involving equiprobable outcomes. The usual
approach is to use 50-50 gambles, i.e. lotteries with two equiprobable
out-comes . This procedure is modified as follows :
a) The subject's utility curve over a preselected range is determined using the usual procedure with (1/2; 1/2) gambles.
b) The same procedure is repeated but this time using (3/4;l/4)
gambles with the odds always favoring the higher payoff.
c) The curve is determined a third time using (9/10; 1/10) gambles. In other words, the utility curve is determined several times using a
different constant value for the odds [p/(l-p)] in each determination.The odds are thus being used as an experimental parameter. The detailed
10-3.3 Prior Expectations about Experimental Results :
According to axiomatic utility theory, the utility for monetary payoffs
is described by a single curve. The expected utility of any lottery then provides a normative guide to choice behavior. If the framework of expected utility was sufficiently descriptive of decision making behavior, then we would expect that there would exist a unique utility curve for each subject,
independent of the specific probability of gambles.
If on the other hand the probability structure of a gamble has an effect on decision making behavior above and beyond the weighting effect
incor-porated in the expected utility formulation, we could expect some evidence of this to appear in the experimental results. As described above, the odds
of the gambles offered are being used to parametrise the experiment, and in the presence of a probability effect, the experiment should yield separate and distinct utility curves for each different value of the odds used.
In the absence of any prior theoretical model 1t is difficult to make guesses about what effect might actually be observed and how it might be interpreted. However it is noted that the significant possibilities are :
a) An increase in risk aversion
b) A decrease in risk aversion
c) More complex and local effects.
Further discussion of observed effects and their interpretation is deferred to a later section.
4.1 PRELIMINARY EXPERIMENTATION
Preliminary runs were made with the experiment to test whether the experimental design did in fact fulfil some of the desiderata listed above. These
pre-liminary experiments were not rigorous in the sense that the selection of subjects was not random and the experiments were conducted somewhat
infor*-mally. The results obtained with four subjects are reported in tables
II-V
-11
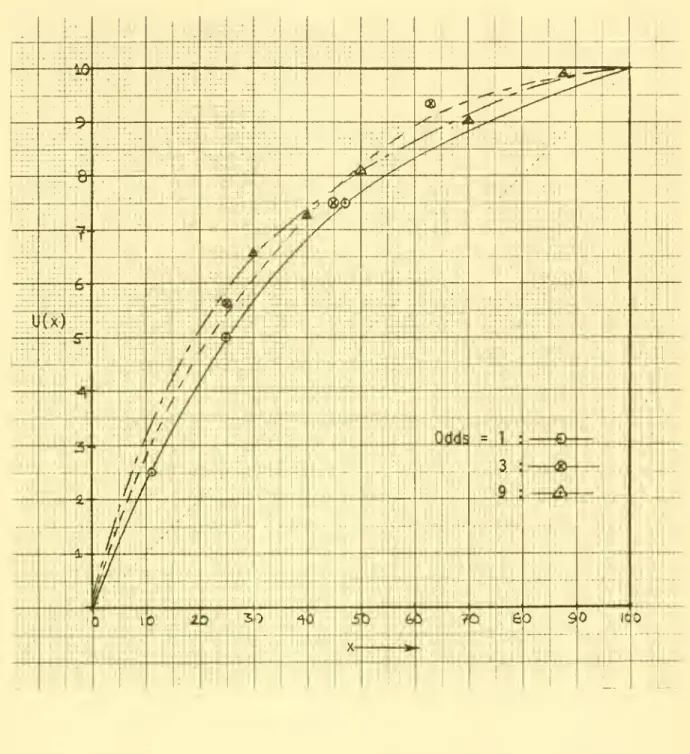
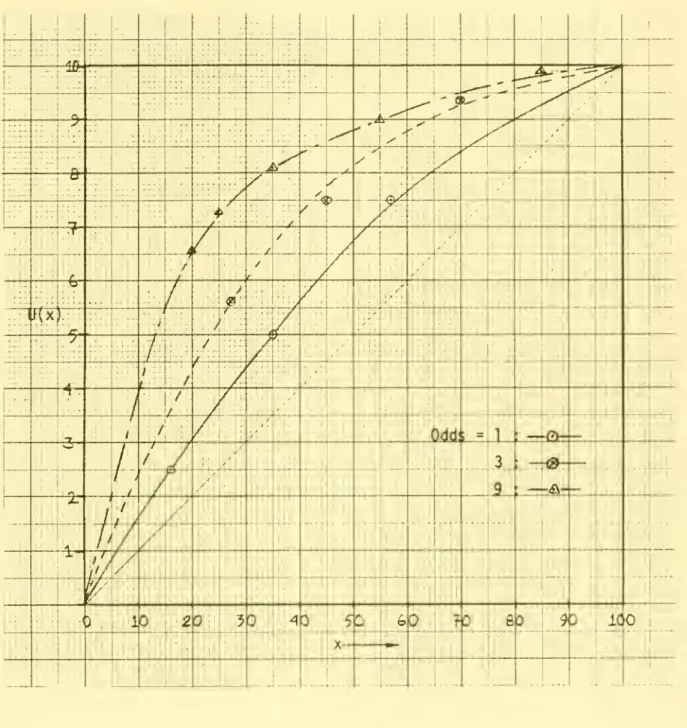
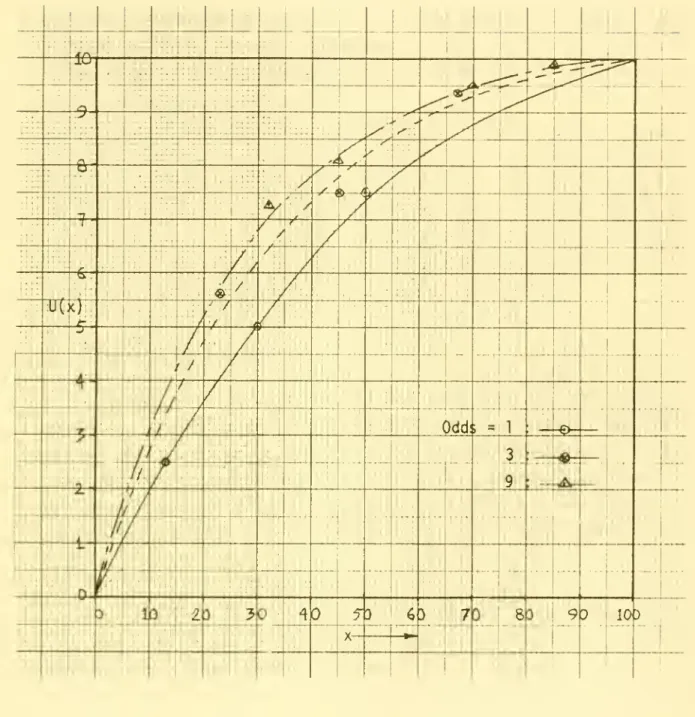
17-The results appear to clearly demonstrate the existence of an effect due to
probability structure. The general tendency is towards an increase in risk
aversion with increasing odds. Even if the assumption of a single-valued utility curve were relaxed to allow small variations in the neighborhood of the curves obtained, it appears that the effect is still so pronounced
as to be clearly discernible.
The curves have been faired through the observations by hand. At first sight it seems that the curves can be described as deviations from a
basic utility curve, where the deviation is solely a function of the odds. This is discussed further in the next section and the latter conjecture is thought to be false. The curves a type of regular behavior for subjects
A and C while they intersect for subjects B and D which also suggests a more complex model than simple parametrization by the odds.
4.2 Observations & Comments :
i) It was observed by the investigator, and subjects often explicitly commented that evaluating the lottery offered was easiest when the lottery
was a 50-50 gamble (p=l/2, odds = 1 ; odds is always taken here to mean
"odds favoring the higher payoff"). This reinforces the proportionating or balancing analogy which was suggested earlier for the process of
determining certainty equivalents. Rearranging the last equation in Sec. 1.3(c) :
P
[U(xJ
- U(q)]= ; where q= the certainty equivalent.
(1-p) [U(q) - U(
Xl )]
When the odds of the lottery equal one, the decision maker has only to "balance" the utilities of the payoffs and is in a sense able to disregard
the probabilities involved since they are equal for the two outcomes. ii) This suggests that the utility curve obtained with 50-50 lotteries could be regarded as the subject's basic or "true" utility curve since the
relative preferences between payoffs are evaluated without having to account
18-iii) Assuming the existence of an underlying utility curve representing
the decision maker's "true" relative preference for monetary payoffs ,the
other curves may be regarded as being generated as deviations from the
basic curve due to the effect of probability structure. Clearly the deviation
is related to the odds of the lottery.
iv) The paradoxes in sections 2.2 and 2.3 suggested two types of
pro-bability effect. The
EUsberg
example suggested that "ambiguity" or "uncertainty" was an important characteristic of a lottery. In our case, the probabilities of events are not ambiguous in the sense emphasised byFellner and so this type of effect is not being tested since canonical probabilities are used in the experiment. However the"uncertainty" of the lottery could be interpreted in terms of the entropy of the lottery.
In this case, the most uncertain gamble,iue. the one with the highest entropy is the 50-50 gamble (odds=l). Thus the deviation from the basic curve representing an increase in risk aversion would appear to increase with a decrease in uncertainty which is contrary to the notion of an
independent "aversion to uncertainty". We reiterate that the question of "ambiguity" has not been approached here.
v) The increase in risk aversion with decrease in uncertainty suggests
the alternative viewpoint of considering the amount of information available.
As was discussed in (i) above, less information has to be processed in the case of 50-50 gambles in evaluating the gamble. That is to say, risk aversion increases with an increase in the information load. This is not incompatible with the Ellsberg example since it is presumable more difficult to evaluate
the case of an ambiguous lottery.
vi) As the odds increase the information load at first increases (the
uncertainty decreases). However, as the odds approach infinity, i.e. as one outcome becomes certain, the lottery becomes a choice between certain outcomes. We could expect that in such a case the deviation from the true preference curve decreases, so that the deviations are not
nece-ssarily monotonically increasing with the odds. The most we can say at this point is that the information contained in the probability structure
-19-vii) The Allais paradox was concerned with discriminability between probabilities which tallies with the proportionating analogy and the
idea of imperfect conservative processing of information. However any real test of relationships between the effect demonstrated here and
the two paradoxes must await the development of some mathematical
model describing the results.
viii) Suppose we try to represent the observed results as a function of the odds of the lottery alone. It would be useful and desirable if
it could be established that the effect observed was solely dependent
on the probabilities involved.
Let us represent by U (x) the utility curve determined with odds equal
a
to a. Thus U, (x) represents the basic utility curve .Now given that
a subject's preferences are represented by U, (x), we can calculate for
each observation the "perceived odds" implied. The "perceived odds"(0 )
are given by the formula :
U, (q) - U 1
(xj
°P 1>1 (x*) - U ] (q)where : q = The elicited certainty equivalent
x*= The lower payoff
x*= The higher payoff.
If the observed phenomenon is purely an effect of the probabilities involved, we would expect the perceived odds to depend only on the actual odds. That
is to say, all lotteries with the same odds should result in the same value of perceived odds. This type of analysis is easily performed with the data available and the results for the four subjects are shown in Tables VI-IX.
It appears from these results that the hypothesis of a pure effect due to
probabilities is not a viable one. The effect must therefore also depend
on the utilities involved. The data is too sketchy and perhaps not rigo-rous enough to warrant extensive investigation at this point. Future
inves-tigations should certainly attempt to explore this point further and it would be useful to employ a larger set of values for the odds tested.
20-
-21-a
-oo
-o>
O) o $-<u a. IX) t-- CO CM i— 00o
-22- -23-cm CM CO .— 00 CM CM i— i— oo to CM OO ro i— to
o
-OO
-a a> > •r-0) O s. r— cr> <a-CO CM r— cr>o
r-. to *d- r—N
Ol (O • • • oo cr> co co to LO LOo
O* C_5 O-i toO
to 00 CO 00 CTl to CO LD LO eno
LO CO CM toO
lo CM CO to 00 l-> o <D •r-> oo * X * cn to to oo cdo
-ao
o
ai > •i— 0) o J-0) O-cr> to oo oo' CT> to cu * Xo
o
' LO «3-O
O
O
O
O
LOo
o
L0 -a -ao
<y>
•24-ix) The results obtained can be tested for stability over time by
repeating the experiment for any subject after a suitable period of
time. Of course if a change occurs in the subject's asset position or
if his attitude to money changes due to some other event, it could be expected that his utility curve would change. The experiment was repeated
for subjects A and B. In the case of subject A5 in the period between
experiments the subject's asset position and monetary expectations changed considerably and the subject generally showed less risk aversion in all
his responses. In the case of subject B no significant changes were observed and the results were quite stable. The results of these trials are displayed in tables X and XI and in figure 6 .
Repetitions of the experiments in situations where no major change in
asset position or other factors occurs, provides replicate data which
can be used to estimate error distributions for the experiment, and
this provides the basis for tests of statistical significance. In cases
where there is a change in the subject's attitude toward money, the repeat experiment is also of great value : The replicate experiment also
shows a probability effect. Now if the chlange in attitude is assumed to be reflected as a change in the basic utility curve, then the deviations in the replicate should be predictable from the results of the first experiment and the new basic U, (x) curve.In other words even if
the utility curve changes the probability effect should remain invariant. Of course we have seen that the effect does not appear to be purely a
probability effect and hence we cannot expect the "perceived odds" in
the replicate to be the same as the first. Nevertheless these are shown
in table XII for any information that they may convey.
x) One trial experiment was made with subject C with odds of 3
favoring the lower payoff ( p=l/4 ; 1-p = 3/4). The resulting curve
U-i/
3(x) fell between U-, and IL . Now if the effect was dependent only
on the odds involved we might have expected that U., = U,
/3 . So that
again it appears that the deviations are dependent on the particular utilities involved.
-25-Odds 1/2 3/4 9/10 U(CE) CE 100
-26-Odds 1/2 3/4 9/10 U(CE) CE 100
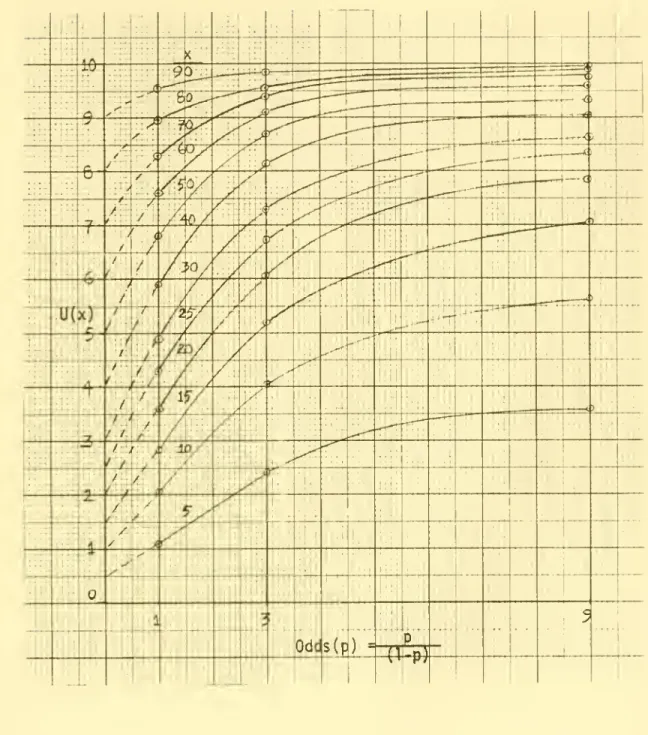
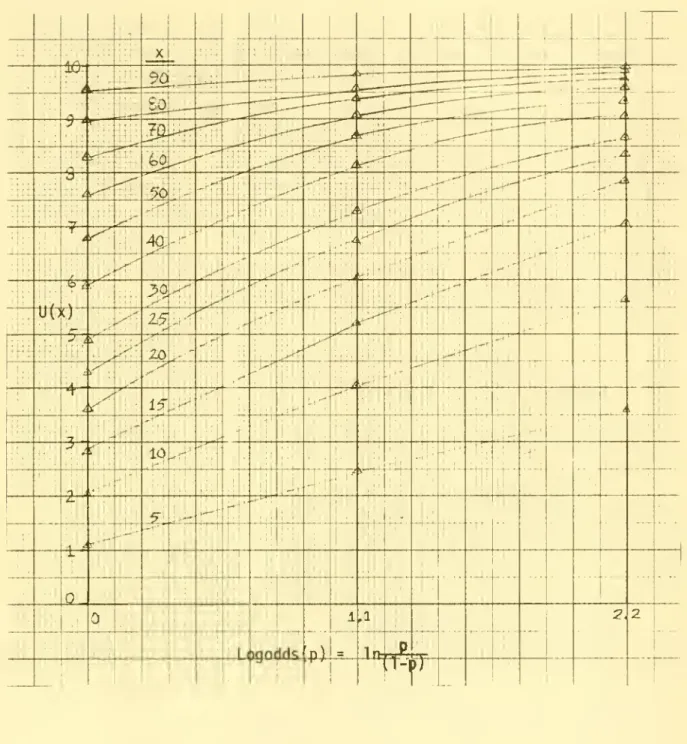
-28-xi) In continuing the search for insights into the behavioral process, the graphs in figures 7,8 and 9 were plotted using data derived from figure 2 representing sabject A. The three variables of interest are x, U(x) and
the odds. The intention was to suggest possible approaches to model building,
The results were not tremendously illuminating although figure 9 suggests that the log odds may be an important variable.
4.3 Conclusions :
a) Subjective evaluation of a lottery is affected by the probability structure of the lottery
b) This probability effect cannot be described within the expected utility framework
c) The effect may possible be conceptualised as : deviations from an
under-lying utility curve caused by imperfect, conservative subjective processing of probabilities.
d) However in this type of model, the deviations are not purely a function of the probabilities but also appear to depend on the utilities involved.
4.4 Further Work :
Some attempt at modelling of the observed data is advisable as it would serve to give some direction to future investigations. The importance
of the odds or the logarithm of the odds, and the dependente on the utilities have been cited as relevant factors. It has also been suggested that the
29-APPENDIX A.
Axiomatic Approach to Decision Theory :
This somewhat informal approach to the notions underlying Decision Theory
is after [3,4].
The basic decision situation is conceptualised as a canonical lottery in which prizes are awarded depending on the outcomes of a canonical experi-ment. A canonical experiment for a particular decision maker (d.m.) is one
in which he regards all outcomes as equally likely. If there are N such
outcomes and if an event A is defined as the occurrence of one of n of these outcomes, then the canonical chance of A is defined as n/N.
The behavioral assumptions of the theory are : I. Canonical Basis :
Suppose that prize W is preferred to prize L. Given a canonical experiment with N outcomes and two lotteries : lj gives prize W on the occurrence of
one of n-, outcomes and L otherwise, and 1
2 gives
prize W on the occurrence
of one of n
2 outcomes and L
otherwise; then lottery lj is preferred to 1 2 if and only if n 1 is greater than n 2
-Ha.
Quantification of Preferences :Given any decision situation under uncertainty with a set of possible
con-sequences C, there is a consequence c* at least as attractive and a conse-quence c* at least as unattractive as any of the possible consequences. The preference for any particular consequence c can then be quantified by stating a number tt(c) between and 1 such that the d.m. is indifferent
between c for certain and a canonical lottery offering a chance tt(c) at
prize c* and a complementary chance 1-tt(c) at c*. lib. Quantification of Judgment :
Let A be any real world event and c* and c* as above. The d.m.'s judgment about A can be quantified by specifying a number P(A) between and 1 such
that the d.m. is indifferent between a canonical lottery offering a chance P(A) at c* and l-P(A) at c* , and a "real world lottery" offering prize
c* if A occurs and prize c* if A does not occur. The number P(A) is then
30-III. Transitivity :
Let 1-,, 1
2 and 1- denote three lotteries. a) If the d.m. is indifferent between 1, and 1
2 and between 1~ and 1.,, he is indifferent between 1, and 1,.
b) If the d.m. is indifferent between 1, and 1„ but prefers lp to 1~ , he
prefers 1, to I.,.
IV. Substitutibi1ity of Prizes :
If a lottery (real or canonical) is modified by replacing one of its prizes with another, and if the d.m. is indifferent between the old and new prizes then he is different between the old and new lotteries.
In particular this is true if an outcome c of a real world lottery is replaced by the appropriate canonical reference lottery (as in
Ha.)
involving c* and c*.It can now be shown [3,4] that any real lottery can be reduced to a canonical
lottery involving c* and c*. To choose between two lotteries the respective reduced canonical lotteries are compared and the one offering a better chance
at c* is preferred by I. It is also shown that this is equivalent to picking
•31-APPENDIX B.
Procedure for Experimental Determination of Utility Curves:
i) Select an appropriate range of payoffs.
A range of payoffs of $0 to $100 was thought to be appropriate for subjects who are students with limited earning capability. The range of payoffs is
chosen so as to involve sums of money that the subject is familiar with in the sense that he can make realistic decisions about them.
ii) Assign arbitrary values to the utilities of the endpoints of the
range of payoffs chosen.
Let U(100) = 10 and U(0) = (say) so that the utility curve is "pinned
down" at these two points. This can always be done since choice between lotteries is unaffected by a positive linear transform of the utility function. That is : If U(x) is a utility function, then U'(x)= a + bU(x)
is a strategically equivalent utility function leading to the same decision making behavior.
iii) Given payoffs x, and x
2 such that U(x,) and U(x2) are
known (have been assigned), partition the range by constructing a lottery offering a
chance p at x, and a chance (1-p) at x«. To start with, we would take x-,=100 and x
2
= 0. To ensure canonicity of the
lottery offered,the subject could be supplied with a physical model of
an experiment with equally likely outcomes or with some other model
representing the chance p at prize x, . An urn model is particularly convenient.
iv) Determine the subject's Certainty Equivalent (CE) for the lottery,
and hence determine an intermediate point on the subject's utility
curve.
We already know U(CE) from the equation :
U(CE) = pU(X] ) + (l-p)U(x
2)
where all the quantities on the right hand side are known. In practice a
single value for the CE is difficult to elicit and it is customary to
find instead a sum preferred to the lottery, and a sum less preferred than the lottery, between which points the CE lies. A figure lying in this
interval may be taken as an approximation to the CE which is sufficient
-32-v) Repeat the partitioning process as in (iii) until a sufficient number of points have been obtained to fair a curve over the whole range.
Four points should be sufficient to get a good idea of the curve. To determine many more might tax the patience of both the subject and the
investigator.
The procedure employed in the present case was essentially as above with one extension :
For each subject separate utility curves were determined over the whole range of payoffs, using different fixed values of p for each deter-mination. The particular values used were p = 1/2, 3/4 and 9/10 with
33-to oo oo
o
CTiO
LO LO • • • OO i— ,— too
o
•a >u
s-<D O-co34-Figure 7 : x, U(x) vs. H(p) ; Subject A
-35-Figure 8 : x, U(x) vs. Odds(p) ; Subject A
-36-Figure 9 : x, U(x) vs. Logodds(p) ; Subject A
-37-REFERENCES :
1. Bernoulli, D.; "Specimen Theoriae Novae de Mensura Sortis"; trans.Sommer
L.; Econometrica ,22, 23-36(Jan.l954)
.
2. Von Neumann,J.; Morgenstern, 0; The Theory of Games and Economic Behavior;
Princeton Univ. Press; (1953).
3. Pratt ,J.;Raiffa, H.; Schlaifer, R.O. ; Introduction to Statistical Decs ion
Theory ; McGraw-Hill, (1965).
4. Raiffa, H.; Decision Analysis : Introductory Lectures ; Addison Wesley;
(1968).
5. Page.A.N.; Utility Theory: A Book of Readings ; John Wiley & Sons;(1968).
6. Fishburn, P.C.; Utility Theory for Decision Making ; John Wiley & Sons;
New York;(1970).
7. Fechner, G.T.; Elemente der psychophysik; cited in [10].
8. Pratt, J.; "Risk Aversion in the Small and the Large"; Econometrica,32
No.1-2, (Jan.-Apr. 1964).
9. Lee.W.; Decision Theory and Human Behavior; John Wiley & Sons; New York
(1971).
10. Coombs,C.H.; Dawes, R.M.; Tversky, A.; Mathematical Psychology: An
ele-mentary Introduction ; Prentice-Hall; N.J. (1970).
11. Thrall ,R.M. ; Coombs, C.H.; Davis, R.L.; Decision Processes ;John Wiley
& Sons, New York (1954).
12. Shelley,M.W.; Bryan, G.L. ;(Eds.); Human Judgments and Optimal ity ;
John Wiley & Sons; New York (1964).
13. Ellsberg, D. ; "Risk, Ambiguity and the Savage Axioms"; Quarterly Journal
of Economics ; Vol .LXXV, Nov. (1961).
14. Allais, M. ; "Le comportement de l'homme rationnel devant le risque;
Critique des postulats et axioms de 1 'ecole Americaine";
Econo-metrica, 21 (1953),503-546; (cited in [4]).
15. Raiffa, H.; "Risk, Ambiguity and the Savage Axioms: Comment"; Quarterly Journal of Economics; Vol. LXXVII (May 1963).
16. Fellner, W; "Distortion of Subjective Probabilities as a Reaction to
6?t>-73 3 TDflD
DD3 827 M5S
b<U^
MITLIBRARIES 3 TDflDDD3
TOb OMM
3 IDflO003 7Tb
367
-7*f 6<H-7* 3 1 SO003 7Tb
mi
MIT LIBRARIES3 TOfiO 3 fie?
sai
*4?-7H
MilLIBRARIES
3 TOfiO
003
flE7 fiSlHILIBftARIES fe^fe-6^7